Submitted to: November 2021 - The Comprehensive Economic Development Impacts of the Rooftop Solar Power Industry on the State of Florida
←
→
Page content transcription
If your browser does not render page correctly, please read the page content below
The Comprehensive Economic Development Impacts of the Rooftop Solar Power Industry
                             on the State of Florida

The Comprehensive Economic Development Impacts
       of the Rooftop Solar Power Industry
               on the State of Florida

                                  Submitted to:

                                 November 2021

                      2655 LeJeune Road, Suite 541, Coral Gables, FL 33134
        T: 305-461-3811 – F: 305-461-3822 | E: info@weg.com | W: www.weg.com

                                         --
The Comprehensive Economic Development Impacts of the Rooftop Solar Power Industry
                                               on the State of Florida

Table of Contents

I.          Executive Summary ............................................................................................................................... 1

II.         Supercharged: How the Sunshine State’s Rooftop Solar Power Industry
            Supports Florida’s Economic Development............................................................................. 3

III.        The Annually Recurring Economic Impacts of the Rooftop Solar Power
            Industry’s Ongoing Operations Contribute Significantly to the Economic Well-
            Being of Florida ..................................................................................................................................... 10

            A. The Rooftop Solar Power Industry is an Important Contributor to Overall
               Economic Growth and the Well-Being of Florida Residents ..................................... 11
            B. An Estimated 40,462 Jobs are Supported Throughout Florida by the Ongoing
               Operations of the Rooftop Solar Power Industry .......................................................... 12
            C. The Rooftop Solar Power Industry Ongoing Operations Contribute
               Substantially to the Standard of Living of Florida Residents .................................. 13
            D. Gross Domestic Product Impacts: The Rooftop Solar Power Industry’s Ongoing
               Operations are Important to the Overall Economic Activity in Florida............... 15
            E. The Total Economic Impact Generated by the Florida Rooftop Solar Power
               Industry is a Significant $18 Billion ................................................................................... 16
            F. The Florida Rooftop Solar Power Industry Generates Important Contributions
               to Public Revenues Each Year .............................................................................................. 18

Appendix I:              Methodology ........................................................................................................................... 19
Appendix II: Economic Glossary .............................................................................................................. 22
Appendix III: Detailed Economic Impact Tables .............................................................................. 24
Appendix IV: The Washington Economics Group, Inc. Project Team and
             Qualifications ............................................................................................................ 30

                                                                                      -i-
The Comprehensive Economic Development Impacts of the Rooftop Solar Power Industry
                                         on the State of Florida

List of Tables and Figures

Tables

Table ES-1. Summary of the Annual Economic Impacts Generated in Florida by the
            Ongoing Operations of the Rooftop Solar Power Industry .......................................... 2
Table 1.        Summary of the Annual Economic Impacts Generated in Florida by the
                Ongoing Operations of the Rooftop Solar Power Industry ........................................11
Table 2.        Total Jobs Supported in Florida by the Ongoing Operations of the Rooftop
                Solar Power Industry .................................................................................................................12
Table 3.        Household Income Generated in Florida by the Ongoing Operations of the
                Rooftop Solar Power Industry ...............................................................................................14
Table 4.        GDP (Value-Added) Impacts Generated in Florida by the Ongoing Operations
                of the Rooftop Solar Power Industry ..................................................................................15
Table 5.        Total Economic Impact Generated in Florida by the Ongoing Operations of the
                Rooftop Solar Power Industry ...............................................................................................17
Table 6.        Fiscal Contributions Arising from the Ongoing Operations of the Rooftop Solar
                Power Industry in Florida ........................................................................................................18

Figures
Figure 1.       The Swanson Effect ....................................................................................................................... 4
Figure 2.       Florida Annual Solar Installations .......................................................................................... 5
Figure 3.       Total Jobs Supported in Florida by the Ongoing Operations of the Rooftop
                Solar Power Industry .................................................................................................................13
Figure 4.       Household Income Generated in Florida by the Ongoing Operations of the
                Rooftop Solar Power Industry................................................................................................14
Figure 5.       GDP (Value-Added) Impacts Generated in Florida by the Ongoing Operations
                of the Rooftop Solar Power Industry ...................................................................................16
Figure 6.       Total Economic Impact Generated in Florida by the Ongoing Operations of the
                Rooftop Solar Power Industry................................................................................................17

                                                                              -ii-
The Comprehensive Economic Development Impacts of the Rooftop Solar Power Industry
                                        on the State of Florida

I.     Executive Summary

n      The Rooftop Solar Power Industry in Florida is a catalyst for the State’s sustainable
       economic development, according to The Washington Economics Group, Inc. (WEG)
       Comprehensive Economic Development Impact Study. WEG was retained by
       Conservatives for Clean Energy to analyze the economic development impacts of the
       Industry on the State of Florida’s economy.

n      The Qualitative Section that follows this Executive Summary dives deep into the
       multifaceted and growing qualitative benefits of the Rooftop Solar Power Industry
       activities as a whole. These additional positive impacts, so-called “externality
       benefits,” go well-beyond the quantification of economic impacts on Jobs supported,
       Household Income, Gross Domestic Product (GDP) and other economic indicators
       that are presented in this Study.

n      The multifaceted “externality benefits” of the Rooftop Solar Power Industry are
       visualized in the Matrix below.

n      In addition to the above externality benefits, the Florida Rooftop Solar Power
       Industry’s growing operations generate significant quantifiable economic impacts
       throughout Florida. The quantifiable economic impacts generate high-wage

The Washington Economics Group, Inc. (WEG)                                                      Page | 1
The Comprehensive Economic Development Impacts of the Rooftop Solar Power Industry
                                          on the State of Florida

         employment for Florida residents and important contributions to Household Income
         each year, among other economic impacts. Section III of the Study analyzes these
         economic impacts in greater detail and are summarized in Table ES-1 below.

      Table ES-1. Summary of the Annual Economic Impacts Generated in Florida by the Ongoing
                   Operations of the Rooftop Solar Power Industry (by Impact Type)
                                                                                        Total
    Impact on:                                       Direct    Indirect     Induced
                                                                                       Impact
    Employment (Jobs)    ∗
                                                                  8,907        15,774        15,781         40,462

    Household Income ($ Million)                                 $1,331        $1,114          $735         $3,179

    GDP (Value Added - $ Million)                                $6,488        $2,746        $1,375        $10,609

    Federal, State & Local Tax Revenues ($ Million)                  ---            ---           ---       $3,257

    Total Economic Impact ($ Million)                           $10,730        $5,166        $2,426        $18,322
    Note: Total may not equal the sum of all due to rounding.
    Source: The Washington Economics Group, Inc. (WEG)

n        The large annually recurring economic impacts make the Florida Rooftop Solar Power
         Industry a top contributor to the State economic activity and a major source of job
         opportunities statewide:

         o $18.3 billion in Total Economic Impact
         o 40,462 Employment (Jobs) supported
         o $3.2 billion in Household Income to Florida workers
         o $10.6 billion in contribution to Gross Domestic Product
         o $3.3 billion in Federal, State and Local Tax Revenues

n        It is critical to highlight that those jobs and industries positively impacted by
         the Rooftop Solar Power Industry are concentrated in the Knowledge-Based
         Services sectors such as High-Tech Manufacturing, Professional Business
         Services, Information Technology (IT) and others. These are higher wage jobs
         relative to the State average, and supportive of Florida’s Strategic Plan for Economic
         Development.

The direct employment figures within the economic impact tables do not necessarily equal the total full-time equivalent
∗

(FTEs). This is due to the IMPLAN input/output (I/O) methodology, which measures real (inflation-adjusted) economy-
wide impacts based on average wages of the industry and productivity within the given study area.

The Washington Economics Group, Inc. (WEG)                                                                      Page | 2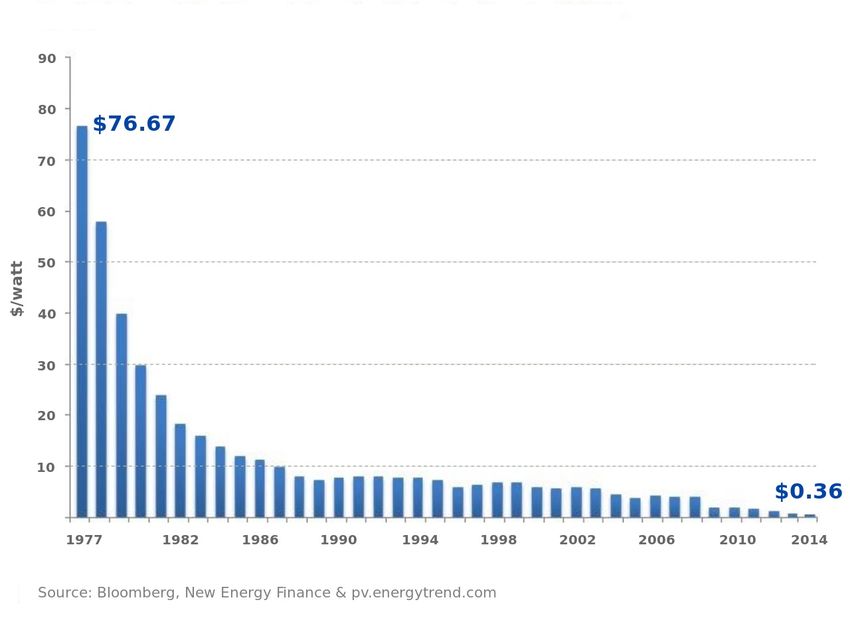
The Comprehensive Economic Development Impacts of the Rooftop Solar Power Industry
                                        on the State of Florida

II.    Supercharged: How the Sunshine State’s Rooftop Solar Power
       Industry Supports Florida’s Economic Development

The Rooftop Solar Industry in Florida is an important catalyst for the State’s sustainable
economic development. This qualitative assessment section of this Study by The
Washington Economics Group, Inc. (WEG) highlights the economic development benefits of
the Rooftop Solar Power Industry in Florida. WEG was retained by Conservatives for Clean
Energy to analyze both the quantitative and qualitative economic impacts of the Industry on
the State of Florida’s economy. While the following Section III will present the quantifiable
economic impacts of the Rooftop Solar Power Industry in the State, this section dives deep
into the multifaceted and growing qualitative benefits of the Rooftop Solar Industry’s
activities as a whole. These additional positive impacts, so called “externality benefits,” go
well beyond what can be quantified, and they address the growing significance of the Rooftop
Solar Industry’s impact on improving the standard of living of all residents through clean and
reliable energy for sustainable economic growth.

As Florida continues to grow and diversify its economy, it is imperative that the State
embrace and adopt renewable energy sources to meet burgeoning demand. The Rooftop
Solar Industry in Florida delivers on this need and supports high-wage, high-skilled
employment in doing so. As an innovative leader in renewable energy delivery, Rooftop Solar
Power is critical for sustainable economic growth as Floridians move into the third decade
of the 21st Century. Furthermore, the Rooftop Solar Power Industry in Florida plays a
foundational role in advancing the existing Florida Strategic Plan for Economic Development.
By aligning with the existing efforts and interests of stakeholders, policymakers and
community leaders in Florida, the economic impacts of the Rooftop Solar Power Industry
ripples beyond what can be quantified utilizing the professionally accepted Input/Output
(I/O) Methodology.

While technically humans have harnessed the energy and power of the sun for millennia, the
first photovoltaic (PV) cell was invented in 1954. In 1973, the University of Delaware was
responsible for creating the first “solar residence” providing energy to a building on campus
called Solar One with support from Delmarva Power and Light Co.

Since that time, the price of photovoltaic cells has plummeted with the phenomena being
dubbed “Swanson’s effect.” This effect means that costs of PV cells go down roughly 75
percent every 10 years, and the evidence is illustrated in Figure 1 on the next page.

The Washington Economics Group, Inc. (WEG)                                                      Page | 3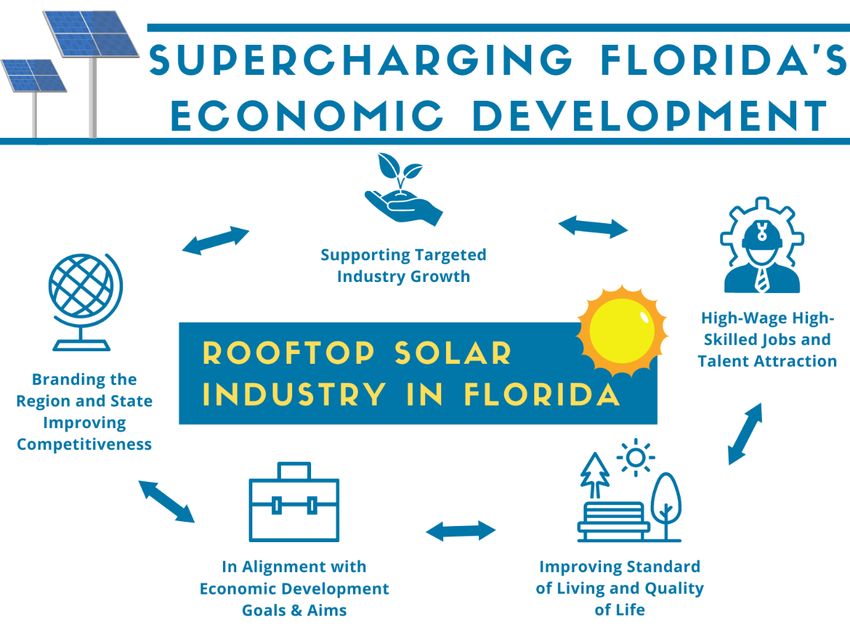
The Comprehensive Economic Development Impacts of the Rooftop Solar Power Industry
on the State of Florida
Figure 1.
The Swanson Effect
Price of crystalline silicon photovoltaic cells
Source: Bloomberg, New Energy Finance and pv.energytrend.com
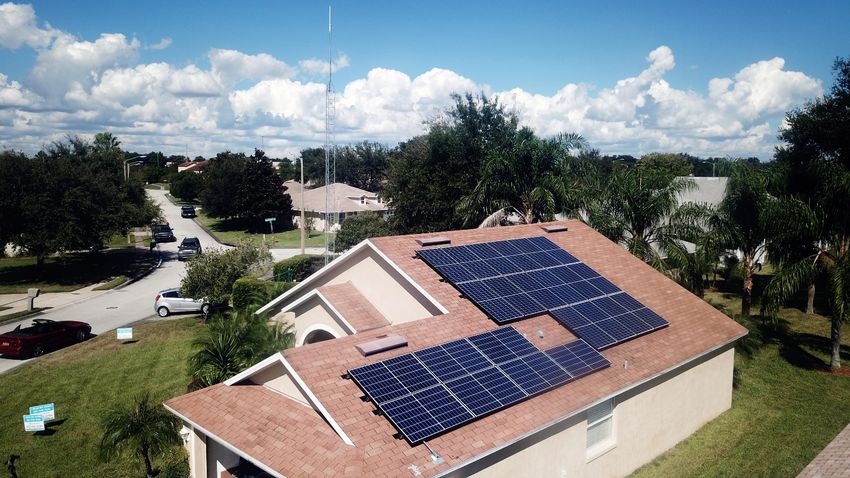
Florida, the Sunshine State, has a good opportunity for continued Rooftop Solar development
and growth. Already a mushrooming industry, the Florida Rooftop Solar Power Industry is
robust and growing. According to the Solar Energy Industries Association (SEIA), Florida is
ranked 4th for Solar Energy (dropping slightly from the 3rd spot in 2020). Here are some other
key facts for the State from SEIA:
v National Ranking: 4th (3rd in 2020)
v State Homes Powered by Solar: 780,5861
v Percentage of State’s Electricity from Solar: 3.03%
v Solar Businesses in Florida: 414 (66 Manufacturers, 209
Installers/Developers and 139 Others)
v Growth Projection: 12,042 MW over the next 5 Years (ranks 3rd most among
all US States)
1
Data comes from the utility scale solar farms and rooftop systems.
The Washington Economics Group, Inc. (WEG) Page | 4
The Comprehensive Economic Development Impacts of the Rooftop Solar Power Industry
                                            on the State of Florida

Florida’s 80,997 total solar installations has supported 8,907 jobs. While the Rooftop Solar
Power Industry is a fraction of the overall Solar economy in Florida, it is growing and will be
an important future contributor for sustained economic growth. (See Figure 2 below).

                                        Figure 2. Florida Annual Solar Installations

    Source: Solar Energy Industries Association (SEIA).

From an economic development perspective, the growing Rooftop Solar Power Industry of
Florida is significant because it supports high-wage, high-skilled employment. Solar
manufacturers, installers, wholesalers/traders, and technicians pay higher-than-average
wages. As Florida seeks to diversify away from an over concentration in the hospitality and
tourism industry, the Rooftop Solar Power Industry is a good place to focus the State’s efforts.
Already, policymakers and community leaders have taken notice and made the Rooftop Solar
Power Industry a priority for future economic development. From 2018 to 2019, there was
a 17.8 percent increase in job creation from the solar industry in Florida2. With growth in
the higher wage higher skilled labor pool of the State, Florida residents ultimately benefit by
improving the standard of living and quality of life.

           “Removing restrictions on leased solar systems has encouraged small-scale solar
           growth in Florida. In 2020, small-scale solar capacity in Florida grew 57 percent,
           increasing from 492 MW in 2019 to 773 MW.3”
                                                          Source: U.S. Energy Information Administration (EIA),

2The   Solar Foundation, State Solar Jobs Census: https://www.thesolarfoundation.org/solar-jobs-census/states/
3
    https://www.eia.gov/todayinenergy/detail.php?id=46996

The Washington Economics Group, Inc. (WEG)                                                                        Page | 5
The Comprehensive Economic Development Impacts of the Rooftop Solar Power Industry
                                           on the State of Florida

                                                       One such anecdotal example of how
                                                       the Rooftop Solar Power Industry
                                                       has a positive impact on Florida’s
                                                       economy can be seen in the story of
                                                       Steve Rutherford. Steve is a service-
                                                       disabled veteran who served 22
                                                       years in the Navy SEALs. After
                                                       serving in Iraq to bring freedom
                                                       abroad, Steve came home to Florida
                                                       and started a company to help his
                                                       neighbors achieve energy freedom.
                                                       For the past 9 years, Steve’s
company, Tampa Bay Solar, has employed 30 people across Central Florida, a third of whom
are veterans. Tampa Bay Solar is just one example of many across the Sunshine State. While
Florida has done well recently in growing its Rooftop Solar Power Industry footprint (such
as with Steve’s company Tampa Bay Solar), the State has opportunities for growth moving
forward.

According to the National Renewable Energy Laboratory (NREL), researchers foresee
Florida’s solar power is projected to meet up to 30 percent of Florida’s total electricity needs
over the next 10 years, depending on the prices of other electricity sources, such as natural
gas and other market conditions. Elaine Hale, the lead author of the Study, said that the
percentage could go even higher, depending on how and whether future State policymakers
calculate the climate costs of fossil-fueled energy4.

Upon Analyzing the Rooftop Solar Power Industry in Florida, it is important to see how well
the industry aligns its efforts with existing economic development efforts by policymakers
and community leaders. According to the Florida Foundation’s Six Pillars, the Rooftop Solar
Power Industry directly supports most of the important economic development strategies of
the State. These include:

•      Innovation and Economic Development
•      Infrastructure and Growth Leadership
•      Business Climate and Competitiveness
•      Quality of Life and Quality Places

4
    From 2018 https://www.osti.gov/biblio/1457670

The Washington Economics Group, Inc. (WEG)                                                         Page | 6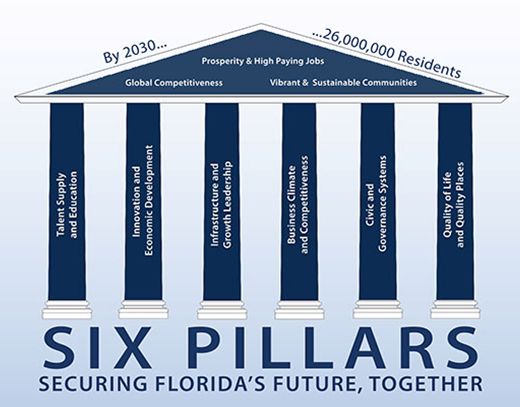
The Comprehensive Economic Development Impacts of the Rooftop Solar Power Industry
                                            on the State of Florida

The operational and growth-oriented activities of Florida’s Rooftop Solar Power Industry are
in direct alignment with Florida’s Strategic Plan for Economic Development. By supporting
Florida’s economic pillars, the Rooftop Solar Power Industry creates a synergistic effect
where economic development outcomes are affected more profoundly than they would be
had there not been supportive industries such as Rooftop Solar Power.

                Sources: Florida Chamber Foundation and Enterprise Florida, Inc.

According to Enterprise Florida, the State’s Economic Development Organization, Cleantech
is one of Florida’s most important and major industries. Rooftop Solar contributes
significantly to a robust and targeted Cleantech Industry in the State.

       “Floridians understand the undeniable link between sustainability and the economy and
       are harnessing innovation and the state’s strong entrepreneurial spirit to build one of
       the nation’s leading clean technology hubs. And whether your focus is ocean energy or
       green architecture, you’ll find an established industry presence across the cleantech
       spectrum in Florida.5”

The Rooftop Solar Power’s businesses are included in the over 11,750 Cleantech companies
established in the Sunshine State. According to the Cleantech Industry Profile, Solar Power
is an area of excellence for the State and is used in marketing materials to attract and retain

5
    https://www.enterpriseflorida.com/industries/cleantech/

The Washington Economics Group, Inc. (WEG)                                                          Page | 7
The Comprehensive Economic Development Impacts of the Rooftop Solar Power Industry
on the State of Florida
businesses and corporations from around the world6. For example, JinkoSolar Holding Co.,
Ltd. partnership with Next Era Energy. Based in Shanghai, Jinko partnered with Florida’s
utility company to supply them with “up to 2,750 megawatts of high-efficiency solar modules
— roughly 7 million solar panels — over approximately four years.” Jinko opened a
manufacturing facility in Jacksonville to make these panels thus creating jobs and furthering
Florida’s cleantech industry profile7.
Upon further assessment, it is important to analyze how the Rooftop Solar Power Industry
in Florida creates a virtuous cycle that further enhances sustainable economic growth and
expansion. This can be visualized in the Matrix below.
Clearly, Florida Rooftop Solar Power Industry is a targeted and supported industry. The
Industry’s commitment to excellence is used in branding materials to support the attraction
and retention of companies around the State. Further, the Industry employs high-wage and
high-skilled labor, a top priority for elected officials and policymakers from around Florida.
In alignment with these policy aims and goals, Rooftop Solar Power in Florida becomes then
6
https://www.enterpriseflorida.com/wp-content/uploads/cleantech-industry-profile.pdf
7
https://jinkosolar.us/press/nextera-energy-and-jinkosolar-announce-deal-for-millions-of-solar-panels-jinkosolar-to-
begin-manufacturing-solar-panels-in-florida/
The Washington Economics Group, Inc. (WEG) Page | 8The Comprehensive Economic Development Impacts of the Rooftop Solar Power Industry
on the State of Florida
an essential element in sustainable economic development for Florida for the present and
the future. It is therefore mission critical to continue to support the Industry as the Rooftop
Solar Power Industry then supports rising standards of living and higher quality of lives for
all residents in the Sunshine State.
In conclusion, the Rooftop Solar Power Industry’s importance for the continued sustained
growth and diversification of the Florida economy cannot be stressed enough. By supporting
the existing economic development efforts of the State and aligning its efforts with
policymakers and stakeholders, the Rooftop Solar Power Industry supports high-wage and
high-skilled jobs that directly contribute to increase the standard of living for Florida
residents. As the Industry continues to grow, Florida residents will benefit tremendously, far
more than can accurately be quantified and as found in the following Section of this Study.
The Washington Economics Group, Inc. (WEG) Page | 9The Comprehensive Economic Development Impacts of the Rooftop Solar Power Industry
on the State of Florida
III. The Annually Recurring Economic Impacts of the Rooftop Solar Power
Industry’s Ongoing Operations Contribute Significantly to the Economic
Well-Being of Florida
The ongoing operations of the Rooftop Solar Power Industry in Florida are significant and
growing, resulting in employment opportunities for local residents throughout the State. The
Industry’s activities increase the State’s Gross Domestic Product (GDP), leading to greater
economic productivity through economies of scale and agglomeration, and through
additional operating revenues of business establishments within Florida that provide this
Industry with a variety of goods and services.
The IMPLAN Group, LLC. (IMPLAN) developed the software and basic data needed to
formulate the economic multiplier model used for this Study. IMPLAN has been providing
economic multiplier models for regional economic impact analysis since 19858. Models
developed using IMPLAN software have been widely used by private-sector, academic
economists, and by Federal, State and Local government agencies to measure the impacts of
specific economic activities. All impacts are estimated on a recurring annual basis and
were based on Florida industry employment of 8,907 for 20199.
IMPLAN Methodology
Economic models that explicitly account for inter-industry linkages (supply relationships), the
generation of labor and capital income and the spending of household income have been used since
the 1960’s to estimate the contribution that a particular business or industry makes to the general
economy. These “input-output” models recognize that as an industry experiences an increase in the
demand for its products or services, it in turn needs more goods and services from its suppliers and
must increase its purchases from other industries in the economy. The effect on regional production
resulting from successive rounds of inter-industry linkages is referred to as the indirect effect. The
resulting increases in regional production also lead to expansions in employment and household
income, and the increases in labor income lead to increases in consumer spending, further expanding
sales and production throughout the regional economy. The latter economic impacts are referred to
as the induced effects. The successive waves of production, spending and more production result in
economic multiplier effects, where the final or total increase in regional production, income and
employment, respectively is larger than the initial (or “direct”) increase in production, income and
employment. The total quantitative economic contribution of these activities, therefore, is comprised
of a direct effect, an indirect effect and an induced effect.
8Information on the IMPLAN Group, LLC models and the company history can be found at www.implan.com.
9
The Solar Foundation 10th Annual National Solar Jobs Census 2019, February 2020 http://www.SolarJobsCensus.org
The Washington Economics Group, Inc. (WEG) Page | 10The Comprehensive Economic Development Impacts of the Rooftop Solar Power Industry
on the State of Florida
The following Section presents the summary of the economic impacts generated by the
ongoing operations of the Florida Rooftop Solar Power Industry in the Florida economy in
terms of Employment (Jobs), Household Income, Gross Domestic Product (GDP), Total
Economic Impact and Federal, State & Local Fiscal Revenues.
A. The Rooftop Solar Power Industry is an Important Contributor to Overall
Economic Growth and the Well-Being of Florida Residents
The Rooftop Solar Power Industry’s growing operations generate significant quantifiable
economic impacts throughout Florida. The Industry has a significant $18 billion impact on
Florida annually. This impact encompasses 40,462 jobs supported, over $3 billion in
Household Income, more than $10 billion contribution to State Gross Domestic Product
annually and over $3 billion in Federal, State and Local tax revenues generated each year.
These large impacts, summarized in Table 1 below, make the Rooftop Solar Power Industry
a top contributor to State economic activity and a major source of job opportunities
statewide.
Table 1. Summary of the Annual Economic Impacts Generated in Florida by the Ongoing
Operations of the Rooftop Solar Power Industry (by Impact Type)
Total
Impact on: Direct Indirect Induced
Impact
Employment (Jobs) ∗
8,907 15,774 15,781 40,462
Household Income ($ Million) $1,331 $1,114 $735 $3,179
GDP (Value Added - $ Million) $6,488 $2,746 $1,375 $10,609
Federal, State & Local Tax Revenues ($ Million) --- --- --- $3,257
Total Economic Impact ($ Million) $10,730 $5,166 $2,426 $18,322
Note: Total may not equal the sum of all due to rounding.
Source: The Washington Economics Group, Inc. (WEG)
The ongoing operations generate economic impacts that extend beyond those directly
related to the activities of the Rooftop Solar Power Industry throughout the State of Florida.
These “spillover” or multiplier impacts are the result of each business activity’s supply
relationships with other firms operating within the State economy, the proportion of
business value added10 that accrues to households in the form of labor and capital income
and the propensity of households to spend income on goods produced within the local area.
The direct employment figures within the economic impact tables do not necessarily equal the total full-time equivalent
∗
(FTEs). This is due to the IMPLAN input/output (I/O) methodology, which measures real (inflation-adjusted) economy-
wide impacts based on average wages of the industry and productivity within the given study area.
10“Valueadded” refers to the difference between business revenues and the cost of non-labor and non-capital inputs used
to produce goods and/or services.
The Washington Economics Group, Inc. (WEG) Page | 11The Comprehensive Economic Development Impacts of the Rooftop Solar Power Industry
on the State of Florida
The direct, indirect and induced economic impacts of the Florida Rooftop Solar Power
Industry were calculated using an extended input-output model of the Florida economy.
The following analysis presents the economic impacts on Employment (Jobs), Household
Income, Gross Domestic Product (GDP) and Total Economic Impact by specific industries, as
well as Fiscal Revenues generated from the operations of the Florida Solar Power Industry.
B. An Estimated 40,462 Jobs are Supported Throughout Florida by the Ongoing
Operations of the Rooftop Solar Power Industry
The operations of the Rooftop Solar Power Industry create 40,462 jobs in Florida. Just over
22 percent or 8,907 of the total employment supported are the direct jobs at firms in the
industry; and 31,555 jobs result
from indirect and induced
Therefore, the total number of jobs directly,
impacts as the Industry’s
indirectly and induced supported by the
operations and spending filter
operations of the Rooftop Solar Power Energy is through the State economy
estimated at 40,462 – making a significant (Table 1, page 11).
contribution to employment opportunities in the Approximately 44 percent or
State of Florida. over 17,970 occurs in the
Knowledge-Based Services
sector that requires workers with high productivity skills achieved through post-secondary
degrees and continuous training.
Table 2. Total Jobs Supported in Florida by the Ongoing Operations of the
Rooftop Solar Power Industry (by Industry Sector)
Industry Jobs Supported % of Total
Knowledge-Based Services ∗
17,970 44%
Government & Other 12,718 31%
Wholesale Trade & Transportation Services 3,653 9%
Visitor Industry 2,847 7%
Retail Trade 2,707 7%
Construction and Manufacturing 567 1%
Total: 40,462 100%
Notes: Total may not equal the sum of all due to rounding. See detailed table in Appendix III.
Source: The Washington Economics Group, Inc. (WEG)
∗
Major industries under this category such as High-Tech Manufacturing, Information Technology (IT), Finance and
Insurance, Real Estate, Professional, Administrative Services and Arts, Entertainment & Recreation have on average a higher
wage than the State average.
The Washington Economics Group, Inc. (WEG) Page | 12The Comprehensive Economic Development Impacts of the Rooftop Solar Power Industry
on the State of Florida
In addition, approximately 12,718 jobs, or 31 percent, are supported in the Government &
Other sector, 3,653, or 9 percent are in Wholesale Trade & Transportation Services. The
remaining jobs are created in the Visitor Industry and Retail Trade sectors with 7 percent
each, and 1 percent in the Construction and Manufacturing sectors combined as presented
in Table 2 on the previous page and in Figure 3 below.
Figure 3. Total Jobs Supported in Florida by the Ongoing
Operations of the Rooftop Solar Power Industry
Knowledge-Based Services
1%
7%
7% Government & Other
9% Wholesale Trade &
44% Transportation Services
Visitor Industry
Retail Trade
Construction and Manufacturing
31%
Source: The Washington Economics Group, Inc. (WEG)
C. The Rooftop Solar Power Industry Ongoing Operations Contribute
Substantially to the Standard of Living of Florida Residents
The Rooftop Solar Power Industry also contributes to the standard of living of Florida’s
residents by adding an estimated more than $3 billion in income to the State’s households. It
should be noted that this increase in income for Florida Households is solely attributable to
the employment impacts and does
In total, the jobs supported by the Rooftop not take into account any income
Solar Power Industry’s ongoing operations attributable to the electric power
generated by the rooftop solar
contribute to the standard of living of Florida
installations.
residents by adding an estimated $3 billion in
Household Income annually. The Rooftop Solar Power Industry is
directly responsible for the
generation of $1.3 billion, and the
indirect and induced impacts generate over $1.8 billion in Household Income in the State of
Florida every year. (Table 1, page 11.) As presented in Table 3 and Figure 4 on the next page,
The Washington Economics Group, Inc. (WEG) Page | 13The Comprehensive Economic Development Impacts of the Rooftop Solar Power Industry
on the State of Florida
workers in the Government & Other sector11 received $1.8 billion or 58 percent of the total
labor compensation while workers in the Knowledge-Based Services sector received
approximately $929 million or 29 percent of the total labor compensation paid as a result of
industry ongoing operations.
Table 3. Household Income Generated in Florida by the Ongoing Operations of
the Rooftop Solar Power Industry (by Industry Sector)
Total Impact
Industry % of Total
($ Million)
Government & Other $1,830 58%
Knowledge-Based Services ∗
$929 29%
Wholesale Trade & Transportation Services $224 7%
Retail Trade $91 3%
Visitor Industry $74 2%
Manufacturing and Construction $32 1%
Total: $3,180 100%
Note: Total may not equal the sum of all due to rounding. See detailed table in Appendix III.
Source: The Washington Economics Group, Inc. (WEG)
Figure 4. Household Income Generated in Florida by the Ongoing
Operations of the Rooftop Solar Power Industry
1% Government & Other
3% 2%
7%
Knowledge-Based
Services
Wholesale Trade &
Transportation Services
Retail Trade
58%
29%
Visitor Industry
Manufacturing and
Construction
Source: The Washington Economics Group, Inc. (WEG)
11According to IMPLAN, Government & Other is a large sector because electric utilities (including solar electric) aggregate
into this sector.
∗
Major industries under this category such as High-Tech Manufacturing, Information Technology (IT), Finance and
Insurance, Real Estate, Professional, Administrative Services and Arts, Entertainment & Recreation have on average a higher
wage than the State average.
The Washington Economics Group, Inc. (WEG) Page | 14The Comprehensive Economic Development Impacts of the Rooftop Solar Power Industry
on the State of Florida
This is followed by the Wholesale Trade & Transportation Services generating $224 million,
or 7 percent. The remaining 6 percent of Household Income is generated across all other
sectors of the State economy. Of this 6 percent, the Retail Trade sector comprises 3 percent,
or more than $90 million, and 2 percent is within the Visitor Industry sector and 1 percent
in the Manufacturing and Construction sectors.
D. Gross Domestic Product Impacts: The Rooftop Solar Power Industry’s Ongoing
Operations are Important to the Overall Economic Activity in Florida
Gross Domestic Product (Value Added) is the portion of business revenue that is available to
pay compensation to workers, capital income and indirect business taxes. It is also the
principal source of income to households and a key measure of the contribution to the
economy made by the activities of the Rooftop Solar Power Industry, resulting in a net
contribution to the State economy of over $10 billion each year as shown in Table 4 below.
Of this, over $6 billion is attributed to direct impacts, and more than $4 billion comes from
indirect and induced impacts (Table 1, page 11).
Table 4. GDP (Value-Added) Impacts Generated in Florida by the Ongoing
Operations of the Rooftop Solar Power Industry (by Industry Sector)
Total Impact
Industry % of Total
($ Million)
Government & Other $8,261 78%
Knowledge-Based Services ∗
$1,616 15%
Wholesale Trade & Transportation Services $404 4%
Retail Trade $152 1%
Visitor Industry $115 1%
Manufacturing and Construction $61 1%
Total: $10,609 100%
Note: Total may not equal the sum of all due to rounding. See detailed table in Appendix III.
Source: The Washington Economics Group, Inc. (WEG)
Of the total Florida GDP of more than $10 billion attributable to the Rooftop Solar Power
Industry each year, an important over $8 billion or 78 percent of GDP is generated in the
Government & Other sector12, followed by $1.6 billion or 15 percent in the Knowledge-Based
∗
Major industries under this category such as High-Tech Manufacturing, Information Technology (IT), Finance and
Insurance, Real Estate, Professional, Administrative Services and Arts, Entertainment & Recreation have on average a higher
wage than the State average.
12Ibid.
The Washington Economics Group, Inc. (WEG) Page | 15The Comprehensive Economic Development Impacts of the Rooftop Solar Power Industry
on the State of Florida
Services sector, $404 million or 4 percent in the Wholesale Trade & Transportation Services
sector and $152 million or 1 percent in Retail Trade sector. The remaining 2 percent is
generated in the Visitor Industry and in the combined Manufacturing and Construction
sectors. The percentage distribution in each industry sector is illustrated in Table 4 in the
previous page and in Figure 5 below.
Figure 5. GDP (Value-Added) Impacts Generated in Florida by the
Ongoing Operations of the Rooftop Solar Power Industry
1% 1% 1%
4%
Government & Other
15%
Knowledge-Based Services
Wholesale Trade &
Transportation Services
Retail Trade
Visitor Industry
78% Manufacturing and
Construction
Source: The Washington Economics Group, Inc. (WEG)
E. The Total Economic Impact Generated by the Florida Rooftop Solar Power
Industry is a Significant $18 Billion
Total Economic Impact measures the total production of an industry or business. In this case,
the Total Economic Impact measures the total amount of goods and services produced by
the Rooftop Solar Power Industry’s activities in Florida.
As in the other impact measures, a
The Total Economic Impact of the Florida significant portion of the Total
Rooftop Solar Power Industry is estimated Economic Impact occurs in the
at slightly over $18 billion annually, a Government & Other sector13
significant contribution to the State representing 77 percent or more
economy and jobs for residents. than $14 billion of the overall Total
Economic Impact. Sixteen (16),
percent, or close to $3 billion of the impact is generated within the Knowledge-Based
13
Ibid.
The Washington Economics Group, Inc. (WEG) Page | 16The Comprehensive Economic Development Impacts of the Rooftop Solar Power Industry
on the State of Florida
Services sector, and 4 percent is generated within the Wholesale Trade & Transportation
Services sector. The remaining 3 percent is distributed among the Retail Trade, Visitor
Industry and the Manufacturing and Construction sectors of Florida’s economy. This is
presented in Table 5 and in Figure 6 below.
Table 5. Total Economic Impact Generated in Florida by the Ongoing
Operations of the Rooftop Solar Power Industry (by Industry Sector)
Total Impact
Industry % of Total
($ Million)
Government & Other $14,079 77%
Knowledge-Based Services ∗
$2,901 16%
Wholesale Trade & Transportation Services $722 4%
Retail Trade $255 1%
Visitor Industry $203 1%
Manufacturing and Construction $163 1%
Total: $18,323 100%
Note: Total may not equal the sum of all due to rounding. See detailed table in Appendix III.
Source: The Washington Economics Group, Inc. (WEG)
Figure 6. Total Economic Impact Generated in Florida by the
Ongoing Operations of the Rooftop Solar Power Industry
1% 1%
4% 1%
Government & Other
16%
Knowledge-Based Services
Wholesale Trade &
Source: The Washington Economics Group, Inc. (WEG) Transportation Services
Retail Trade
Visitor Industry
77% Manufacturing and
Construction
Source: The Washington Economics Group, Inc. (WEG)
∗
Major industries under this category such as High-Tech Manufacturing, Information Technology (IT), Finance and
Insurance, Real Estate, Professional, Administrative Services and Arts, Entertainment & Recreation have on average a higher
wage than the State average.
The Washington Economics Group, Inc. (WEG) Page | 17The Comprehensive Economic Development Impacts of the Rooftop Solar Power Industry
on the State of Florida
F. The Florida Rooftop Solar Power Industry Generates Important Contributions
to Public Revenues Each Year
The Rooftop Solar Power Industry’s operations generate significant contributions to public-
sector revenues throughout the State of Florida each year, with close to $1 billion or 31
percent flowing to the Federal government and more than $2 billion or 69 percent allocated
to State and Local governments. In total, the Industry generates a total of over $3 billion in
Federal, State and Local government revenues annually as shown in Table 6 below.
Table 6. Fiscal Contributions Arising from the Ongoing Operations
of the Rooftop Solar Power Industry in Florida ($ Thousands)
Federal State and Local
Taxes and Fees Paid By: Total Taxes
Taxes* Taxes
Capital $329,054 $717 $329,771
Labor $19,829 $0 $19,829
Indirect Business Taxes $167,261 $2,216,772 $2,384,032
Households $356,473 $3,197 $359,670
Corporations $126,840 $37,099 $163,939
Total: $999,457 $2,257,785 $3,257,241
*IMPLAN does not take into account of any Federal Tax Credits for Rooftop Solar.
Total may not equal the sum of all due to rounding.
Source: The Washington Economics Group, Inc. (WEG)
In conclusion, the Rooftop Solar Power Industry not only generates significant qualitative
or externality benefits to the State, but also significant quantifiable economic development
impacts. These quantifiable impacts create employment opportunities for Florida residents
while adding to the standard of living as a source of Household Income and clean, reliable
energy generation.
The Washington Economics Group, Inc. (WEG) Page | 18The Comprehensive Economic Development Impacts of the Rooftop Solar Power Industry
on the State of Florida
Appendix I:
Methodology
The Washington Economics Group, Inc. (WEG) Page | 19The Comprehensive Economic Development Impacts of the Rooftop Solar Power Industry
on the State of Florida
IMPLAN Model
The multiplier impacts calculated by the IMPLAN model are based on input-output
methodology, which explicitly considers the inter-industry linkages that exist within an
economy. Each industry needs labor and inputs from other industries in order to produce
economic output. Whenever an industry experiences an increase in the demand for its
output, many other industries within that economy indirectly experience an increase in
demand as well because of these inter-industry linkages. This increase in demand that
results from the need for material inputs is called the indirect effects. In addition, an increase
in production within a region also leads to an increase in household income through the
hiring of workers, which in turn generates further demands for goods and services within
the region. Firms also need to expand their base of physical capital to meet higher levels of
demand, and this too stimulates regional economic growth. The latter effects are referred to
as induced effects. The inter-industry linkages and the induced effects on consumer and
capital spending lead to successive rounds of production, and this process results in an
increase in output that exceeds the initial change in demand, or a multiplier effect. Similarly,
the increase in household income will exceed the initial payroll increase encountered in the
industry that experienced the original increase in demand. The total change in employment
in the regional economy is a multiple of the direct change in employment.
The following represents the system of equations that comprise the regional economy in an
extended input-output model like IMPLAN:
The variables x1 to xk represent total production of output in each industry. The coefficients
aij represent the purchases from industry “i” that are needed to produce a dollar of output in
industry “j”. These are known as the direct requirement coefficients. The variable xh refers
The Washington Economics Group, Inc. (WEG) Page | 20The Comprehensive Economic Development Impacts of the Rooftop Solar Power Industry
on the State of Florida
to household income and the coefficients aih refer to the average amount of household
income spent on purchases from industry “i”, or the average propensities to consume. The
coefficients ahi are similar to the inter-industry purchases (aij’s), but they represent the
household income that is generated from each dollar of output produced in industry “i”.
Similarly the variable xI represents regional spending on capital goods, and the coefficients
aIj represents the spending on capital goods for each dollar of output produced in industry
“j”. The coefficients ajI represent the amount purchased from industry “j” for each dollar
spent on capital goods within the region. The variables fj represent the exogenous final
demand faced by each industry, respectively.
This system of equation reduces, using matrix notation, to the following solution for industry
output and household income:
X is the vector of industry outputs plus household income and F is a vector of exogenous final
demands. The “output multipliers” (i.e., the change in industry output and household income
that results from a change in final demand for the output of a particular industry) are given
in the columns of the (I-A)-1 matrix. The IMPLAN software calculates these multipliers for
counties, states and other sub-state regions. These multipliers can be used to provide a sense
of the economic importance of an industry or an economic activity in a given region. The
multipliers impacts for gross state product, labor and capital income and the government
revenue impacts are derived from the basic output multipliers given by (I-A)-1.
The IMPLAN model uses historical relationships between public-sector revenues and
regional economic output in order to estimate the public-sector revenue impact resulting
from the establishment of a new, or expansion of an existing economic activity.
The Washington Economics Group, Inc. (WEG) Page | 21The Comprehensive Economic Development Impacts of the Rooftop Solar Industry
on the State of Florida
Appendix II:
Economic Glossary
The Washington Economics Group, Inc. (WEG) Page | 22The Comprehensive Economic Development Impacts of the Rooftop Solar Industry
on the State of Florida
Definitions of Economic Terms Used in the Analysis
Employment Total of full-time or part-time jobs.
All forms of employment income, including Employee Compensation
Household (Labor) Income
(wages and benefits) and Proprietor Income.
The increased value of a product as a result of the economic inputs
(labor and capital) expended at a given stage. In the IMPLAN Model,
Gross Domestic Product (GDP) GDP is the sum of: Employee Compensation, Proprietor Income,
Other Property Type Income (Interest) and Indirect Business Taxes.
Economic Impact (Output) Total value of all transactions attributed to an activity.
The set of expenditures applied to the predictive model (i.e., I/O
multipliers) for impact analysis. It is a series (or single) of
production changes or expenditures made by producers/consumers
as a result of an activity or policy. These initial changes are
Direct Effects determined by an analyst to be a result of this activity or policy.
Applying these initial changes to the multipliers in an IMPLAN model
will then display how the region will respond, economically to these
initial changes.
The impact of local industries buying goods and services from other
local industries. The cycle of spending works its way backward
through the supply chain until all money leaks from the local
Indirect Effects
economy, either through imports or by payments to value added.
The impacts are calculated by applying Direct Effects to the Type I
Multipliers.
The response by an economy to an initial change (direct effect) that
occurs through re-spending of income received by a component of
value added. IMPLAN's default multiplier recognizes that labor
Induced Effects income (employee compensation and proprietor income
components of value added) is not a leakage to the regional
economy. This money is re-circulated through the household
spending patterns causing further local economic activity.
The Washington Economics Group, Inc. (WEG) Page | 23The Comprehensive Economic Development Impacts of the Rooftop Solar Industry
on the State of Florida
Appendix III:
Detailed Economic Impact Tables
The Washington Economics Group, Inc. (WEG) Page | 24The Comprehensive Economic Development Impacts of the Rooftop Solar Industry
on the State of Florida
Detailed Impact Tables
Within the main portion of the Study the economic impacts are presented at a summary level.
Direct, Indirect and Induced Impacts are aggregated into the Total Impact, and Industries are
summarized by function. The following Tables present detailed impacts at the two-digit
NAICS industry classification level.
The following industry sector summarizations are used in this Study:
Government & Other is the sum of: Agriculture & Forestry, Mining, Utilities, Company
Management and Government & Other.
Knowledge-Based Services is the sum of: Information (IT), Finance & Insurance, Real
Estate, Professional Business Services, Administrative, Educational Services, Health & Social
Services, Arts, Entertainment & Recreation and Other Services.
Wholesale Trade & Transportation Services is the sum of: Wholesale Trade and
Transportation & Warehousing.
The Accommodation and Food Services sector was renamed Visitor Industry.
The Rooftop Solar Power Industry Economic Impacts Tables
Table A-1. Total Jobs Supported in Florida by the Ongoing Operations of the Rooftop
Solar Power Industry .......................................................................................................26
Table A-2. Household Income Generated in Florida by the Ongoing Operations of the
Rooftop Solar Power Industry......................................................................................27
Table A-3. GDP (Value-Added) Impacts Generated in Florida by the Ongoing
Operations of the Rooftop Solar Power Industry ................................................28
Table A-4. Total Annual Economic Impact Generated In Florida by the Ongoing
Operations of the Rooftop Solar Power Industry ................................................29
The Washington Economics Group, Inc. (WEG) Page | 25The Comprehensive Economic Development Impacts of the Rooftop Solar Industry
on the State of Florida
Table A-1. Total Jobs Supported in Florida by the Ongoing Operations
of the Rooftop Solar Power Industry
Impacts
Industry
Direct Indirect Induced Total
Agriculture & Forestry 0 8 90 99
Mining 0 130 5 135
Utilities 8,907 1,731 33 10,672
Construction 0 183 117 300
Manufacturing 0 93 174 267
Wholesale Trade 0 310 375 684
Retail Trade 0 263 2,444 2,707
Transportation & Warehousing 0 2,167 803 2,969
Information 0 276 250 526
Finance & Insurance 0 700 1,336 2,036
Real Estate 0 894 905 1,799
Professional Services 0 2,245 777 3,022
Company Management 0 204 175 379
Administrative 0 4,032 980 5,011
Educational Services 0 19 367 386
Health & Social Services 0 0 2,972 2,972
Arts, Entertainment & Recreation 0 150 476 626
Accommodation & Food Services 0 794 2,053 2,847
Other Services 0 287 1,305 1,591
Government & Other 0 1,289 146 1,435
Total: 8,907 15,775 15,783 40,462
Note: Total may not equal the sum of all due to rounding.
Source: The Washington Economics Group, Inc. (WEG)
The Washington Economics Group, Inc. (WEG) Page | 26The Comprehensive Economic Development Impacts of the Rooftop Solar Industry
on the State of Florida
Table A-2. Household Income Generated in Florida by the Ongoing Operations
of the Rooftop Solar Power Industry ($ in Thousands)
Impacts
Industry
Direct Indirect Induced Total
Agriculture & Forestry $0 $291 $2,676 $2,967
Mining $0 $1,659 $90 $1,749
Utilities $1,330,607 $308,550 $5,504 $1,644,660
Construction $0 $9,853 $6,167 $16,020
Manufacturing $0 $6,241 $9,784 $16,025
Wholesale Trade $0 $27,769 $34,387 $62,157
Retail Trade $0 $8,650 $81,868 $90,518
Transportation & Warehousing $0 $134,643 $27,031 $161,675
Information $0 $27,988 $23,679 $51,667
Finance & Insurance $0 $51,719 $86,046 $137,765
Real Estate $0 $22,144 $21,636 $43,780
Professional Services $0 $169,323 $56,085 $225,408
Company Management $0 $21,919 $18,815 $40,735
Administrative $0 $154,729 $37,871 $192,599
Educational Services $0 $789 $14,922 $15,711
Health & Social Services $0 $7 $180,100 $180,107
Arts, Entertainment & Recreation $0 $4,317 $14,136 $18,453
Accommodation & Food Services $0 $21,534 $52,022 $73,556
Other Services $0 $13,712 $49,515 $63,227
Government & Other $0 $127,718 $12,651 $140,369
Total $1,330,607 $1,113,555 $734,985 $3,179,148
Note: Total may not equal the sum of all due to rounding.
Source: The Washington Economics Group, Inc. (WEG)
The Washington Economics Group, Inc. (WEG) Page | 27The Comprehensive Economic Development Impacts of the Rooftop Solar Industry
on the State of Florida
Table A-3. GDP (Value-Added) Impacts Generated in Florida by the Ongoing Operations
of the Rooftop Solar Power Industry ($ in Thousands)
Impacts
Industry
Direct Indirect Induced Total
Agriculture & Forestry $0 $446 $4,776 $5,221
Mining $0 $3,030 $279 $3,309
Utilities $6,488,398 $1,338,044 $23,119 $7,849,561
Construction $0 $18,695 $11,339 $30,034
Manufacturing $0 $12,225 $18,596 $30,821
Wholesale Trade $0 $112,115 $75,819 $187,934
Retail Trade $0 $16,905 $135,305 $152,210
Transportation & Warehousing $0 $176,424 $39,575 $215,999
Information $0 $60,873 $57,129 $118,003
Finance & Insurance $0 $70,119 $126,113 $196,232
Real Estate $0 $73,830 $331,929 $405,759
Professional Services $0 $239,925 $73,967 $313,892
Company Management $0 $25,437 $21,835 $47,272
Administrative $0 $204,909 $44,996 $249,905
Educational Services $0 $1,100 $17,379 $18,479
Health & Social Services $0 $9 $206,848 $206,857
Arts, Entertainment & Recreation $0 $6,357 $21,703 $28,060
Accommodation & Food Services $0 $32,963 $82,148 $115,111
Other Services $0 $18,029 $60,314 $78,342
Government & Other $0 $334,442 $21,561 $356,003
Total $6,488,398 $2,745,877 $1,374,730 $10,609,004
Note: Total may not equal the sum of all due to rounding.
Source: The Washington Economics Group, Inc. (WEG)
The Washington Economics Group, Inc. (WEG) Page | 28The Comprehensive Economic Development Impacts of the Rooftop Solar Industry
on the State of Florida
Table A-4. Total Economic Impact Generated in Florida by the Ongoing Operations
of the Rooftop Solar Power Industry ($ in Thousands)
Impacts
Industry
Direct Indirect Induced Total
Agriculture & Forestry $0 $716 $8,753 $9,469
Mining $0 $44,877 $1,806 $46,683
Utilities $10,729,771 $2,543,469 $43,806 $13,317,045
Construction $0 $40,276 $24,573 $64,849
Manufacturing $0 $38,033 $59,703 $97,735
Wholesale Trade $0 $152,337 $127,359 $279,696
Retail Trade $0 $29,358 $225,889 $255,247
Transportation & Warehousing $0 $360,091 $81,714 $441,805
Information $0 $141,413 $121,365 $262,779
Finance & Insurance $0 $173,052 $331,108 $504,160
Real Estate $0 $176,113 $477,785 $653,898
Professional Services $0 $401,720 $118,193 $519,913
Company Management $0 $43,996 $37,766 $81,762
Administrative $0 $339,282 $80,664 $419,946
Educational Services $0 $1,597 $25,175 $26,771
Health & Social Services $0 $14 $346,203 $346,217
Arts, Entertainment & Recreation $0 $10,378 $36,302 $46,680
Accommodation & Food Services $0 $55,235 $147,300 $202,535
Other Services $0 $27,948 $92,939 $120,887
Government & Other $0 $586,275 $37,975 $624,250
Total $10,729,771 $5,166,180 $2,426,378 $18,322,327
Note: Total may not equal the sum of all due to rounding.
Source: The Washington Economics Group, Inc. (WEG)
The Washington Economics Group, Inc. (WEG) Page | 29The Comprehensive Economic Development Impacts of the Rooftop Solar Industry
on the State of Florida
Appendix IV:
The Washington Economics Group, Inc.
Project Team and Qualifications
The Washington Economics Group, Inc. (WEG) Page | 30The Comprehensive Economic Development Impacts of the Rooftop Solar Industry
on the State of Florida
J. Antonio Villamil
Founder and Senior Advisor
Tony Villamil is a nationally recognized economist, with over thirty-five years of successful
career as a business economist, university educator and high-level policymaker for both federal
and state governments. Tony was selected in 2008 as the founding Dean of the School of Business
of St. Thomas University, serving successfully until December 31, 2013 at which time he resigned
to return as senior advisor to the growing economic consulting practice that he founded, The
Washington Economics Group, Inc. (WEG), a Florida-based firm established in 1993 upon
returning to the State from his public service in Washington, D.C.
Tony is the immediate past Chairman of the Governor’s Council of Economic Advisors of Florida,
and during 1999-2000, he was selected by Governor Bush as his first Director for Tourism, Trade
and Economic Development. Previously, he was appointed by President George H. W. Bush as
U.S. Undersecretary of Commerce for Economic Affairs, receiving unanimous U.S. Senate
confirmation. Presently he is active on Corporate Board of Directors, including Pan American Life
Insurance Group (PALIG) and Spanish Broadcasting System (SBS). At PALIG he serves as Chair
of the Governance and Nominating Committee of the Board. Tony is currently Chair of the Board
Compensation Committee at SBS. He recently completed a successful 18-year tenure at Amerant
Bank, N.A. and Amerant Holding Corp., serving as Chair of the Risk Committee and most recently
as Chair of the AML/BSA Committee. Amerant Bank, N.A. is the former Mercantil Bank, N.A. and
become a public company in 2020 during his active service on the Board.
Among civic and professional leadership positions, he is currently a member of the Board of
Directors of the Miami-Dade Beacon Council, the official economic development organization of
the county. He is also on the Board of Directors of the Greater Miami Chamber of Commerce. He
serves as Senior Fellow of the James Madison Institute (JMI) of Tallahassee, Florida.
He earned Bachelor and Master Degrees in Economics from Louisiana State University (LSU),
where he also completed coursework for the Ph.D. Degree. In 1991, Florida International
University (FIU) awarded him a Doctoral Degree in Economics (hc), for “distinguished
contributions to the Nation in the field of economics.” He frequently speaks to business,
government and university audiences on the Florida economy, U.S. trade policy and economic
development issues.
The Washington Economics Group, Inc. (WEG) Page | 31You can also read