T cell stiffness is enhanced upon formation of immunological synapse
←
→
Page content transcription
If your browser does not render page correctly, please read the page content below
SHORT REPORT
T cell stiffness is enhanced upon
formation of immunological synapse
Philipp Jung1†, Xiangda Zhou2†, Sandra Iden3, Markus Bischoff1, Bin Qu2,4*
1
Institute for Medical Microbiology and Hygiene, Saarland University, Homburg,
Germany; 2Department of Biophysics, Center for Integrative Physiology and
Molecular Medicine (CIPMM), School of Medicine, Saarland University, Homburg,
Germany; 3Cell and Developmental Biology, School of Medicine, Center of Human
and Molecular Biology (ZHMB), Saarland University, Homburg, Germany; 4Leibniz
Institute for New Materials, Saarbrücken, Germany
Abstract T cells are activated by target cells via an intimate contact, termed immunological
synapse (IS). Cellular mechanical properties, especially stiffness, are essential to regulate cell func-
tions. However, T cell stiffness at a subcellular level at the IS still remains largely elusive. In this work,
we established an atomic force microscopy (AFM)-based elasticity mapping method on whole T
cells to obtain an overview of the stiffness with a resolution of ~60 nm. Using primary human CD4+ T
cells, we show that when T cells form IS with stimulating antibody-coated surfaces, the lamellipodia
are stiffer than the cell body. Upon IS formation, T cell stiffness is enhanced both at the lamellipodia
and on the cell body. Chelation of intracellular Ca2+ abolishes IS-induced stiffening at the lamelli-
podia but has no influence on cell-body-stiffening, suggesting different regulatory mechanisms of
IS-induced stiffening at the lamellipodia and the cell body.
*For correspondence:
bin.qu@uks.eu
†
These authors contributed Introduction
equally to this work
T cells are activated by the engagement of T-cell receptors (TCRs) with the matching antigen on the
Competing interest: The authors target cells. Consequently, CD3 molecules, one key component of the TCR complex, transduce the
declare that no competing signal to activate downstream pathways leading to formation of a tight contact between T cells and
interests exist. target cells termed the immunological synapse (IS) (Bromley et al., 2001). During IS formation, the
Funding: See page 10 adhesion molecule LFA-1 (lymphocyte function-associated antigen 1) binds its ligand ICAM1 (Intercel-
lular Adhesion Molecule 1) on the target cells to seal and stabilize the IS (Bromley et al., 2001). Upon
Preprinted: 08 January 2021
T cell activation, intracellular Ca2+ concentration is drastically enhanced via Ca2+ influx. Ca2+ serves as
Received: 18 January 2021
Accepted: 26 July 2021 an essential second messenger in T cells to regulate their activation, proliferation, and effector func-
Published: 12 August 2021 tions (Trebak and Kinet, 2019). Artificial IS can be also induced between T cells and functionalized
surfaces (Chin et al., 2020; de la Zerda et al., 2018).
Reviewing Editor: Alphee
Recently, it has been revealed that mechanical properties play a significant role in modulation of T
Michelot, Institut de Biologie du
cell functions (Chin et al., 2020; Harrison et al., 2019; Rossy et al., 2018). Cytotoxic T cells optimize
Développement, France
their killing function via applying mechanical forces (Basu et al., 2016), where the mechanic output is
Copyright Jung et al. This coordinated with release of cytotoxic granules (Jin et al., 2019; Tamzalit et al., 2019). Force gener-
article is distributed under the
ation of T cells requires a sustained elevation of intracellular calcium and integrity of a functional
terms of the Creative Commons
F-actin network (Basu et al., 2016; Hui et al., 2015; Jin et al., 2019). Notably, even when the actin-
Attribution License, which
permits unrestricted use and cytoskeleton is perturbed, application of periodical mechanical forces linked to TCRs can still induce
redistribution provided that the Ca2+ influx (Basu et al., 2016). Furthermore, responsiveness of T cells to stimuli is elevated on stiffer
original author and source are substrates (40–50 kPa) relative to their softer counterparts (< 12 kPa) (Majedi et al., 2020; Zhang
credited. et al., 2020). Recent findings indicate that LFA-1 engagement plays an essential role in regulating T
Jung, Zhou, et al. eLife 2021;10:e66643. DOI: https://doi.org/10.7554/eLife.66643 1 of 13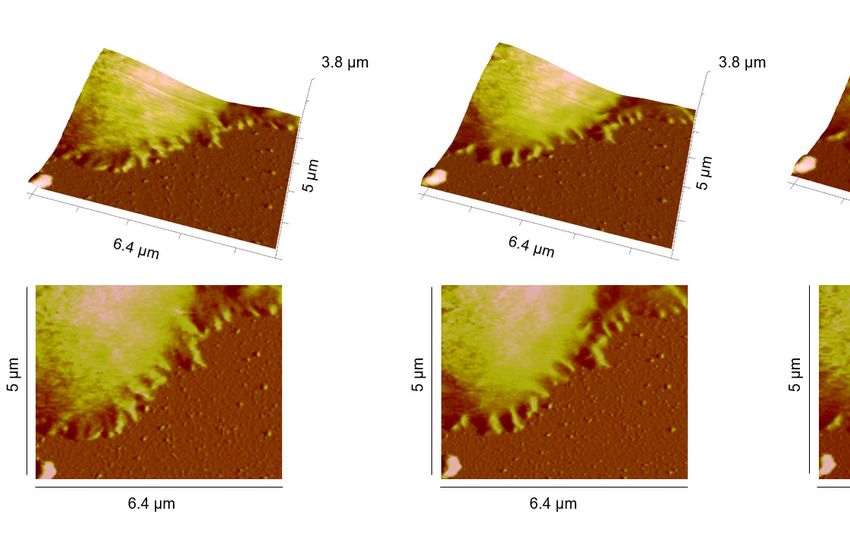
Short report Immunology and Inflammation | Physics of Living Systems
cell responsiveness to substrate stiffness (Wahl et al., 2019). However, how the stiffness of T cells per
se is regulated upon IS formation is still not well understood.
Various methodologies have been developed to investigate cell stiffness, for example micropipette
aspiration, microplate-based rheometry (Desprat et al., 2006; Hochmuth, 2000), high-throughput
real-time deformation cytometry (Fregin et al., 2019), optical tweezers (Feng et al., 2017; Killian
et al., 2018), and atomic force microscopy (AFM). The differences of these methods were discussed
elsewhere (Wu et al., 2018). AFM uses a mechanical probe (also called cantilever) to measure stiffness
at defined regions, which is also applicable on living cells. For this purpose, the cantilever is usually
brought into oscillation in close proximity to the cell surface to allow periodical contacts between the
cantilever and the surface. This setting enables the measurement of local interacting forces at each
point of a defined scanning grid, allowing the examination of height profiles, and to measure mechan-
ical properties with nanometer spatial and pN force resolution (Thewes et al., 2015). These features
enable a precise determination of local stiffness at the site of interest, which is pivotal for characteri-
zation of mechanic properties at the IS (de la Zerda et al., 2018).
In this work, we established an AFM-based method to simultaneously determine the surface profile
and stiffness of live T cells. Human CD4+ T cells were immobilized on glass coverslips via adhesion
molecule LFA-1 with or without CD3/CD28 activation. We found at the lamellipodia, the stiffness was
significantly higher than that at the cell body. Remarkably, upon formation of IS induced by CD3/
CD28 stimulation, T cells were substantially stiffened at the cell body as well as at the lamellipodia. By
chelating intracellular Ca2+ with EGTA-AM, we identified that Ca2+ is involved in regulation of this IS
formation-induced T cell stiffening at the lamellipodia but not at the cell body.
Results
T cells are stiffened upon IS formation
To examine the stiffness of T cells upon IS formation, we established a method to investigate living T
cells on functionalized coverslips by AFM based Peak Force Quantitative Nanoscale Mechanical Char-
acterization (Peak Force QNM) (Berquand et al., 2010). We first functionalized polyornithine-coated
coverslips with anti-LFA-1, anti-CD3 and anti-CD28 antibodies. CD28 is a co-stimulatory molecule,
essential for sustained T cell function (Esensten et al., 2016). Without anti-LFA-1 antibody T cells did
not attach to the surface, which is a prerequisite to determine cell stiffness by AFM. We first settled
Jurkat T cells, which present features of effector CD4+ T cells (Abraham and Weiss, 2004), on the
functionalized coverslip for 15 min. Subsequently, a quarter of each cell was investigated by Peak
Force QNM at a resolution of ~60 nm between measurements to create a high-density map of local
elastic moduli (Young’s moduli determined by Derjaguin-Muller-Toporov fit). We observed that after
making contact with antibody-coated coverslips, Jurkat T cells formed flattened spreading structures
(hereinafter referred to as lamellipodia), which dynamically changed over time (Figure 1A). Similar
dynamic changes were also observed with primary human CD4+ T cells with the same experimental
setting (Figure 1B). This morphology of lamellipodia detected by AFM resembles findings made by
scanning electron microscopy and immunostaining (Saitakis et al., 2017; Schoppmeyer et al., 2017).
In addition, complete height profiles were obtained, showing that T cells were flattened on the func-
tionalized surface (Figure 1C), suggesting a functional artificial IS was formed as observed in previous
studies (Pattu et al., 2011; Qu et al., 2011). To simplify, the artificial IS formed between T cells and
functionalized surface is referred to as IS in this work.
Next, we compared the stiffness of primary human CD4+ T cells settled either on anti-CD3/anti-
CD28/anti-LFA-1 antibodies (hereinafter referred to as full antibody set)-coated surfaces or on control
surfaces (anti-LFA-1 antibody-coated). The latter condition induces only T cell attachment to the
surface. Our results show that on the full antibody set-decorated surfaces, primary human CD4+ T cells
exhibited a significantly enhanced stiffness at both the lamellipodial regions and the cell body relative
to their counterparts on control surfaces (Figure 2A and B), with a fold change of 2,5-fold and twofold
(Figure 2C and D), respectively. The stiffness of the lamellipodia of primary human CD4+ T cells was
on average also higher than that of the cell body (Figure 2E and F), although this difference was not
statistically significant under full-antibody condition (Figure 2E). Taken together, our findings show
that T cells are stiffened upon IS formation, where stiffness of lamellipodia is higher than the cell body.
Jung, Zhou, et al. eLife 2021;10:e66643. DOI: https://doi.org/10.7554/eLife.66643 2 of 13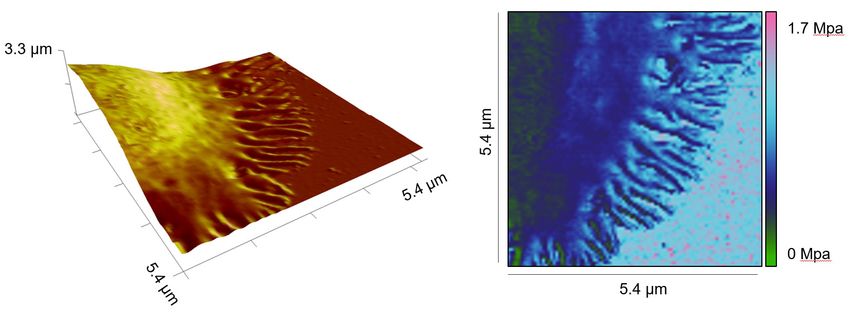
Short report Immunology and Inflammation | Physics of Living Systems
A Jurkat T cell
17 17 17
.5 .5 .5
µm µm µm
µm µm µm
9 9 9
B
20 min 27 min 34 min Primary T cell
C
µm
15
9.1
µm
Primary T cell
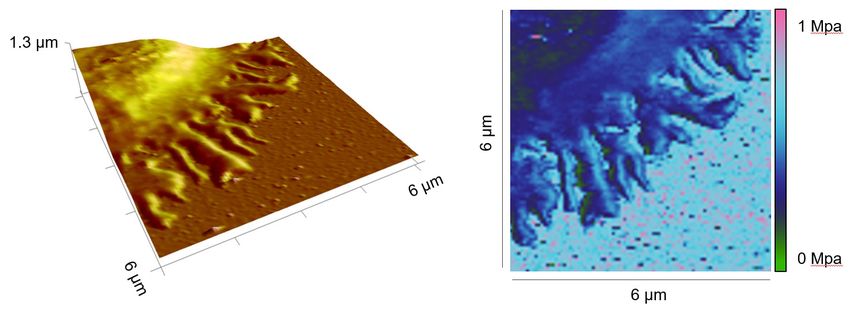
Figure 1. Representative time points of lamellipodial dynamics at the IS. (A, B) Dynamic changes of the
lamellipodium of a Jurkat T cell (A) or a human primary CD4+ T cell (B) during IS formation on a αLFA-
1+αCD3+αCD28 antibody-coated coverslip. The height profile, examined by Peak Force QNM, is displayed (upper
panel: 3D view, lower panel: top view). Exemplary dynamic parts are highlighted by arrowheads. (C) Height profile
of a whole primary human CD4+ T cell during IS formation on a αLFA-1+αCD3+αCD28 antibody-coated coverslip.
One representative cell from at least three independent experiments is shown.
We next analyzed whether the local stiffness at the lamellipodium was correlated with positioning
or topology of the microstructure. To this end, we selected individual spots on the lamellipodial
regions, especially at tips/edges, close to the cell body, and in between (Figure 2—figure supple-
ment 1). Here, we observed very similar Young’s moduli for these regions from the same cell, with
(αLFA-1+αCD3+αCD28) or without (αLFA-1) the IS (Figure 2—figure supplement 1). This finding
Jung, Zhou, et al. eLife 2021;10:e66643. DOI: https://doi.org/10.7554/eLife.66643 3 of 13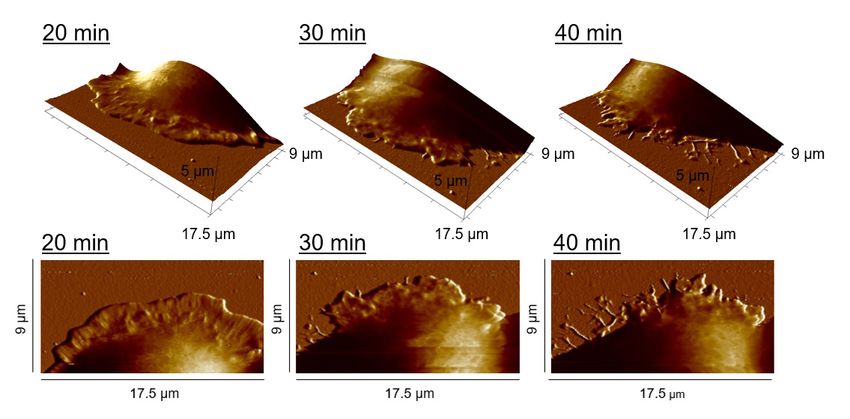
Short report                                                                        Immunology and Inflammation | Physics of Living Systems

  A          Height profile
                                                    αLFA-1
                                                              Elasticity mapping            C                              Cell body       D                             Lamellipodium
                                                                                                              600               p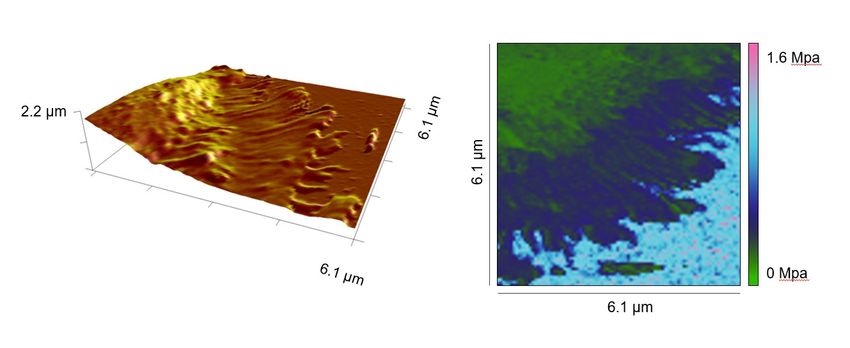
Short report Immunology and Inflammation | Physics of Living Systems
Figure 2 continued
figure supplements 3–6. For representative Force-Distance Curves, refer to Figure 2—figure supplement 7.
The online version of this article includes the following source data and figure supplement(s) for figure 2:
Source data 1. Original values of stiffness shown in Figure 2.
Figure supplement 1. Local stiffness at lamellipodia is not influenced by positioning or topology.
Figure supplement 1—source data 1. Stiffness of T cells measured on funcationalized surfaces.
Figure supplement 2. Stiffness of substrates.
Figure supplement 2—source data 1. Source data of stiffness of uncoated and coated substrates.
Figure supplement 3. Height profiles and elasticity maps (Young's modulus) of primary T-cells on αLAF-1-functionalized glass.
Figure supplement 4. Height profiles and elasticity maps (Young`s modulus) of primary T-cells on full antibody (αLFA-1+αCD3+αCD28)-functionalized
glass.
Figure supplement 5. Height profiles and elasticity maps (Young`s modulus) of primary T-cells on full antibody (αLFA-1+αCD3+αCD28)-functionalized
PDMS substrate with 2.5 MPa.
Figure supplement 6. Height profiles and elasticity maps (Young`s modulus) of primary T-cells on full antibody (αLFA-1+αCD3+αCD28)-functionalized
PDMS substrate with 400 kPa.
Figure supplement 7. Exemplary Force-Distance Curves during Elasticity mapping of primary T cells on full antibody (αLFA-1+αCD3+αCD28)-
functionalized glass.
indicates that the elasticity within the lamellipodia is rather a universal property, which is not affected
by the topology or the position of the microstructures with an area of a few hundred nm2. Notably,
cytoskeleton serves as scaffolds at the protrusions such as actin filaments or microtubules. The diame-
ters of these filamentous structures (~ 5–25 nm) is, however, far below the resolution (~ 60 nm) of our
experimental setting. Thus, we cannot exclude the possibility that along these cytoskeletal filaments
the elasticity may differ from the neighboring structures.
We further examined whether the stiffness of lamellipodia measured by this method could be influ-
enced by stiffness of the substrate rigidity. In order to address this, we first used Polydimethylsiloxane
(PDMS) substrates with a stiffness of 2.5 MPa. The stiffness of the lamellipodia of primary T cells was
characterized on a full body-functionalized PDMS surface using the same settings as for glass covers-
lips (Figure 2G). No significant difference in stiffness was observed between glass and PDMS surface
for the cell body (Figure 2H) or at the lamellipodium (Figure 2I). On the PDMS surface, stiffness of
lamellipodia was significantly higher than that of cell body and the fold change was very similar to that
on glass coverslips (compare Figure 2J with Figure 2E). Next, we used even softer PDMS substrates
with an elasticity of ~400 kPa, on which the IS could be formed and lamellipodial regions could be
analyzed (Figure 2K). Notably, no significant changes were identified in the Young's moduli of the
lamellipodia of T cells formed on the full antibody-functionalized softer PDMS substrates (400 kPa;
Figure 2K), compared to the ones measured on full antibody-functionalized glass or stiffer PDMS
substrates (2.5 MPa) (Figure 2L). These findings indicate that the Young’s moduli determined for the
lamellipodial regions in the range of hundreds of kPa were not markedly influenced by the stiffness
of the substrates used. In addition, to further reduce the risk of a potential influence of the backing
material stiffness on our measurements, we applied a peak force threshold of 700 pN during elasticity
mapping, which caused an indentation of 21 ± 2.2 nm into the cell body and 17 ± 4.7 nm into the
lamellipodia, respectively. Since the lamellipodia displayed a mean height of 144 ± 69.7 nm we can
largely exclude an impact of the substrates on the Young’s moduli examined for the lamellipodia.
During our analyses, we noticed that the stiffness on cell-free functionalized glass coverslips was
in a range of several hundred kPa to several MPa, which is much lower than the expected stiffness of
glass (which lies in the range of GPa). To elucidate the reason for this, we first examined the stiffness
of uncoated glass coverslips. Since the expected Young’s moduli are in the range of GPa, we used a
stiffer cantilever with a spring constant of 0.8 N/m and experimental settings suitable to characterize
hard substrates (For further details please see Materials and methods). Young’s moduli of uncoated
glass coverslips were around 1 GPa (Figure 2—figure supplement 2A), verifying that with these
experimental conditions our system is able to detect the stiffness in the GPa range. Next, we deter-
mined the Young’s moduli of uncoated substrates with a soft cantilever and the experimental settings
applied to characterize the stiffness of T cells. The average Young’s moduli of uncoated glass coverslips
Jung, Zhou, et al. eLife 2021;10:e66643. DOI: https://doi.org/10.7554/eLife.66643 5 of 13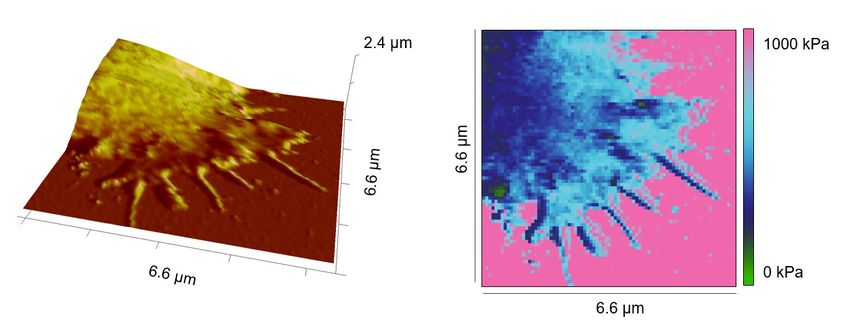
Short report Immunology and Inflammation | Physics of Living Systems
were around 18 MPa with the highest values around 20 MPa (Figure 2—figure supplement 2B),
which is clearly below the stiffness values determined with the stiffer cantilever and suggestively the
upper limit of the Young’s moduli that can be determined by these experimental conditions optimized
for determination of T cell stiffness. Nevertheless, the Young’s moduli of uncoated PDMS substrates
(2.5 MPa and 400 kPa) were in the expected range, indicating that up to 2.5 MPa the stiffness can be
precisely determined by the corresponding experimental conditions. Next, we analyzed the substrate
rigidity for each value of our existing datasets from Figure 2. We found that the functionalization
of stiffer substrates (i.e. glass and 2.5 MPa PDMS) with αLFA-1 or αLFA-1+αCD3+αCD28 created
surfaces with drastically reduced Young’s moduli of around 600–700 kPa (Figure 2—figure supple-
ment 2B), while the stiffness of the αLFA-1+αCD3+αCD28 functionalized softer PDMS (~400 kPa) was
comparable to the uncoated PDMS (400 kPa) (Figure 2—figure supplement 2B). This indicates that
antibody-functionalization substantially decreases the apparent stiffness of the cantilever-accessible
upmost surface layer of stiff substrates.
T cell stiffening is regulated by calcium
We next sought for the underlying mechanism regulating T cell stiffening triggered by TCR-activation.
Since the cytoskeleton plays an important role in maintaining cell stiffness (Gavara and Chadwick,
A Height profile
DMSO
Elasticity mapping C Cell body D Lamellipodium
p = 0.735 p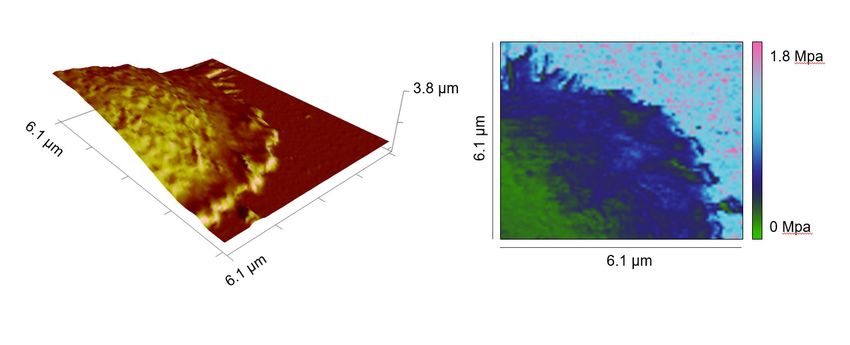
Short report Immunology and Inflammation | Physics of Living Systems
2016), we first targeted the actin-cytoskeleton with latrunculin-A (actin polymerization inhibitor) as
well as the microtubule-network with nocodazole (a microtubule depolymerizing agent). Not surpris-
ingly, with the disassembly of the cytoskeleton, T cells failed to attach to the functionalized surface
firmly enough for AFM measurements. Next, we turned our focus to Ca2+. We chelated intracellular
Ca2+ with EGTA-AM (dissolved in DMSO) and found that the lamellipodia formed by Ca2+-chelated
CD4+ T cells exhibited a substantially lower stiffness compared to their vehicle (DMSO)-treated coun-
terparts (Figure 3A–D). Notably, the stiffness of the cell body was not affected by Ca2+ chelation
(Figure 3C). In both DMSO and EGTA-treated conditions, the stiffness of lammellipodia was higher
than that of the cell body (Figure 3E and F). These results indicate that Ca2+ is involved in regulating
stiffening of the lamellipodia but not of the cell body upon IS formation.
Discussion
It has previously been reported that when extracellular Ca2+ is chelated by EGTA, TCR activation
can still induce a transient and moderate elevation of intracellular Ca2+, which is sufficient to initiate
some downstream events including actin polymerization and actin-dependent spreading (Babich
and Burkhardt, 2013). However, such a transient and moderate elevation of intracellular Ca2+ would
substantially inhibit the release of cytotoxic granules as shown in very low extracellular Ca2+ condition
(3 µM) (Zhou et al., 2018). Therefore, our observation that chelation of intracellular Ca2+ reduced
the stiffness only at the lamellipodia but not the cell body suggests that sustained or higher levels of
intracellular Ca2+ might be required to stiffen lamellipodia, and the stiffened lamellipodia could be
important for vesicle fusion at the IS. We postulate that local rearrangement of cytoskeleton might
contribute to a large extent to this Ca2+ dependent stiffening at lamellipodia induced by IS formation.
On one hand, integrity of actin-cytoskeleton is essential in T cells to generate mechanical forces at
the IS (Basu et al., 2016; Fritzsche et al., 2017). On the other hand, fast growth of microtubules in
CD4+ T cells at the contact site between anti-CD3 antibody-coated coverslip is observed, and the
traction stresses at the IS generated by actomyosin contractility is increased after disassembly of the
microtubule-network (Hui and Upadhyaya, 2017). In addition, cytoskeleton-regulatory proteins such
as ROCK and cofilin might be involved in this Ca2+ dependent local stiffening (Butte et al., 2014;
Thauland et al., 2017).
In our work, the range of the determined Young’s moduli is considerably higher than some of the
previously reported ones, which were in a range of tens to hundreds of Pa (Butcher et al., 2009).
However, it is important to note that the studies discussed in the aforementioned review used nanoin-
dentation experiments to determine the Young’s moduli. Compelling evidence in recent years shows
that AFM experiments are influenced by a multitude of parameters, such as the subsurface material,
the choice of the cantilever, the contact model applied, environmental conditions, and the measure-
ment mode. In our work, the Peak Force QNM mode, also known as Peak Force Tapping mode, was
applied, which has the advantage to dynamically modulate the z piezo below the cantilever resonance
frequency, allowing detailed mapping of cells in a reduced amount of time. Unfortunately, the direct
comparability of Young’s moduli obtained with this method to elasticity data obtained with classical
nanoindentation methods, which reported Young’s moduli in the Pa range, seems to be mostly lost.
However, the Young’s moduli reported here for T cells are in good agreement to other elasticity data
published for different human cell types with the Peak Force QNM mode. For instance, a work inves-
tigated the glyphosate induced stiffening of human keratinocytes (HaCaT) by applying the Peak Force
QNM mode. Here, Young’s moduli of approximately 50–300 kPa in HaCaT were determined (Heu
et al., 2012). Another study utilized the Peak Force QNM mode to address the role of cholesterol
assemblies on the mechanical behavior of mammalian breast cancer cells (MCF10), and observed
Young’s moduli of approximately 5–44 kPa (Dumitru et al., 2020). Calzado-Martin et al. studied the
effect of actin organization on the stiffness of breast cancer cells lines by Peak Force QNM mode,
which revealed Young's moduli of approximately 50–150 kPa (Calzado-Martín et al., 2016). Interest-
ingly, the reduction of the Peak Force QNM modulation frequency from 250 Hz to 1 Hz resulted in a
tremendous decrease in the absolute values of Young’s moduli of more than 2 orders of magnitude,
which further emphasizes the impact of varying measurement parameters during elasticity mapping
(Calzado-Martín et al., 2016). A recent review by Li et al., 2021 emphasizes the technical improve-
ments and advantages of the Peak Force QNM mode and specifically recommends this AFM mode
for immunological applications.
Jung, Zhou, et al. eLife 2021;10:e66643. DOI: https://doi.org/10.7554/eLife.66643 7 of 13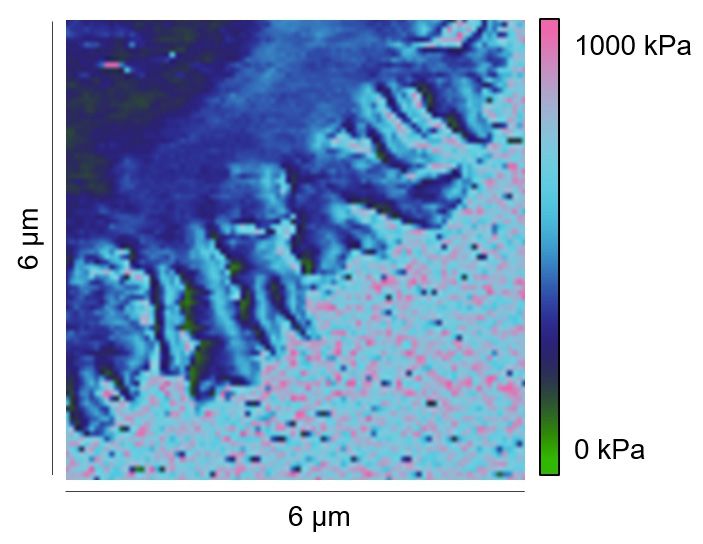
Short report Immunology and Inflammation | Physics of Living Systems
Previous approaches to study the stiffness of T cells utilized among others microplate and micro-
manipulation techniques, and reported Young’s moduli of around 100 Pa (Bufi et al., 2015) and
50 kPa (Du et al., 2017), respectively. For the microplate approach, the contact area between the
flexible microplate and the T-cell is considerably large, close to the diameter of the whole cell. Earlier
AFM approaches carried out to determine the stiffness of immune cells utilized a glass or silicon
sphere (diameter around 1–5 µm) attached to the cantilever to measure cell stiffness, and reported
Young’s moduli in the range of a few hundred Pa (Sadoun et al., 2021) to several thousand Pa
(Blumenthal et al., 2020). In contrast, we used cantilevers with a pyramidal, rounded tip (diameter: ~
60 nm). Considering that microbead pillows are very soft but microbeads per se are stiff, cell stiffness
measured from a larger scale could differ from its local microscale stiffness. Of note, the methods used
to measure cell stiffness in a larger scale is not suitable to determine stiffness of lamellipodial regions.
When scanning the vicinities of the attached T cells, we noticed that some points on glass covers-
lips were particularly soft (around 100–400 kPa). Thus, we carefully compared the elasticity mapping
and the height profiles, and found that most soft points from the elasticity mapping overlap with small
‘bumps’ in the height profiles, which seem to be connected to the lamellipodia with thin fibers (e.g.
Figure 2A and B). These small bumps might be cell debris left on the surface after retraction of lamel-
lipodia as shown in lamellipodial dynamics in Figure 1A (compare 40 min to 20 min).
Materials and methods
Key resources table
Reagent type
(species) or Additional
resource Designation Source or reference Identifiers information
Cell line (Homo ATCC Cat# TIB-152,
sapiens) Jurkat E6.1 cell line ATCC RRID:CVCL_0367
Negatively
Human peripheral blood mononuclear cells (PBMCs) isolated from
were obtained from healthy donors provided by PBMCs using
Institute of Clinical Hemostaseology and Transfusion CD4+ T Cell
Biological sample Medicine. Faculty of Medicine. University of Saarland. Isolation Kit
(Homo sapiens) Primary human CD4+ T cells PMID:24599783 human (Miltenyl).
Commercial assay
or kit CD4+ T Cell Isolation Kit human Miltenyi Cat# 130-096-533
Commercial assay Material Number
or kit Sylgard 184 Silicone Elastomer Kit Dow Europe GmbH 1317318
Peptide,
recombinant Sigma-Aldrich MDL number
protein Polyornithine (Merck) MFCD00286305
Chemical
compound, drug EGTA/AM Calbiochem (Merck) Cat# 324,628
anti-LFA-1 (ITGAL) antibody Cat# ABIN135680, Diluted to 9 µg/ml
Antibody (Mouse monoclonal) Antibodies-online RRID:AB_10773722 in 20 μl PBS
mouse anti-human CD28 antibody Cat# 555725, Diluted to 90 µg/
Antibody (Mouse monoclonal) BD Pharmingen RRID:AB_396068 ml in 20 μl PBS
mouse anti-human CD3 antibody Cat# 854.010.000, Diluted to 30 µg/
Antibody (Mouse monoclonal) Diaclone RRID:AB_1155287 ml in 20 μl PBS
Software,
algorithm GraphPad Prism GraphPad RRID:SCR_002798
Software,
algorithm Research NanoScope 9.1 Bruker Corp. R3.119071
Software, NanoScope Analysis 1.80 Bruker Corp. R2.132257
algorithm
Jung, Zhou, et al. eLife 2021;10:e66643. DOI: https://doi.org/10.7554/eLife.66643 8 of 13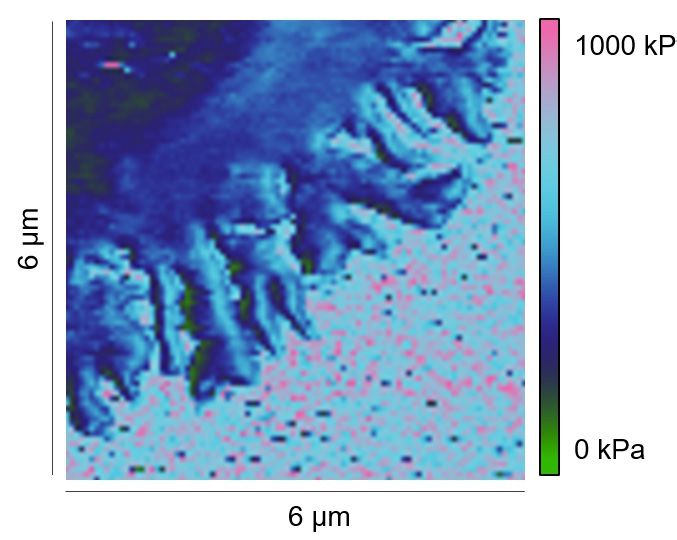
Short report Immunology and Inflammation | Physics of Living Systems
Antibodies and reagents
All chemicals not specifically mentioned are from Sigma-Aldrich (highest grade). The following anti-
bodies or reagents were used: anti-LFA-1 (ITGAL) antibody (Antibodies-online), mouse anti-human
CD28 antibody (BD Pharmingen), and mouse anti-human CD3 antibody (Diaclone).
Cell lines
The Jurkat T-cell line (E6.1) was purchased from ATCC. We confirm that no mycoplasma contamination
is detected by regular examinations.
Cell culture
Human peripheral blood mononuclear cells (PBMCs) were obtained from healthy donors as described
before (Kummerow et al., 2014). Primary human CD4+ T cells were negatively isolated from the
PBMCs using CD4+ T Cell Isolation Kit human (Miltenyl) and cultured in AIM V medium (ThermoFisher
Scientific) with 10 % FCS (ThermoFisher Scientific). Jurkat T-cells were cultured in RPMI-1640 medium
(ThermoFisher Scientific) with 10 % FCS. All cells were cultured at 37 °C with 5 % CO2.
Preparation of antibody-functionalized surface
The glass coverslips or PDMS (2.5 MPa) were first coated with Polyornithine at room temperature for
1 hour. The concentrations of anti-LFA-1/anti-CD3/anti-CD28 antibodies are: 9 µg/ml, 30 µg/ml, and
90 µg/ml, respectively. The antibodies as indicated were coated either at 37 °C for 30 min or at 4 °C
overnight.
AFM-based elasticity mapping in combination with light microscopy
Microscopic observation during elasticity mapping was carried out on a DMI 4000 B inverted micro-
scope (Leica) with a 200-fold magnification. Cells were first settled on coverslips at 37 °C with 5 %
CO2 for 15 min (Berquand et al., 2010). Prior to each experiment, the AFM cantilever (MLCT canti-
lever B, Bruker) was calibrated using the thermal tune method (Li et al., 2020). The spring constant
given by manufacturer is 0.02 N/m (min 0.005, max 0.04 N/m), and the calibrated spring constant is
0.06–0.1 N/m, which varies slightly in different cantilevers. Elasticity mapping using a Bioscope Cata-
lyst (Bruker) in Peak Force Quantitative Nanoscale Mechanical Characterization mode (Peak Force
QNM) (Berquand et al., 2010) was conducted in cell culture media and carried out with the following
parameters: line scan rate: 0.25 Hz, feedback gain: 0.5, peak force amplitude: 100 nm, peak force
threshold: 700 pN and a resolution of ~60 nm. Young’s moduli were obtained by a Derjaguin-Muller-
Toporov (DMT) fit (Derjaguin et al., 1975) of the retract part of each single force/distance curve. Elas-
ticity maps (square-shaped with side length of 5–10 µm) spanning approximately a quarter of the cell,
including lamellipodium and cell body, were recorded. Elastic moduli of the T-cells were determined
as square shaped surface segments located on the cell bodies and lamellipodia. For lamellipodia,
three individual square-shaped surface segments of 500 × 500 nm were analyzed per cell. If very
slender filopodia structures with a lateral width of less than 500 nm were seen, the analyzed segment
size was reduced to 250 × 250 nm. To determine the elastic moduli of the cell bodies, one 1.5 ×
1.5 µm surface segment of the peripheral region was investigated per cell. Approximately 29,600
individual elasticity values were analyzed on a total of 58 primary T lymphocytes. Representative
force curves and elasticity maps for each condition are provided in figure supplements. The stiffness
of uncoated glass coverslips was determined in air using the cantilevers (ScanAsyst Air, Bruker) with a
spring constant of 0.8 N/m and the following parameters: line scan rate: 0.5 Hz, feedback gain: 1.5,
peak force amplitude: 100 nm, peak force threshold: 6 nN and a resolution of ~2 nm.
Elastomer production
Polydimethylsiloxane (PDMS) elastomers with an AFM-validated stiffness of 2.5 MPa were produced
by crosslinking the base component (A) methylhydrosiloxane-dimethylsolioxane with the crosslinking
reagent vinyl-terminated polymethylsiloxane (Component B; both Sylgard 184 Silicone Elastomer Kit,
Dow Europe GmbH). An electrostatic deionizer (Eltex-Elektrostatik GmbH) was used to remove static
charges from the materials prior to use with PDMS. Component A and B were mixed at a 10:1 ratio
in polypropylene tubes, mixed vigorously, and de-gassed by centrifugation. The PDMS mixture was
Jung, Zhou, et al. eLife 2021;10:e66643. DOI: https://doi.org/10.7554/eLife.66643 9 of 13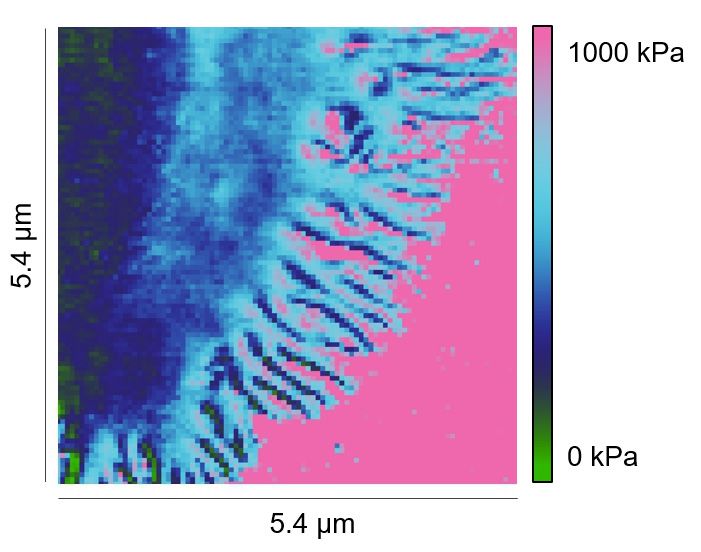
Short report Immunology and Inflammation | Physics of Living Systems
poured into the lid of 50 mm cell culture dishes, left for 1 hr to settle before being placed in a 60 °C
incubator to cure for 16 hours. PDMS elastomers were then functionalized as described above.
Statistical analysis
Data are presented as mean ± SEM. GraphPad Prism 6 Software (San Diego, CA, USA) was used for
statistical analysis. The differences between two groups were analyzed by either the Mann-Whitney
test (unpaired test, not assuming Gaussian distribution) or the Wilcoxon matched-pairs signed rank
test (paired test, not assuming Gaussian distribution) as indicated in the figure legends. p-Values <
0.05 were considered significantly different.
Acknowledgements
We thank the Institute for Clinical Hemostaseology and Transfusion Medicine for providing donor
blood; Carmen Hässig, Cora Hoxha, Gertrud Schäfer, Sandra Janku, and Mengnan Li for excellent
technical help. This project was funded by the Deutsche Forschungsgemeinschaft (SFB 1027 projects
A2 to BQ, B2 to MB, A12 to SI, and SPP1782 ID79/2-2 to SI), INM Fellow (to BQ).
Additional information
Funding
Funder Grant reference number Author
Deutsche SFB1027 A2 Bin Qu
Forschungsgemeinschaft
Deutsche SFB1027 B2 Markus Bischoff
Forschungsgemeinschaft
Deutsche SPP1782 ID79/2-2 Sandra Iden
Forschungsgemeinschaft
Leibniz-Gemeinschaft INM Fellowship Bin Qu
Deutsche SFB1027 A12 Sandra Iden
Forschungsgemeinschaft
The funders had no role in study design, data collection and interpretation, or the
decision to submit the work for publication.
Author contributions
Philipp Jung, Formal analysis, Investigation, Methodology, Validation, Visualization, Writing – review
and editing; Xiangda Zhou, Investigation, Methodology, Writing – review and editing; Sandra Iden,
Methodology, Resources, Writing – review and editing; Markus Bischoff, Formal analysis, Funding
acquisition, Methodology, Resources, Writing – review and editing; Bin Qu, Conceptualization,
Funding acquisition, Investigation, Resources, Supervision, Writing – original draft, Writing – review
and editing
Author ORCIDs
Philipp Jung http://orcid.org/0000-0001-6182-6592
Sandra Iden http://orcid.org/0000-0003-2333-9827
Bin Qu http://orcid.org/0000-0002-9382-3203
Decision letter and Author response
Decision letter https://doi.org/10.7554/eLife.66643.sa1
Author response https://doi.org/10.7554/eLife.66643.sa2
Jung, Zhou, et al. eLife 2021;10:e66643. DOI: https://doi.org/10.7554/eLife.66643 10 of 13Short report Immunology and Inflammation | Physics of Living Systems
Additional files
Supplementary files
• Transparent reporting form
Data availability
All data generated or analysed during this study are included in the manuscript, figure supplements
or source data files. All files are uploaded.
References
Abraham RT, Weiss A. 2004. Jurkat T cells and development of the T-cell receptor signalling paradigm. Nature
Reviews. Immunology 4: 301–308. DOI: https://doi.org/10.1038/nri1330, PMID: 15057788
Babich A, Burkhardt JK. 2013. Coordinate control of cytoskeletal remodeling and calcium mobilization during
t-cell activation. Immunological Reviews 256: 80–94. DOI: https://doi.org/10.1111/imr.12123, PMID: 24117814
Basu R, Whitlock BM, Husson J, Le Floc’h A, Jin W, Oyler-Yaniv A, Dotiwala F, Giannone G, Hivroz C, Biais N,
Lieberman J, Kam LC, Huse M. 2016. Cytotoxic T cells use mechanical force to potentiate target cell killing.
Cell 165: 100–110. DOI: https://doi.org/10.1016/j.cell.2016.01.021, PMID: 26924577
Berquand A, Roduit C, Kasas S, Holloschi A, Ponce L, Hafner M. 2010. Atomic force microscopy imaging of living
cells. Microscopy Today 18: 8–14. DOI: https://doi.org/10.1017/S1551929510000957
Blumenthal D, Chandra V, Avery L, Burkhardt JK. 2020. Mouse T cell priming is enhanced by maturation-
dependent stiffening of the dendritic cell cortex. eLife 9: e55995. DOI: https://doi.org/10.7554/eLife.55995,
PMID: 32720892
Bromley SK, Burack WR, Johnson KG, Somersalo K, Sims TN, Sumen C, Davis MM, Shaw AS, Allen PM,
Dustin ML. 2001. The immunological synapse. Annual Review of Immunology 19: 375–396. DOI: https://doi.
org/10.1146/annurev.immunol.19.1.375, PMID: 11244041
Bufi N, Saitakis M, Dogniaux S, Buschinger O, Bohineust A, Richert A, Maurin M, Hivroz C, Asnacios A. 2015.
Human primary immune cells exhibit distinct mechanical properties that are modified by inflammation.
Biophysical Journal 108: 2181–2190. DOI: https://doi.org/10.1016/j.bpj.2015.03.047, PMID: 25954876
Butcher DT, Alliston T, Weaver VM. 2009. A tense situation: Forcing tumour progression. Nature Reviews.
Cancer 9: 108–122. DOI: https://doi.org/10.1038/nrc2544, PMID: 19165226
Butte MJ, Bruce M, Thauland TJ. 2014. Cytoskeletal stiffness controls the threshold of T cell activation. J
Immunol 192: eaah3737. DOI: https://doi.org/10.1126/scisignal.aah3731
Calzado-Martín A, Encinar M, Tamayo J, Calleja M, San Paulo A. 2016. Effect of Actin organization on the
stiffness of living breast cancer cells revealed by peak-force modulation atomic force microscopy. ACS Nano
10: 3365–3374. DOI: https://doi.org/10.1021/acsnano.5b07162, PMID: 26901115
Chin MHW, Norman MDA, Gentleman E, Coppens MO, Day RM. 2020. A hydrogel-integrated culture device to
interrogate T cell activation with physicochemical cues. ACS Applied Materials & Interfaces 12: 47355–47367.
DOI: https://doi.org/10.1021/acsami.0c16478, PMID: 33027591
de la Zerda A, Kratochvil MJ, Suhar NA, Heilshorn SC. 2018. Review: Bioengineering strategies to probe T cell
mechanobiology. APL Bioengineering 2: 021501. DOI: https://doi.org/10.1063/1.5006599, PMID: 31069295
Derjaguin BV, Muller VM, Toporov YP. 1975. Effect of contact deformations on the adhesion of particles. Journal
of Colloid and Interface Science 53: 314–326. DOI: https://doi.org/10.1016/0021-9797(75)90018-1
Desprat N, Guiroy A, Asnacios A. 2006. Microplates-based rheometer for a single living cell. Review of Scientific
Instruments 77: 055111. DOI: https://doi.org/10.1063/1.2202921
Du M, Kalia N, Frumento G, Chen F, Zhang Z. 2017. Biomechanical properties of human T cells in the process of
activation based on diametric compression by micromanipulation. Medical Engineering & Physics 40: 20–27.
DOI: https://doi.org/10.1016/j.medengphy.2016.11.011, PMID: 27939098
Dumitru AC, Mohammed D, Maja M, Yang J, Verstraeten S, Del Campo A, Mingeot-Leclercq MP, Tyteca D,
Alsteens D. 2020. Label-free imaging of cholesterol assemblies reveals hidden nanomechanics of breast cancer
cells. Advanced Science 7: 2002643. DOI: https://doi.org/10.1002/advs.202002643, PMID: 33240781
Esensten JH, Helou YA, Chopra G, Weiss A, Bluestone JA. 2016. CD28 costimulation: From mechanism to
therapy. Immunity 44: 973–988. DOI: https://doi.org/10.1016/j.immuni.2016.04.020, PMID: 27192564
Feng Y, Brazin KN, Kobayashi E, Mallis RJ, Reinherz EL, Lang MJ. 2017. Mechanosensing drives acuity of αβ
T-cell recognition. PNAS 114: E8204–E8213. DOI: https://doi.org/10.1073/pnas.1703559114, PMID: 28811364
Fregin B, Czerwinski F, Biedenweg D, Girardo S, Gross S, Aurich K, Otto O. 2019. High-throughput single-cell
rheology in complex samples by dynamic real-time deformability cytometry. Nature Communications 10: 415.
DOI: https://doi.org/10.1038/s41467-019-08370-3, PMID: 30679420
Fritzsche M, Fernandes RA, Chang VT, Colin-York H, Clausen MP, Felce JH, Galiani S, Erlenkämper C,
Santos AM, Heddleston JM, Pedroza-Pacheco I, Waithe D, de la Serna JB, Lagerholm BC, Liu T-L, Chew T-L,
Betzig E, Davis SJ, Eggeling C. 2017. Cytoskeletal actin dynamics shape a ramifying actin network
underpinning immunological synapse formation. Science Advances 3: e1603032. DOI: https://doi.org/10.1126/
sciadv.1603032, PMID: 28691087
Gavara N, Chadwick RS. 2016. Relationship between cell stiffness and stress fiber amount, assessed by
simultaneous atomic force microscopy and live-cell fluorescence imaging. Biomechanics and Modeling in
Mechanobiology 15: 511–523. DOI: https://doi.org/10.1007/s10237-015-0706-9, PMID: 26206449
Jung, Zhou, et al. eLife 2021;10:e66643. DOI: https://doi.org/10.7554/eLife.66643 11 of 13Short report Immunology and Inflammation | Physics of Living Systems
Harrison DL, Fang Y, Huang J. 2019. T-cell mechanobiology: Force sensation, potentiation, and translation.
Frontiers in Physics 7: 45. DOI: https://doi.org/10.3389/fphy.2019.00045, PMID: 32601597
Heu C, Berquand A, Elie-Caille C, Nicod L. 2012. Glyphosate-induced stiffening of Hacat keratinocytes, a peak
force tapping study on living cells. Journal of Structural Biology 178: 1–7. DOI: https://doi.org/10.1016/j.jsb.
2012.02.007, PMID: 22369932
Hochmuth RM. 2000. Micropipette aspiration of living cells. Journal of Biomechanics 33: 15–22. DOI: https://
doi.org/10.1016/s0021-9290(99)00175-x, PMID: 10609514
Hui KL, Balagopalan L, Samelson LE, Upadhyaya A. 2015. Cytoskeletal forces during signaling activation in
Jurkat t-cells. Molecular Biology of the Cell 26: 685–695. DOI: https://doi.org/10.1091/mbc.E14-03-0830,
PMID: 25518938
Hui KL, Upadhyaya A. 2017. Dynamic microtubules regulate cellular contractility during t-cell activation. PNAS
114: E4175–E4183. DOI: https://doi.org/10.1073/pnas.1614291114, PMID: 28490501
Jin W, Tamzalit F, Chaudhuri PK, Black CT, Huse M, Kam LC. 2019. T cell activation and immune synapse
organization respond to the microscale mechanics of structured surfaces. PNAS 116: 19835–19840. DOI:
https://doi.org/10.1073/pnas.1906986116, PMID: 31527238
Killian JL, Ye F, Wang MD. 2018. Optical tweezers: A force to be reckoned with. Cell 175: 1445–1448. DOI:
https://doi.org/10.1016/j.cell.2018.11.019, PMID: 30500527
Kummerow C, Schwarz EC, Bufe B, Zufall F, Hoth M, Qu B. 2014. A simple, economic, time-resolved killing assay.
European Journal of Immunology 44: 1870–1872. DOI: https://doi.org/10.1002/eji.201444518, PMID:
24599783
Li L, Steinmetz NF, Eppell SJ, Zypman FR. 2020. Charge calibration standard for atomic force microscope tips in
liquids. Langmuir 36: 13621–13632. DOI: https://doi.org/10.1021/acs.langmuir.0c02455, PMID: 33155810
Li J, Liu Y, Yuan Y, Huang B. 2021. Applications of Atomic Force microscopy in immunology. Frontiers of Medicine
15: 43–52. DOI: https://doi.org/10.1007/s11684-020-0769-6, PMID: 32820379
Majedi FS, Hasani-Sadrabadi MM, Thauland TJ, Li S, Bouchard LS, Butte MJ. 2020. T-cell activation is modulated
by the 3D mechanical microenvironment. Biomaterials 252: 120058. DOI: https://doi.org/10.1016/j.
biomaterials.2020.120058, PMID: 32413594
Pattu V, Qu B, Marshall M, Becherer U, Junker C, Matti U, Schwarz EC, Krause E, Hoth M, Rettig J. 2011.
Syntaxin7 is required for lytic granule release from cytotoxic T lymphocytes. Traffic 12: 890–901. DOI: https://
doi.org/10.1111/j.1600-0854.2011.01193.x, PMID: 21438968
Qu B, Pattu V, Junker C, Schwarz EC, Bhat SS, Kummerow C, Marshall M, Matti U, Neumann F, Pfreundschuh M,
Becherer U, Rieger H, Rettig J, Hoth M. 2011. Docking of lytic granules at the immunological synapse in human
CTL requires Vti1b-dependent pairing with CD3 endosomes. J Immunol 186: 6894–6904. DOI: https://doi.org/
10.4049/jimmunol.1003471, PMID: 21562157
Rossy J, Laufer JM, Legler DF. 2018. Role of Mechanotransduction and Tension in T Cell Function. Front Immunol
9: 2638. DOI: https://doi.org/10.3389/fimmu.2018.02638, PMID: 30519239
Sadoun A, Biarnes-Pelicot M, Ghesquiere-Dierickx L, Wu A, Theodoly O, Limozin L, Hamon Y, Puech PH. 2021.
Controlling T cells spreading, mechanics and activation by micropatterning. Sci Rep 11: 6783. DOI: https://doi.
org/10.1038/s41598-021-86133-1, PMID: 33762632
Saitakis M, Dogniaux S, Goudot C, Bufi N, Asnacios S, Maurin M, Randriamampita C, Asnacios A, Hivroz C.
2017. Different TCR-induced T lymphocyte responses are potentiated by stiffness with variable sensitivity. eLife
6: e23190. DOI: https://doi.org/10.7554/eLife.23190, PMID: 28594327
Schoppmeyer R, Zhao R, Cheng H, Hamed M, Liu C, Zhou X, Schwarz EC, Zhou Y, Knorck A, Schwar G, Ji S,
Liu L, Long J, Helms V, Hoth M, Yu X, Qu B. 2017. Human profilin 1 is a negative regulator of CTL mediated
cell-killing and migration. Eur J Immunol 47: 1562–1572. DOI: https://doi.org/10.1002/eji.201747124, PMID:
28688208
Tamzalit F, Wang MS, Jin W, Tello-Lafoz M, Boyko V, Heddleston JM, Black CT, Kam LC, Huse M. 2019.
Interfacial actin protrusions mechanically enhance killing by cytotoxic T cells. Sci Immunol 4: aav5445. DOI:
https://doi.org/10.1126/sciimmunol.aav5445, PMID: 30902904
Thauland TJ, Hu KH, Bruce MA, Butte MJ. 2017. Cytoskeletal adaptivity regulates t cell receptor signaling.
Science Signaling 10: aah3737. DOI: https://doi.org/10.1126/scisignal.aah3737, PMID: 28270556
Thewes N, Loskill P, Spengler C, Humbert S, Bischoff M, Jacobs K. 2015. A detailed guideline for the fabrication
of single bacterial probes used for atomic force spectroscopy. Eur Phys J E Soft Matter 38: 140. DOI: https://
doi.org/10.1140/epje/i2015-15140-2, PMID: 26701715
Trebak M, Kinet JP. 2019. Calcium signalling in T cells. Nat Rev Immunol 19: 154–169. DOI: https://doi.org/10.
1038/s41577-018-0110-7, PMID: 30622345
Wahl A, Dinet C, Dillard P, Nassereddine A, Puech PH, Limozin L, Sengupta K. 2019. Biphasic mechanosensitivity
of T cell receptor-mediated spreading of lymphocytes. PNAS 116: 5908–5913. DOI: https://doi.org/10.1073/
pnas.1811516116, PMID: 30850545
Wu P-H, Aroush DR-B, Asnacios A, Chen W-C, Dokukin ME, Doss BL, Durand-Smet P, Ekpenyong A, Guck J,
Guz NV, Janmey PA, Lee JSH, Moore NM, Ott A, Poh Y-C, Ros R, Sander M, Sokolov I, Staunton JR, Wang N,
et al. 2018. A comparison of methods to assess cell mechanical properties. Nature Methods 15: 491–498. DOI:
https://doi.org/10.1038/s41592-018-0015-1, PMID: 29915189
Zhang J, Zhao R, Li B, Farrukh A, Hoth M, Qu B, Ad C. 2020. Cell-cell-like inter-faces to characterize t cell
mechanotransduction. Acta Biomater 1: S1742.
Zhou X, Friedmann KS, Lyrmann H, Zhou Y, Schoppmeyer R, Knörck A, Mang S, Hoxha C, Angenendt A,
Backes CS, Mangerich C, Zhao R, Cappello S, Schwär G, Hässig C, Neef M, Bufe B, Zufall F, Kruse K,
Jung, Zhou, et al. eLife 2021;10:e66643. DOI: https://doi.org/10.7554/eLife.66643 12 of 13Short report Immunology and Inflammation | Physics of Living Systems
Niemeyer BA, et al. 2018. A calcium optimum for cytotoxic t lymphocyte and natural killer cell cytotoxicity. The
Journal of Physiology 596: 2681–2698. DOI: https://doi.org/10.1113/JP274964, PMID: 29368348
Jung, Zhou, et al. eLife 2021;10:e66643. DOI: https://doi.org/10.7554/eLife.66643 13 of 13You can also read