The Baltic Sea as a model region for green ports and maritime transport - we are paving the way
←
→
Page content transcription
If your browser does not render page correctly, please read the page content below
The Baltic Sea as a model region for
green ports and maritime transport

                                we are paving the way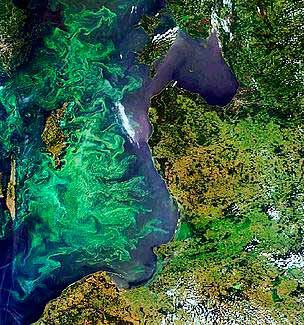
The Baltic Sea as a model region for green ports and maritime transport

Table of contents
                                          Sharing the standards and know-how with all of Europe                                       3
                                          The Baltic – the sea for all                                                                4
                                          Shipping and ports at the Baltic Sea                                                        4
                                          Container market                                                                            6
                                          Ro-ro and ferry market                                                                      6
                                          Cruise shipping market                                                                      7
                                          Impact of ports and shipping on the environment and human health                            7
                                          Regulations and policy aiming at a cleaner Baltic                                         10
                                          Air emission                                                                              10
                                          SOx                                                                                        11
                                          NOx                                                                                       12
                                          CO2                                                                                       12
                                          Sewage                                                                                    12
                                          Ballast water                                                                             13
                                          Responses to environmental regulation and best practices                                  14
                                          Scrubbers                                                                                 14
                                          LNG as an alternative fuel                                                                16
                                          On-shore power supply                                                                     17
                                          Port reception facilities for sewage                                                      18
                                          Rewarding eco-performance                                                                 19
                                          Environmental management in Baltic ports                                                  20
                                          Sources of information                                                                    21

                                          The Baltic Ports Organization is a regional ports organization inspiring and supporting its
                                          members while cooperating pro-actively with relevant partners. BPO was established on
                                          October 10, 1991, in Copenhagen, with an aim to facilitate cooperation among the ports
                                          and to monitor and improve the possibilities for shipping in the Baltic Sea region.

                                          Development over the past years has proceeded very quickly and at present BPO has
                                          entered new, challenging and exciting phases. Currently, included in BPO are 45 of the most
                                          significant ports in the nine countries surrounding the Baltic Sea as well as seven friendship
                                          members. BPO is well-recognized within the BSR, in EU bodies and other European regions.

                                          The organization’s mission is to contribute to economic, social and environmental sustain-
                                          able development of maritime transport and the port industry in the Baltic Sea region,
                                          thereby strengthening its global competitiveness.

                                          BPO is registered in Estonia (Port of Tallinn headquarter) and operates according to the
                                          Estonian Law on Non-profit Associations.

Author                                    BPO represents the interests of the Baltic Sea ports towards EU institutions and other
dr Magdalena Klopott                      relevant organizations.
Gdynia Maritime University                BPO contributes to the clean environment of the Baltic Sea, promotes environmental
                                          management in the ports and plays an active role in international dialogs where the envi-
BPO address                               ronment is concerned (BPO Environmental Working Group).
BPO Secretariat, c/o Actia Forum          BPO organizes dedicated conferences, seminars, study visits, dealing with questions in the
ul. Pułaskiego 8, 81-368 Gdynia, Poland   area of port operation and management, and the environmental impact of port activities.
BPO is registered in Tallinn, Estonia.    BPO supports and plays an active role in research, science and training which lead to
www.bpoports.com                          a better understanding of the transport sector in the region and to study future challenges.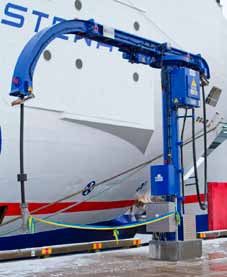
The Baltic Sea as a model region for green ports and maritime transport

Sharing the standards and know-how with all of
Europe
                                            The aim of this review is to show the Baltic ports’ proactive work towards making
                                            ports and maritime transport more environmentally-friendly. It concentrates on
                                            issues of special importance that have emerged from changes in the environmental
                                            regulations. Environmental regulations are indeed a challenge, but may also create
                                            an opportunity; they are demanding, but may spur innovation and development
                                            in regional cooperation. We also believe that they may enhance our competitive-
                                            ness in the long-term.

                                            A clean Baltic Sea is the common goal BPO would like to promote the Baltic ports’
                                            of all Baltic Sea Region (BSR) countries. standards more widely, simply because
                                            Baltic ports’ activities in the field of envi- Baltic ports have already paved the way
                                            ronmental management can serve as a for future green European ports and mari-
                                            set of good practices and a model for time transport .
                                            cooperation that can be followed by
                                            other European ports and the shipping industry. BPO would like to promote the
                                            Baltic ports’ standards more widely, simply because Baltic ports have already paved
                                            the way for future green European ports and maritime transport.

                                            Protection and sustainable growth of the Baltic is the unquestioned goal and
                                            a common understanding among the BSR countries as well as various stakehold-
                                            ers of the shipping industry. Baltic ports have even gone a step further than today’s
                                            regulations. Our experiences show that environmental regulation, often perceived
                                            as a costly nuisance, may also increase the demand for innovative solutions, which
                                            transform into new, applicable technologies.

                                            Indeed, we have the technology at our fingertips to start efficiently dealing
                                            with the environmental concerns at hand. Many of these technologies not only
                                            help protect the environment and obey the law but may also have a positive impact
                                            on the costs, especially in the long-term. Some Baltic ports and ship operators are
                                            already committed to taking advantage of green solutions.

                                            It must not be overlooked that the number of new regulations and responsibilities
                                            arising therefrom cause a substantial administrative and financial burden on both
                                            shipping and ports in regions where these regulations were imposed. It disturbs
                                            the competitiveness and creates unfair market conditions for maritime transport
                                            in the BSR compared to other regions in the EU. There is no rationale for double
                                            standards for the EU seas and double standards for the shipping business and
                                            ports in the EU.

                                            BPO wants to share our experiences and know-how with ports and shipping in the
                                            rest of Europe, but we also want to operate on a level playing field in all of Europe.
                                            Therefore, the BPO is of the opinion that the same rules should be applied in all
                                            of the EU’s seas and ports.

                                            There is a real potential for cleaner seas and air in whole Europe, but European
                                            policy makers, regulators as well as all European ports and stakeholders should
                                            take responsibility to improve the environmental performance. No one can be
                                            exempt from contributing to sustainable maritime transport in Europe.
                                            Everything that we do for the sake of the environment will in turn have a positive
                                            impact on all of us.

                                                                                                                                3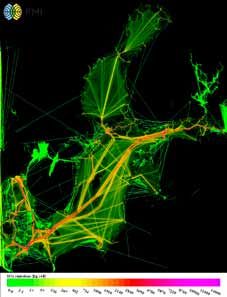
The Baltic Sea as a model region for green ports and maritime transport

The Baltic – the sea for all
                                       The Baltic Sea is a semi-enclosed sea that measures about 415 000 km² (Kattegat
                                       included) in area, and is regarded as one of the largest body of brackish water in
                                       the world, despite being a rather small sea in a global perspective. It is also a rel-
                                       atively shallow sea with mean depth of only 53 m. A very narrow and shallow
                                       connection to the North Sea and the Atlantic Ocean limits the water exchange,
                                       which is intermittent and very slow – in fact, the water remains in the Baltic Sea
                                       for about 30 years. Many rivers flowing into the sea additionally contribute to its
                                       brackish character. All of these features have a negative impact on the Baltic’s abil-
                                       ity to rejuvenate and make it highly sensitive and vulnerable to external factors.
                                       The Baltic Sea is surrounded by nine countries: Sweden and Finland to the north,
                                       Russia, Estonia, Latvia and Lithuania to the east, followed by Poland in the south,
                                       Germany and Denmark in the west. The catchment area extends over 1.7 mil-
                                       lion km² and is home to about 85 million people.

                                       The Baltic is an important economic area The sea provides us with a variety of ben-
                                       for BSR countries, which takes advan- efits for free, which contribute to our wel-
                                       tage of such a neighbourhood. The sea fare. It accommodates intensive traffic
                                       provides us with a variety of benefits for of cargo ships as well as enables people
                                       free, which contribute to our welfare. It to move between cities and countries in
                                       accommodates intensive traffic of cargo the Region.
                                       ships as well as enables people to move
                                       between cities and countries in the Region. It also serves as a recreation area and
                                       provides us with food resources.

                                       Unfortunately, a combination of the Baltic’s sensitivity and intensive human activity
                                       on both land and water results in progressive deterioration of this unique body of
                                       water. Over the past 100 years the Baltic has changed and its natural environment
                                       has degraded significantly. Together with the stagnation of the deeper water, pol-
                                       lution of the Baltic Sea has now become a threat to its flora and fauna.

                                       The Baltic’s ecological state and biodiversity are threatened by eutrophication result-
                                       ing from excessive nutrient input, direct pollution, growing ship traffic increasing
                                       the risk of spills and accidents, climate change, and direct human actions including
                                       overfishing and over-exploitation.

                                       The environmental challenges facing the Baltic have been known for a long time
                                       and are very well researched. There is strong scientific evidence identifying the
                                       factors causing these problems. One of these factors, though not dominant, is
                                       extensive trade between well-developed surrounding countries, which creates
                                       a demand for transport services, mainly shipping. Increasing maritime transporta-
Algal bloom in the Baltic Sea          tion, besides land-based pollution, threatens fragile ecosystems and the livelihoods
Source: ESA (European Space Agency).   of the many people who depend on the sea.

Shipping and ports at the Baltic Sea
                                       The BSR is a very prosperous region and maritime transport has contributed to its
                                       prosperity. The Baltic Sea is one of the most heavily trafficked seas in the world,
                                       accounting for up to 15% of the world’s cargo transportation. According to the
                                       HELCOM Automatic Identification System (AIS) for monitoring maritime traffic,

4
The Baltic Sea as a model region for green ports and maritime transport
established mid-2005, there are about The Baltic Sea is one of the most heav-
2,000 ships in the Baltic marine area at ily trafficked seas in the world, account-
any given time, and each month around ing for up to 15% of the world’s cargo
3,500-5,000 ships ply the waters of the transportation.
Baltic (HELCOM, 2009). In 2014, the
overall transport work increased by 2.2% year-on-year, while the total travelling
distance of IMO-registered vessels decreased 1.2%. The simultaneous increase
in transport work and the decrease in travel amount indicates an increase in aver-
age vessel transport capacity (HELCOM, 2015a).
Baltic ports have become crucial nodes Baltic ports have become crucial nodes in
in the international flow of goods and the international flow of goods and signifi-
significant wealth generators. About 200 cant wealth generators. About 200 ports
ports (excluding small recreational ports), (excluding small recreational ports), which
which are different with regards to own- are different with regards to ownership,
ership, size, traffic, turnover, infrastruc- size, traffic, turnover, infrastructure, etc.,
ture, etc., are settled along the Baltic are settled along the Baltic coastline.
coastline. The Baltic seaports’ turno-
ver has developed steadily. The decade
2005-2014 brought double digit growth (+14.3%) to the entire Baltic ports sector;
however, it does not mean that disruptions on global and regional markets have
passed unnoticed.
In 2015 the total figure in BSR countries’ port turnover amounted to 870.0 mln
tonnes, with Russia leading in total port handlings since 2011, leading also in liquids
and dry bulk turnovers. Sweden still remains the leader in general cargo handlings.
BSR coun- 2010 2014 2015 2010/2015 2014/2015
tries’ seaports (mln tn) (mln tn) (mln tn) (%) (%)
BSR countries’ seaports turnovers turnovers
Source: Baltic Port Yearbook 2014/2015,
total freight 814.1 871.1 870.0 +7.0 -0.13
Baltic Transport Journal 2/2016.
The rankings of the Top 10 Baltic ports in 2015 show the domination of Russian
ports, especially with regards to the total freight turnovers, where only one port
of the western Baltic is present (Gothenburg).
Total freight Liquids Dry bulk General cargo
1 Ust-Luga Primorsk Ust-Luga St. Petersburg
2 Primorsk Ust-Luga Riga Gothenburg
3 St. Petersburg Gothenburg Klaipeda Lübeck
4 Riga Sköldvik Gdańsk Trelleborg
5 Klaipeda Brofjorden Szczecin-Świnoujście Klaipeda
6 Gothenburg Gdańsk St. Petersburg Helsinki
7 Gdańsk Ventspils Luleå Rostock
8 Ventspils Tallinn Rostock Gdańsk
9 Tallinn Vysotsk Gdynia Szczecin-
Świnoujście
Top 10 Baltic seaports in 2015 in terms of 10 Sköldvik Klaipeda Ventspils Gdynia
cargo turnover (in millions of tonnes)
Total in 2015 414.7 245.7 120.3 134.8
Source: Baltic Transport Journal, 2/2016.
However, the ports’ standings in the ranking change around a little bit each year.
Ports in Sweden and the Baltic states as well as the Port of Rostock have consid-
erable importance in the BSR. The Polish Port of Gdańsk is among the Top 10
ports in every ranking.
5The Baltic Sea as a model region for green ports and maritime transport
container market
Container turnover in BSR ports constitutes approximately 1.2% of the global and
9.9% of the European container markets. The importance of the Baltic container
market rose after global operators’ direct services began to call Baltic ports in 2010
(e.g. Maersk AE-10 from Busan to Gdańsk). In 2011-2014 Baltic ports handled
almost 10 million TEUs yearly. A substantial decrease in container volumes was
experienced in 2015, when, compared to the year before, a total loss of 1.23 mil-
lion TEUs was recorded. The majority of ports suffered from declining container
turnovers and only Finnish and Danish ports recorded a positive result in the BSR.
2014 2015 yoy
1 St. Petersburg 2,375.0 1,715.1 -27.8%
2 Gdańsk 1,212.05 1,091.2 -10.0%
3 Gothenburg 836.6 820.0 -2.0%
4 Gdynia 849.1 684.8 -19.4%
5 HaminaKotka 575.0 553.4 -3.4%
6 Aarhus 424.0 445.0 +5.0%
7 Helsinki 401.0 430.4 +7.5%
Top 10 Baltic container seaports in 2015 8 Klaipeda 450.4 392.7 -12.8%
(TEU turnover in thousands) 9 Riga 387.6 355.2 -8.3%
Source: A (rather) quiet year. Baltic trans-
10 Rauma 275.7 263.0 -5.5%
port 2015 highlights, BTJ 1/2016.
ro - ro and ferry market
The Baltic is known for its ferry and ro-ro shipping intensity and the majority of
the intra-BSR trade passes through Baltic ports. In 2015 there were 34 shipping
operators sailing their ferries and ro-ro ships (including some con-ro) as well as
car carriers to, from and within the Baltic Sea area.
Cargo (thousands tn) Passengers (thousands)
1 Trelleborg 10,910 1 Helsinki 11,169
2 Lübeck- 10,471 2 Stockholm 10,657
Travemünde
3 Gothenburg 8,181 3 Tallinn 9,295
4-5 Puttgarden 6,674 4 Helsingborg 7,670
4-5 Rødby 6,674 5 Helsingør 7,643
6 Helsinki 6,577 6 Puttgarden 6,141
7 Stockholm 5,949 7 Rødby 6,139
8 Rostock 5,858 8 Turku 2,705
9 Szczecin- 5,160 9 Odden 2,690
Top 10 ferry/ro-ro Baltic ports (cargo/pas- Świnoujście (estimated)
sengers) in 2015
Source: Baltic Transport Journal, 3/2016. 10 Helsingborg 4,526 10 Hirtshals 2,600
Currently, there are approximately 109 single services, with 63 ro-pax connec-
tions and 46 freight lines (including nine feeder services by car carriers). Finnlines
and Stena Line provide 11 services each,
whilst DFDS operates nine services. Currently, there are approximately 109
Ro-ro and ferry traffic goes through 71 single services, with 63 ro-pax connec-
ports within the borders of the BSR, tions and 46 freight lines (including nine
with more than half of them in Sweden, feeder services by car carriers).
6The Baltic Sea as a model region for green ports and maritime transport
Denmark and Finland. The Baltic is linked directly with at least 30 ports located
in the rest of Europe.
cruise shipping market
The Baltic Sea Region offers an impres- The Baltic Sea Region offers an impres-
sive array of UNESCO World Herit- sive array of UNESCO World Heritage
age Sites, ready to be admired. Passen- Sites, ready to be admired. Passengers
gers of cruise lines are willing to explore of cruise lines are willing to explore them
them during short visits in Baltic ports. during short visits in Baltic ports.
Although the number of vessel calls has
remained rather stable over the last 15 years, the number of passengers has
increased more than four times: from 1,072,000 passengers in 2000 to 4,297,000
in 2015 with an average annual growth rate of 9.7%.
Passengers Ship calls
1 Copenhagen 677,000 1 St. Petersburg 285
2 Stockholm 530,229 2 Copenhagen 283
3 St. Petersburg 505,359 3 Tallinn 280
Top 5 Baltic cruise ports in 2015 (by pas- 4 Tallinn 500,622 4 Helsinki 254
sengers and by ship calls)
Source: Cruise Baltic Market Review 2016 5 Helsinki 436,500 5 Stockholm 249
In the same timespan the number of port calls increased from 1,479 to 2,174, with
an average annual growth rate of 2.6%. It is estimated that in 2016 the BSR region
will be visited by about 4.4 million cruise passengers.
However, the dynamic growth in maritime trade over the last decades has resulted
in increased emissions and pollution from shipping – a phenomenon, which must
not be overlooked. Growth in transhipment, handling, storage and further pro-
cessing of cargo (logistics) directly translates into rising air and water pollution levels
as well as other externalities such as noise, accidents, etc.
Impact of ports and shipping
on the environment and human health
Shipping is the most environmentally-friendly mode of transport in terms of emis-
sions per tonne of cargo. However, research confirms that the marine transport
sector contributes significantly to air pollution, especially along the coastal areas
near busy shipping lines, causing the exposed population adverse health effects
(Corbett et al., 2007). It is estimated that nearly 70% of ship exhaust emissions
occur within 400 km of the coastline (Endresen et al., 2003).
Emissions are also generated in seaports Emissions are also generated in seaports
and come from a variety of sources: and come from a variety of sources: ships
ships calling in a port (while manoeu- calling in the port (while manoeuvring and
vring and at berth), loading/unloading at berth), loading/unloading operations,
operations, storing and warehousing, storing and warehousing, and the industry
and the industry located within the port located within the port area.
area. Another crucial source of pollution
is a port’s connections with its hinterland. Even though ports can play an important
role in promoting regional economic development, in many cases they become a
significant source of pollution in their host cities as a lot of seaports are still located
near densely populated areas.
7The Baltic Sea as a model region for green ports and maritime transport
The major air pollutants related to shipping and port activities that can affect human
health and the environment include carbon oxides (COx), particulate matters (PM),
volatile organic compounds (VOCs), nitrogen oxides (NOx), sulphur oxides (SOx)
and ozone. Other air pollutants from port operations such as formaldehyde, heavy
metals, dioxins and pesticides used to fumigate produce, can also be a problem.
These pollutants, especially PM and VOCs, have a profound negative impact on
health and the climate. They can contribute to human health issues such as lung
cancer, asthma, cardiopulmonary diseases (Corbett et al., 2007), as well as damage
vegetation, the built environment and cultural heritage.
It is worth noting that during the last two decades emission of air pollutants from
land-based sources has been substantially reduced across Europe. In the same
time span modest regulations have been introduced for emissions from maritime
transport, which uses residual fuel oil that can no longer be used in land-based
facilities due to environmental restrictions.
The sector’s environmental impact on European air quality and climate change is
significant. The total incoming and outgoing ship traffic in EU-27 ports from both
national and international shipping can amount to 10-30% CO2, 10-20% NOx,
10-25% SOx, and 10-25% of PM2.5 global shipping emissions (EEA, 2013). Effec-
Emission from BS shipping 2015
Source: HELCOM
tively reducting ship emissions in European waters, either through international or
EU environmental legislation, can have a significantly impact on a global scale as well.
Looking solely at the Baltic Sea, accord- Looking solely at the Baltic Sea, accord-
ing to HELCOM, the annual emissions of ing to HELCOM the annual emissions of
ships plying its waters in 2014 (HELCOM, ships plying its waters in 2014 (HELCOM,
2015a) were 320 kt of NOx, 81 kt of 2015a) were 320 kt of NOx, 81 kt of SOx,
SOx, 16 kt of PM, 34 kt of CO and 15.0 16 kt of PM, 34 kt of CO and 15.0 Mt
Mt of CO2. The CO2 amount corre- of CO2.
sponds to 4,750 kilotonnes of fuel, of
which 22% was associated with auxiliary engines. One vessel during 8 hours at
a port emits an amount of NOx equivalent to that of 10,000 cars driving 1,000
km each. Ferries and ro-ro vessels make the most significant contributions to emis-
sions, followed by tankers, cargo ships and container ships.
Pollutant Impact
SOx react with water molecules to produce acids and acid rain; harmful to
Sulphur oxides plants, aquatic animals, buildings, infrastructure; as a precursor for PM
may cause respiratory, cerebrovascular and cardiopulmonary diseases
NOx contribute to eutrophication of the sea; cause acid deposition, simi-
Nitrogen oxides larly to SOx; contribute to ground ozone and PM formation; may
cause respiratory, cerebrovascular and cardiopulmonary diseases
PM may be emitted directly from a ship’s exhaust system or formed from
Particulate matters SOx and NOx (secondarily formation); small enough to penetrate
into the alveolar gas exchange region of the lungs; associated with
detrimental effects on human health: respiratory, cerebrovascular and
cardiopulmonary diseases; carcinogenic
O3 formed in the atmosphere through chemical reactions involving vola-
Ozone (ground level) tile organic compounds (VOCs) and NOx and VOCs; responsible for
damages to crops, plants, forest
CO2 one of the greenhouse gases (i.e. heat-trapping gas); contributes
Carbon dioxide to global warming and climate change; poses the risk of irreversible
changes if it continues to accumulate unabated in the atmosphere; for
the period 2007-2012, on average, shipping accounted for approxi-
mately 3.1% of annual global emission of CO2 (IMO 2016)
The emission of all pollutants except CO has decreased 2.2% to 2.8% compared
to the year 2013 and have decreased gradually since 2006, thanks to the tightened
SOx emission regulations of the MARPOL and the EU.
8The Baltic Sea as a model region for green ports and maritime transport
All of these air and water emissions from port activity and shipping have strong
repercussions for human health and life expectancy as well as for terrestrial and
marine ecosystems.
In the past few years we have observed considerable accumulation of new, com-
pelling evidence on the health effects of air pollution as well as their economic
cost (e.g. lost productivity, cost of medical care, cost of pain, suffering). According
to EEA (2015) every year more than 400,000 EU citizens die prematurely due
to air pollution. Air pollution is a significant risk factor, which can be attributed to
a number of causes of death, especially cardiovascular and cerebrovascular (WHO,
2015). Premature deaths translate into a substantial number of years of life lost
(YOLL). In the 40 European countries assessed by the EEA, 4,804,000 YOLL
are attributed to PM2.5 exposure, while 828,000 YOLL and 215,000 YOLL are
attributed to NO2 and O3 exposure, respectively (EEA, 2015).
Another equally important albeit underrepresented problem is the issue of water
pollution by sewage from passenger ships as well as accidental and deliberate oil
spills and the spreading of harmful aquatic organisms and pathogens (e.g. microbes,
small invertebrates, bacteria, eggs, cysts and larvae of various species) through the
exchange of ballast water between different aquatic ecosystems.
Sewage is generated on-board all ships, sometimes in large quantities, especially
in the case of large passenger vessels. For example, a medium-sized passenger
ship generates 50 tonnes of blackwater daily. Discharges of such waste into port
waters may include organic, biological, chemical and toxic pollutants. Nitrogen
and phosphorous loads from a ship’s sewage contributes to the nutrient pollution
of the Baltic Sea, thereby to eutrophication. Even though the total nutrient load
from ship sewage is much lower than from land-based sources, it still constitutes
a significant amount.
Sewage together with NOx emissions Sewage together with NOx emissions from
from ships contribute to the eutrophi- ships contribute to the eutrophication of
cation of the Baltic Sea. The effects of the Baltic Sea.
eutrophication are most likely the single
greatest threat to the unique and fragile environment of the Baltic Sea (HELCOM,
2010). Nitrogen and phosphorus are the primary nutrients that in high concen-
trations stimulate the growth of algae, which in turn upset the balance of the eco-
system and cause eutrophication (HELCOM, 2009). Harmful algal bloom is the
most evident problem of the Baltic and is dangerous to both animals (fish, birds
and mammals) and humans (children in particular). It was estimated that 71% of
the EU Natura 2000 area was exposed to eutrophication in 2010 (EC, 2013).
Other port and shipping externalities such as noise emission, land use, dust and
odours connected with cargo handling as well as accidents and congestion on
access roads of a port, should not be omitted. Moreover, in ports and their inlets,
dredging may sometimes cause environmental problems as well.
There are still some insufficiently investigated environmental challenges, such as
marine litter or underwater noise; however, their negative impact is still under
discussion as they are believed to cause environmental damage in the future
(HELCOM, 2014).
It has become clear that a regulatory framework on an international as well as
regional level is essential to combat problems arising from the negative environ-
mental impact of shipping and seaports.
9The Baltic Sea as a model region for green ports and maritime transport
Regulations and policy aiming at a cleaner Baltic
In order to limit the pollution from worldwide shipping, a number of environmen-
tal regulations cover areas where shipping leaves its mark: air emissions, sewage,
garbage, oil, noxious liquids and harmful substances as well as ballast water and
ship recycling.
The International Maritime Organization (IMO) was leading the development of
global regulations to minimise the negative impact of shipping on the environment,
which resulted in MARPOL 73/78 (The International Convention for the Preven-
tion of Pollution from Ships) and its six annexes that govern the shipping industry’s
environmental performance.
Despite the global regulation provided by the IMO, the EU and BSR countries
have developed a policy framework at their own pace, often being ahead of
the global environmental regulations for shipping. Since the early 1970s the
BSR countries have undertaken joint efforts aiming at stopping the deterioration of
the Baltic. This resulted in the signing of the Convention of the Protection on the
Marine environment of the Baltic Sea Area, also known as the Helsinki Convention.
The Helsinki Commission (HELCOM) as a governing body plays an invaluable
role in the Baltic’s protection, has led to significant environmental improve-
ments in many areas and has enhanced the coordination among BSR countries.
In order to further stimulate the work towards a cleaner Baltic, the HELCOM Baltic
Sea Action Plan was adopted in 2007. Its ambitious aim is to restore the good
ecological condition of the Baltic marine environment by 2021.
Subsequently, in October 2009, the EU Strategy for the Baltic Sea (EUSBSR) was
adopted by the European Council to address “the urgent environmental challenges
arising from the increasingly visible degradation of the Baltic Sea,” being the first
EU macro-regional strategy. One of its policy areas is for the BSR “to become a
model region for clean shipping,” coordinated by the Danish Maritime Authority.
air emission
Reducting air emissions from shipping has been a hot topic in the maritime indus-
try over the last decade. A discussion took place within the context where emis-
sion and fuel standards for international shipping lag behind those of land-based
transport modes. Indeed, a wide range of regulatory measures has been adopted
in recent years to curb air pollution from land-based sources, whereas shipping
Annex I Annex VI HELCOM 1.0% ECA
MARPOL
Pollution by Oil Air Emission Baltic Sea SOx limit
73/78 Annex IV
Annex II from Ships Action Plan
Sewage
Noxious Liquids in Bulk
0.1% Suphur
limit in EU ports
1992
1988 2005 2009
2007
1973
1974 1983
1978 2003 EU Directive 2010
Annex III
2005/33/EC
Harmful
(Baltic as SECA)
Annex V Substances
HELSINKI 1.5% Sulphur limit EU Strategy
Garbage in Packaged
Convention on EU waters for the Baltic Sea
Form
10The Baltic Sea as a model region for green ports and maritime transport
emissions remained untouched.
The regulatory framework for tackling the issue of reducing exhaust gas emissions
from ships was developed by the IMO, as well as on an EU level. The IMO is
addressing air pollution through MARPOL 73/78 Annex VI, which entered into
force in 2005 and its revised version with significantly tightened emissions limits
adopted in 2008 and entered into force on 1 July 2010. On an EU level, the prob-
lem is addressed through different EU directives, however focussing exclusively
on SOx reduction.
sox
The first EU regulation concerning a reduction in the sulphur content in certain
liquid fuels was Council Directive 1999/32/EC. This directive was amended by
Directive 2005/33/EC of the European Parliament and of the Council that desig-
nated the Baltic Sea, the English Channel and the North Sea as Sulphur Emission
Control Areas (SECAs) and limited the maximum sulphur content in fuels used
by ships operating in these areas to 1.5% of total mass. This fuel standard also
applied to passenger ships operating regular services outside SECAs. In addition,
it also introduced a 0.1% by mass maximum sulphur requirement for fuels used
by ships at berth in EU ports, effective from 1 January 2010.
The maximum sulphur level of 0.1% in The maximum sulphur level of 0.1% in
ships’ fuel currently imposed in Euro- ships’ fuel currently imposed in Euro-
pean SECA came into force to mirror the pean SECA came into force to mirror the
requirements of the 2008 IMO amend- requirements of the 2008 IMO amend-
ment to MARPOL Annex VI. This limit ment to MARPOL Annex VI.
was introduced by Directive 2012/33/
EU and since 1 January 2015 all ships navigating in SECA have been obliged to
comply with it. Furthermore, the directive schedules the 0.5% by mass fuel
standard to be introduced in 2020 irrespective of the possible postponement by
the IMO, and sets a 3.5% by mass cap for the sulphur content in fuel for ships
equipped with a scrubber, except for scrubbers operating in closed mode. As a
result, there are currently three standards on European waters: low sulphur fuel
(0.1% sulphur) applied within SECAs and at berth in EU ports, 1.5% fuel for pas-
senger ships plying outside SECA and 3.5% fuel outside SECA for other ships.
The northern parts of Europe have, willingly or not, become a testing ground pre-
ceding the introduction of the stricter 0.5% sulphur limits, which should come into
force worldwide in 2020 (or 2025, pending review of fuel availability).
Baltic as EEDI Ballast Water IMO Baltic as Special Area
Special Area phase 1 Management Global for Sewage in force
for Sewage Convention MRV new ships/existing ships
System
0.1% ECA
SOx limit 2018 0.5%
2012 Global
2016 SOx limit 2025
2011
2015 2020
2019 2021
ECA NOx
3.5% MRV Regulation (NOx Tier III
Global CO2 Monitoring EEDI for new ships) EEDI
SOx limit Reporting Verification phase 2 Baltic Sea phase 3
11The Baltic Sea as a model region for green ports and maritime transport
nox
The MARPOL convention and its Annex VI, Regulation 13 provides for the con-
trol of NOx emissions from marine diesel engines of over 130 kW output power
(excluding ships used solely for emergency purposes). Different levels (Tiers) of
control apply based inter alia on the ship’s construction date and within each Tier
the engine’s rated speed determines the actual limit. NOx Tier III applies only to
specified ships operating in areas designated as Emission Control Areas (ECA). Tier
I and Tier II limits apply globally regardless of ECAs for NOx being established or
not. So far, the North American ECA and United States Caribbean Sea ECA are
the only NECAs designated by the IMO.
The Baltic Sea has not been established as an ECA for nitrogen oxides yet; however,
according to the HELCOM Roadmap a proposal to do so will be submitted at the
IMO MEPC 70 meeting, scheduled for autumn 2016. The initiative for a Baltic Sea
NECA emerges from the above-mentioned HELCOM Baltic Sea Action Plan. The
process is going to be synchronized with NECA designation in the North Sea. The
effective date in the proposed roadmap has been fixed to 1 January 2021. Once
the regulation enters into force, only ships constructed (engines installed) on or
after the effective date will have to comply with the new standards.
co2
Shipping is treated by the Kyoto Pro- They aim at enhancing ships’ efficiency
tocol in a different way, primarily due and require that all ships constructed from
to the international nature of maritime 2025 must be 30% more efficient com-
transport and the complexity of allocat- pared to those from the year 2000.
ing ownership of the CO2 emissions. In
order to tackle the problem, a global approach to CO2 reduction was developed
by the IMO, which in 2011 adopted “Regulations on energy efficiency for ships” (a
new chapter in Annex VI). It introduced technical and operational measures: the
Energy Efficiency Design Index (EEDI), which sets compulsory energy efficiency
standards for new ships, and the Ship Energy Efficiency Management Plan (SEEMP)
– a management guide for shipowners. They aim at enhancing ships’ efficiency and
require that all ships constructed from 2025 must be 30% more efficient com-
pared to those from the year 2000.
International shipping is also not covered by the EU’s current CO2 emissions reduc-
tion targets. However, important steps for integrating maritime emissions into the
EU’s policy for reducing its domestic GHG emissions have been taken. The first
step is the MRV Regulation adopted in 2015, which from 2018 will oblige shipown-
ers to monitor and report the verified amount of CO2 emitted by their large ships
(over 5,000 GT) on voyages to, from and between EU ports.
Recently, the possibility of agreeing on a global MRV system has opened up. At the
69th session of the IMO’s Marine Environment Protection Committee (MEPC),
draft amendments to MARPOL Annex VI were approved, establishing a manda-
tory system for the collection of data on fuel consumption from ships of 5,000 GT
and above. The intention is to adopt it formally at MEPC 70, which would lead to
entry into force in 2018; data collection would commence in 2019. This is the first
step in the IMO’s three-step approach of tackling GHG emissions from shipping
(the second step would be an analysis of the collected data and the third – deciding
what market-based-measures, if any, need to be taken). It is reasonable to expect
that the IMO’s global data collecting system should replace the EU’s MRV one.
This is the basis for a discussion on shipping’s “fair share” of the international
12The Baltic Sea as a model region for green ports and maritime transport
community’s efforts to curb GHG emissions, taking into account the UNFCCC
COP 21 Paris Agreement.
sewage
Sewage discharges from merchant ships are regulated globally by Annex IV to
MARPOL 73/78, which entered into force in 2003; its revised version was adopted
in 2004 and entered into force one year later. It applies to ships of 400 GT or
above or those certified to carry more than 15 persons. The Annex permits the
sewage discharge only when a ship is far enough from the nearest land i.e. at least
3 or 12 nautical miles (the former applies when the sewage is comminuted and
disinfected by an approved installation, while the latter if the sewage is untreated).
The Helsinki Convention further extends the MARPOL provisions to smaller ships.
It is worth mentioning that notwithstanding the IMO regulation, HELCOM adopted
its first Recommendations 1/1 targeting sewage from ships already in 1980 (“Rec-
ommendation concerning measures to ensure the use of reception facilities for
wastes from ships”) and the sewage issue has been on the agenda for many years.
HELCOM has also put forward a proposal to the IMO to designate the Baltic Sea
as a special area for sewage from passenger ships (carrying more than 12 pas-
sengers), which became a reality in 2011. This means that sewage discharge into
the Baltic Sea will be prohibited, unless it is processed by an approved on-board
sewage treatment plant. Alternatively, untreated sewage can be delivered to a
port reception facility (PRF). The decision entered into force on 1 January 2013.
Originally, the special area status was HELCOM countries notified the lack of
planned to take effect on 1 January 2016 ready PRFs for sewage, thus the entry
for new ships and on 1 January 2018 for dates have been postponed to 2019 and
old, at the earliest, subject to the avail- 2021.
ability of adequate sewage PRFs in the
ports within the region. The pace at which the network of PRFs was being cre-
ated was insufficient and HELCOM countries notified the lack of ready PRFs for
sewage, thus the entry dates have been postponed to 2019 and 2021, respectively.
The 69th MEPC/IMO meeting confirmed the dates agreed upon at the HELCOM
level; however, in certain cases (e.g. direct passages between the St. Petersburg
area and the North Sea) the deadline has been postponed to 2023.
ball ast water
In response to the growing problem of introducing invasive species from ships’
ballast water and associated sediments into water basins, the IMO International
Convention for Control and Management of Ships’ Ballast Water and Sediments
(BWMC) was adopted in 2004. Implementation of the BWM Convention is sup-
ported by numerous guidelines, which have been developed and adopted since
2004. They establish, among others, standards and procedures for BW treatment,
requirements for ballast water management systems and reception facilities and
rules for implementing the Ballast Water Management Plan. The multifaceted
nature of the convention and the documents that support it as well as the inter-
disciplinary and inherent complexity of the problem render this legal instrument
highly complicated.
The convention will enter into force The convention will enter into force
12 months after its ratification by 12 months after its ratification by 30 states,
30 states, accounting for 35% of the accounting for 35% of the world merchant
world merchant shipping tonnage. As shipping tonnage.
of 8 March 2016 BWMC has been rati-
fied by 49 countries representing 34.82% of the world tonnage, so it is expected
13The Baltic Sea as a model region for green ports and maritime transport
to enter into force very soon.
In 2012 HELCOM already undertook steps in preparing for the BWMC’s entry
into force. The HELCOM Ballast Water Road Map was adopted as a part of the
HELCOM Baltic Sea Action Plan. It highlighted the need to cooperate with the
North Sea countries to put in place a consistent exemption regime. One outcome
of this cooperation is a jointly agreed upon regional procedure for applying and
granting exemptions, adopted by HELCOM and OSPAR in 2013 (amended in 2015).
Responses to environmental regulation and
best practices
Baltic ports and maritime transport had to respond to the challenges and face the
problems arising from new and forthcoming environmental regulations and Baltic
Sea deterioration.
Despite serious concerns, European shipowners and ports were fully prepared
for the new requirements and often exceeded expectations – some of their ini-
tiatives have gone far beyond these regulations. In many cases it was the ports
that became environmental leaders promoting green initiatives; however, noth-
ing could have been achieved without the cooperation between all stakeholders
motivated by a single vision – a clean Baltic.
The main concerns that arose from the The main concerns that arose from the
recent regulations were related to the recent regulations were related to the
implementation of the 0.1% sulphur limit implementation of the 0.1% sulphur limit
in the SECAs. First of all, there were in SECAs.
justified fears that it may be detrimental
to the shipping industry’s competitiveness and may provoke a modal shift from
sea to land, because of the significant difference in the price of low sulphur fuels
(MGO) and fuels with a higher sulphur content (IFO). Fortunately, the drop in
fuel prices experienced in 2015 and Q1 of 2016 has limited the negative impact
of the EU Sulphur Directive.
Switching to low sulphur fuels (MGO) is currently the most popular option. To
meet the requirements of the EU sulphur directive and reduce SOx emission
from ships, ship-owners may also consider alternative fuel types such as LNG and
methanol or continue to operate on high sulphur fuel as long as sulphur scrubbers
are installed on the ship’s board to wash the sulphur from the exhaust gases. All
solutions and technologies allowing to meet sulphur limits are available from stock
for port authorities and ship operators.
The shipping industry’s response was manifold – from service closures and com-
panies exiting the market, through fleet renewals and retrofitting, to prosperity for
shipyards signing contracts for scrubber installation and more orders for scrubber
manufacturing companies.
scrubbers
In search of alternatives, some shipowners decided to invest in abatement tech-
nology, mainly in exhaust gas cleaning systems (EGCS) – popularly known as sul-
phur scrubbers.
According to DNV-GL (Mohn, 2014) in the year 2000 there was only a single
scrubber-equipped ship in operation and by 2014, in the anticipation of the
14The Baltic Sea as a model region for green ports and maritime transport
forthcoming regulation, their numbers Considering order books and trends, it is
had increased to 77. Considering order expected that a total of 200 ships with
books and trends, it is expected that scrubbers on board will be exceeded in
a total of 200 ships with scrubbers on 2017.
board will be exceeded in 2017. Cur-
rently, irrespective of decreasing fuel prices, shipowners still invest in scrubber
technology. Within European SECA 5.4% of the total short sea shipping fleet had
been equipped with scrubbers by the end of 2015 (i.e. 73 vessels; 10 more were
scheduled to be retrofitted at the beginning of 2016).
70,9 27,8 1,3
81 11,6 7 0,4
97,9 2,1
99,2 0,8
Technology applied in order to meet 98,8 0,3 0,9
sulphur regulations by ships operating in
SSS in the European SECAs (1Q 2016).
Source: BPO SECA Report (2016) MGO HFO+scrubber LNG other
There are two main types of sulphur scrubbers available on the market: dry and
wet scrubbers. The most popular are wet scrubbers using ambient seawater (open
loop) or fresh water (closed loop) for gas scrubbing. The use of open-loop scrub-
bers has already been banned by some EU countries, due to its potential nega-
tive impact on the marine environment (wash water is discharged into the sea).
A variation of the closed loop system is a hybrid system which can operate as an
open loop system while outside ECA. Dry scrubbers, widely used in land-based
industry, are not popular in shipping and now there is only a single ship plying on
the European waters which is equipped with a dry scrubber. It is worth mention-
ing that the use of scrubbers creates a need for receiving waste generated by the
EGC systems. This kind of waste is currently not within the scope of EU Direc-
tive 2000/59/EC, which obliges ports to receive specified wastes under the waste
fee. Baltic ports, however, enable the shipowners to disposal of scrubber waste.
41
28
5
5
3
Number of ships powered by LNG oper-
ating in the European SECAs (1Q 2016, 1
domestic and international traffic).
Source: BPO SECA Report (2016)
EGC systems are a solution for both new constructions and retrofits. The installa-
tion choice depends on a number of factors such as cost of low sulphur fuels, capital
expenditure, operating expenditure of the scrubber, or time spent in the SECA.
The aforementioned factors predetermined the installation of (or the decision
to install) scrubbers on ships operating in the Baltic Sea on fixed routes – ferries,
ro-ro and general cargo (feeder container ships) – which constitute the majority
15The Baltic Sea as a model region for green ports and maritime transport
of all ships equipped with scrubbers.
Judging by the shipowners’ websites and companies’ reports (as of the beginning
of 2016) some ferry/ro-ro operators have decided to retrofit half or even more
of their fleets by installing scrubbers.
0-5 years
4-10 years
35%
39% 11-20 years
21-30 years
Statistics on the age of vessels when retro-
fitting took place. 3%
23%
Source: Rozmarynowska (2016)
The biggest investment in scrubber technology is foreseen by DFDS Seaways,
which plans to complete the installation of scrubbers on 21 ships by 2017 (11 of
which have already been equipped). Other shipping companies also have ongoing
retrofit programmes, notably Finnlines (15 ships, 10 retrofits finalised), Transfennica
(6 ships), Color Line (4 ships) and Scandlines on 4 ships (2 planned).
lng as an alternative fuel
Shipowners can choose an alternative fuel path in order to meet the emission
requirements. Other fuels such as biodiesel, methanol and ethanol as well as LNG
have been widely researched and tested. In particular, the use of LNG as a ship’s
fuel attracts special attention of the shipping industry.
Remarkably, switching to LNG ensures LNG enables a significant reduction of air
not only SECA compliance, but also pollution – ranging from SOx, NOx, and
forthcoming rules on nitrogen oxides PM to CO2 and black carbon.
emissions. It enables a significant reduc-
tion in air pollution – ranging from SOx, NOx, and PM to CO2 and black carbon.
The SOx is completely removed, emissions of NOx and PM reduced up to 85%
and CO2 emissions by at least 20% (DNV, 2015).
A ship’s bunkering Currently, LNG is a significantly less popular option than MGO and scrubbers.
Source: DNV-GL (2015). The reason for this is that LNG-fuelled ships require dedicated technology (e.g.
ship engines, special tanks and piping), which is costly in a short time perspective,
hence this solution is more viable for newbuilds than retrofitting. However, the
price gap between LNG compared to low sulphur fuels in favour of the former is
seen as a key advantage, which is able to counterbalance the higher investment
costs of LNG retrofitting or the extra expenditures for newbuilds.
Judging by the market response and LNG’s multiple advantages, the coming years
will surely advance its development. The number of ships using LNG as fuel is
increasing at quite a fast pace. Before 2015, there were only four LNG-fuelled
ships in operation within the Baltic Sea, i.e. the dual-fuel ferry Viking Grace owned
by Viking Line (the first ship to be powered by LNG on a regular basis) and two
LNG-powered (gas-only engine) cruise ferries of the Fjord Line operator. At the
end of 2015 there were 27 LNG-fuelled vessels (24 newbuilds, 3 conversion
projects) plying the waters of the European SECA (primarily Norwegian waters).
The LNG alternative is gaining popularity – looking only at the total orderbook for
16The Baltic Sea as a model region for green ports and maritime transport
ships dedicated for the European SECA region (delivery date up to 2018) there
are 40 vessels on order, 21 of which are powered by LNG and 7 are equipped
with scrubbers (DNV, 2015).
2% Norway domestic – North Sea
1%
1% or between North Sea and
Norwegian Sea
North Sea – international
4%
14% Norwegian Sea – North Sea
(international)
Number of ships operating in each region
Baltic Sea – international
of the European SECAs. 5%
SECA – one year after entry into force, Denmark domestic – Baltic Sea
BPO Report, 2016. German domestic – North Sea
Specialised infrastructure for bunkering purposes is necessary to allow the grow-
ing number of LNG-fuelled ships to operate; therefore, ports of all scales should
engage in establishing LNG bunkering facilities.
14
4
Number of ships powered by LNG oper- 33
2
ating in the European SECAs. 1
SECA – one year after entry into force,
BPO Report, 2016.
The development of LNG bunkering infrastructure within the Baltic Sea Region was
initiated by the Baltic Port Organization (“LNG in Baltic Sea Ports” and “LNG in
Baltic Sea Ports II” projects ) in order to harmonize the pre-investment works on
the creation of a network of ports using a standardized LNG system. As a matter
of fact, this is in line with EU Directive 2014/94/EU introducing an obligation for
TEN-T core seaports to be equipped with publicly accessible LNG refueling points
for maritime transport by 2025.
The infrastructure for LNG bunkering within the Baltic ports is gradually being
put in place, thanks to the accompanying technical and safety impediments being
addressed and eliminated. Terminals willing to feed vessels with LNG will need
the necessary bunkering upgrades, utilising one of the available methods (e.g. ship
to ship, tank truck to ship). The Port of Stockholm became the first port in the
Baltic Sea Region (and one of the first in the world) to offer LNG bunkering solu-
tions (bunkering boat), supplying the above-mentioned cruise ferry Viking Grace.
Other terminal infrastructure includes: Floating Storage and Regasification Unit Inde-
pendence in the Lithuanian Port of Klaipeda and the land-based facilities in Lysekil
(Sweden), both put into service in 2014; a gas bunker station dedicated to Fjord
Line in the Port of Hirtshals (Denmark); small-scale LNG terminals in Nynäshamn
and Gothenburg (Sweden); and a large-scale LNG terminal in Świnoujście (Poland)
launched in 2015, which will also be prepared for ship bunkering.
17The Baltic Sea as a model region for green ports and maritime transport
Existing LNG infrastructure projects The Baltic Sea Region can be considered
in the BSR serve as a good example a benchmark for the implementation of
of LNG synergy between ports, ship- LNG infrastructure in other European
owners and other stakeholders, which ports.
is essential for LNG to become a com-
petitive alternative fuel. Thanks to the broad range of experiences gained during
phasing in of the LNG fuel in the shipping industry, the Baltic Sea Region can be
considered a benchmark for the implementation of LNG infrastructure in other
European ports. It is strongly believed that the use of LNG as a ship fuel will
become more and more widespread in the coming years.
on - shore power supply
On-shore Power Supply (OPS), also known as shore connection, shore side
electricity and cold ironing, is a solution based on connecting a ship to shore-side
electricity during its port stays, so that she may turn off auxiliary engines and stop
the consumption of fuel. The shore-side electricity technique has been known
for about 30 years; however, at the beginning only a low-voltage shore connec-
tion (380 V) was possible, notorious for poor ergonomics and high operating
costs. Contemporary solutions utilise a high-voltage shore connection (10,500 V),
which was offered for the first time in the world by the Port of Gothenburg and
disseminated worldwide.
Initial problems have been resolved and OPS technology is much more mature
and affordable now than it was a few years ago. The investment costs decreased
substantially due to the availability of prefabricated assemblies and system stand-
ardisation ever since the OPS has been governed by international standard IEC/
ISO/IEEE 80005-1. Directive 2014/94/EU on the Deployment of Alternative
Fuel Infrastructure adopted in March 2014 could stimulate further development
of OPS technology. It states that all ports, especially those of the TEN-T Core
Network, shall be equipped with shore power by the end of 2025, unless there
OPS Cavotec is no demand and/or the costs are disproportionate to the benefits, including
Source: Cavotec. environmental benefits.
The use of OPS allows a substantial reduction in emissions generated by ships
moored at ports. Moreover, noise and vibration accompanying the work of aux-
iliary engines are completely eliminated. It is of particular importance not only
for the crew and passengers but also for the port’s neighbouring population, as
a majority of the Baltic ports are in-city ports, located close to residential areas
(e.g. Stockholm, Ystad, and Gdynia).
OPS requires adaptation and suitable equipment (e.g. frequency converters) not
only in the port but also on-board the ship. That is why the cooperation of both
is necessary.
The ports of Gothenburg, Lübeck, Helsinki, Ystad, and Stockholm have already
been providing OPS for a couple of years. Gothenburg pioneered the high-voltage
OPS, Helsinki introduced shore power in 2012 for Viking Line’s ferries, the Port
of Ystad has the world’s largest OPS system for both 50 Hz and 60 Hz, while
Stockholm’s port will have all of its five new quays equipped with the OPS system
by the end of 2016.
Ever since the OPS was put into use, the air quality in port areas has improved
considerably and the noise level has been reduced. However, the overall pollu-
tion level depends on the source of energy used by the OPS – preferably it should
be cheap energy from renewable sources.
18The Baltic Sea as a model region for green ports and maritime transport
port reception facilities for sewage
The availability of adequate port recep- Ever since the OPS has been put in use,
tion facilities (PRF) in the BSR is crucial the air quality in port areas has improved
for implementing the MARPOL special considerably and the noise level has been
area for sewage from passenger ships. reduced.
The status of PRF for sewage and their
use in the Baltic Sea area in 2014, with a focus on international cruise traffic, is
elaborated in a HELCOM report (2015b). Nordic ports are committed to cham-
pioning this issue.
According to this report, the PRF for sewage in Baltic ports develops at differ-
ent paces. The five biggest Baltic cruise ports (St. Petersburg, Helsinki, Tallinn,
Copenhagen, Stockholm), which receive 80% of all sewage from cruise ships in
the Baltic, are fully prepared for new regulation. In all of Helsinki’s three ports
(West Harbour, South Harbour and Vuosaari cargo port) grey and black water
may be discharged from the vessels directly to the city’s wastewater system. Fixed
reception points connected to the public sewage system are also available in Tal-
linn. Moreover, the port authority is planning to construct a microtunnel to receive
sewage at rates up to 1000m3/h and to connect it to the deep collector of the
public sewage company. The Port of Stockholm has recently upgraded the PRF in
Stadsgården/Masthamnen to increase the capacity of the facilities for ro-ro/ro-pax
but also cruise vessels. Fixed reception points for black and grey water are avail-
able at all piers used by cruise ships. In Copenhagen sewage from the cruise liners
is now handled at the terminal in permanent facilities that are linked to a sewage
treatment plant in Copenhagen.
Other BSR ports are on the way to making improvements. For example, the Port
of Gdynia is going to be ready before 1 January 2019. PRFs will be available on the
French Quay for cruises with a maximum intake rate of 200 m3/h and on the Polish
Quay for the new ferry terminal with a maximum volume flow rate of 105 m3/h.
rewarding eco - performance
Reducing emissions from shipping can also be achieved through awareness crea-
tion and economic incentives. Even if the ports do not invest themselves, they
can foster environmentally-friendly initiatives by rewarding port users (shipown-
ers and tenants) for their good eco-performance, especially when it exceeds the
legal requirements. Many Baltic ports have chosen this option even though it is
completely voluntary.
The most widespread approach is the incentive of environmentally differentiated port
dues. Its main idea is granting a financial discount/reward to shipowners that meet
the criteria defined by a port with regard to air emissions. Some of the Baltic ports
encouraged shipowners to use low sulphur fuels even before the strict regulation
came into force. For example, such a system of differentiated port dues has been
used in Swedish ports since 1998 in order to reduce emissions of SOx and NOx.
The principles of incentive schemes vary between ports. Usually they are based
on a ship’s gross tonnage or are set as a lump sum, irrespective of a ship’s param-
eters, payable per every ship call or per specified time period. Different criteria
are also used as a benchmark in eco-incentive programs e.g. emission level, fuel
used, technology (OPS) or eco-certificates such as Environmental Ship Index
(ESI), Green Award Certificate or Clean Ship Certificate. They also differ in
scope – some are directed at particular pollutants and others at a wide range of
19You can also read