The Hawaiian Volcano Observatory-A Natural Laboratory for Studying Basaltic Volcanism
←
→
Page content transcription
If your browser does not render page correctly, please read the page content below
Characteristics of Hawaiian Volcanoes
                                                            Editors: Michael P. Poland, Taeko Jane Takahashi, and Claire M. Landowski
                                                            U.S. Geological Survey Professional Paper 1801, 2014

Chapter 1

The Hawaiian Volcano Observatory—A Natural Laboratory
for Studying Basaltic Volcanism
By Robert I. Tilling1, James P. Kauahikaua1, Steven R. Brantley1, and Christina A. Neal1

     A volcano observatory must see or measure the                    This chapter summarizes HVO’s history and some of
     whole volcano inside and out with all of science to        the scientific achievements made possible by this permanent
     help.                                                      observatory over the past century as it grew from a small
     		                 —Thomas A. Jaggar, Jr. (1941)           wooden structure with only a small staff and few instruments
                                                                to a modern, well-staffed, world-class facility with state-of-
Abstract                                                        the-art monitoring networks that constantly track volcanic
                                                                and earthquake activity. The many successes of HVO, from
     In the beginning of the 20th century, geologist Thomas     improving basic knowledge about basaltic volcanism to
A. Jaggar, Jr., argued that, to fully understand volcanic and   providing hands-on experience and training for hundreds of
associated hazards, the expeditionary mode of studying          scientists and students and serving as the testing ground for
eruptions only after they occurred was inadequate. Instead,     new instruments and technologies, stem directly from the
he fervently advocated the use of permanent observatories       acquisition, integration, and analysis of multiple datasets
to record and measure volcanic phenomena—at and below           that span many decades of observations of frequent eruptive
the surface—before, during, and after eruptions to obtain       activity. HVO’s history of the compilation, interpretation,
the basic scientific information needed to protect people       and communication of long-term volcano monitoring and
and property from volcanic hazards. With the crucial            eruption data (for instance, seismic, geodetic, and petrologic-
early help of American volcanologist Frank Alvord Perret        geochemical data and detailed eruption chronologies) is
and the Hawaiian business community, the Hawaiian               perhaps unparalleled in the world community of volcano
Volcano Observatory (HVO) was established in 1912, and          observatories. The discussion and conclusions drawn in
Jaggar’s vision became reality. From its inception, HVO’s       this chapter, which emphasize developments since the 75th
mission has centered on several goals: (1) measuring and        anniversary of HVO in 1987, are general and retrospective
documenting the seismic, eruptive, and geodetic processes       and are intended to provide context for the more detailed,
of active Hawaiian volcanoes (principally Kīlauea and           topically focused chapters of this volume.
Mauna Loa); (2) geological mapping and dating of deposits
to reconstruct volcanic histories, understand island
evolution, and determine eruptive frequencies and volcanic
hazards; (3) systematically collecting eruptive products,       Introduction
including gases, for laboratory analysis; and (4) widely
disseminating observatory-acquired data and analysis,                The eruption of Vesuvius in 79 C.E. prompted the first
reports, and hazard warnings to the global scientific           scientific expedition (by Pliny the Elder) to study volcanic
community, emergency-management authorities, news               phenomena, as well as the first written eyewitness account
media, and the public. The long-term focus on these goals       (by Pliny the Younger) of eruptive activity (Sigurdsson,
by HVO scientists, in collaboration with investigators from     2000). The new science of geology emerged in the 19th
many other organizations, continues to fulfill Jaggar’s         century, focusing on the deduction of past events from
career-long vision of reducing risks from volcanic and          current Earth exposures—“the present is the key to the past.”
earthquake hazards across the globe.                            This approach was also used for studying active geologic
                                                                processes like volcanic eruptions: scientific studies of
                                                                volcanoes were conducted during short-lived expeditions,
 1
  U.S. Geological Survey.                                       generally undertaken in response to major eruptions (for
2  Characteristics of Hawaiian Volcanoes

instance, the 1815 Tambora and 1883 Krakatau eruptions in           references cited therein) provide an invaluable database for
Indonesia) and done substantially after the event was over.         understanding Hawaiian volcanism. It is beyond the scope
Three large explosive eruptions in the Caribbean-Central            of this volume to synthesize fully the abundance of scientific
American region in 1902—La Soufrière (Saint Vincent,                data, new interpretations, and insights that have accrued
West Indies), Montagne Pelée (Martinique, West Indies), and         in the quarter century since that publication. Instead, the
Santa María (Guatemala)—claimed more than 36,000 lives              papers in this current volume are retrospective and focus
and showed the inadequacy of the deductive approach for             on volcano monitoring and selected topical studies that
protecting people and property from natural disasters. These        refine and extend our ideas about how Hawaiian volcanoes
catastrophic eruptions in the early 20th century set the stage      work. Efforts summarized here have been led primarily by
for the emergence of the science of volcanology as we know          HVO researchers and other USGS scientists but were often
it today.                                                           completed in close collaboration with non-USGS colleagues
      Dr. Thomas Augustus Jaggar, Jr., a 31-year-old                from government, academic, and international institutions.
geology instructor at Harvard University (and also a part-          Much of HVO’s contribution to science since 1987 has been
time employee of the U.S. Geological Survey [USGS]),                the direct result of monitoring the continuing eruption of
was a member of the scientific expedition sent by the               Kīlauea Volcano.
U.S. Government to investigate the volcanic disasters at                  Specifically, this introductory chapter provides
La Soufrière and Montagne Pelée in 1902. High-speed,                historical context for the subsequent chapters, which
incandescent pyroclastic flows (nuées ardentes) from                encompass these themes: the key role of permanent seismic
Montagne Pelée obliterated the city of St. Pierre and killed        and other geophysical networks in volcano monitoring
29,000 people in minutes, making it the deadliest eruption          (Okubo and others, chap. 2); evolution of oceanic shield
of the 20th century (Tanguy and others, 1998, table  1). The        volcanoes (Clague and Sherrod, chap. 3); flank stability
Pelée eruption’s power and deadly impacts left a profound           of Hawaiian volcanoes (Denlinger and Morgan, chap. 4);
impression on the young professor, and he decided to devote         magma supply, storage, and transport processes (Poland and
his career to studying active volcanoes (Apple, 1987). A            others, chap. 5); petrologic insights into basaltic volcanism
half-century later, Jaggar reflected in his autobiography:          (Helz and others, chap.  6); chemistry of volatiles and gas
“As I look back on the Martinique expedition, I know                emissions (Sutton and Elias, chap. 7); dynamics of Hawaiian
what a crucial point in my life it was. . . . I realized that the   eruptions (Mangan and others, chap. 8); effusive basaltic
killing of thousands of persons by subterranean machinery           eruptions (Cashman and Mangan, chap. 9); and natural
totally unknown to geologists and then unexplainable was            hazards associated with island volcanoes (Kauahikaua and
worthy of a life work” (Jaggar, 1956, p. 62). In reaching his       Tilling, chap. 10). Interpretations provided by these topical
life-changing decision, Jaggar was swayed by his strong             studies are derived from, and constrained by, long-term
conviction that the expeditionary approach in studying              data—visual, geophysical, and petrologic-geochemical—on
volcanoes was inadequate. Instead, he firmly believed that,         the eruptive processes and products of Kīlauea and Mauna
to understand volcanoes fully and to mitigate effectively the       Loa obtained by HVO over many decades. The papers in
impacts of their hazards, it is necessary to study and observe      this volume, we believe, reflect current HVO science and
them continuously—before, during, and after eruptions. After        reinforce Jaggar’s vision that reduction of volcano risk
meeting the renowned American volcanologist Frank Alvord            requires the integration of systematic monitoring data
Perret, who was already using this approach at Vesuvius in          and related research, comprehensive hazards assessments
1906, Jaggar became even more convinced about advocating            based on past and current eruptive activity, and effective
for the establishment of permanent Earth observatories. While       communication of hazards information to authorities and
at Harvard, and later as a professor at the Massachusetts           the potentially affected populace. Thanks to the progress in
Institute of Technology (MIT), Jaggar pursued his life’s goal       the past 100 years, we now have many more scientific tools
to establish a permanent observatory at some place in the           than were available in the early 20th century to improve our
world to study volcanoes and earthquakes (see “Founding of          understanding of volcanic phenomena. Clearly, the legacy of
the Hawaiian Volcano Observatory” section, below).                  Thomas Jaggar is alive and well.
                                                                          The history of HVO is, in many ways, the history of
Scope and Purpose of This Chapter                                   basaltic volcanology. It is almost impossible to separate
                                                                    contributions by HVO and USGS scientists and student
     In 1987, to commemorate the 75th anniversary of the            volunteers from those of our partners in academia and other
founding of HVO, the U.S. Geological Survey published               institutions, but we chose to focus on the big ideas that came
Professional Paper 1350 (Decker and others, 1987). This             from work on Kīlauea that predominantly involved scientists
two-volume work still stands as the most comprehensive              and students from HVO and other USGS groups. The future of
compilation of the many studies on Hawaiian volcanism               systematic scientific studies of Hawaiian volcanoes relies now,
by USGS and other scientists through the mid-1980s. The             as during the past century, on continued government-academic
62 papers contained in Professional Paper 1350 (and the             and scientist-student partnerships.
The Hawaiian Volcano Observatory—A Natural Laboratory for Studying Basaltic Volcanism  3

Founding of the Hawaiian Volcano                                           (Jaggar, 1910). During his return layover, Jaggar spoke to the
                                                                           Honolulu Chamber of Commerce about the unique possibilities
Observatory                                                                for science afforded by the establishment of an observatory
                                                                           at the edge of Kīlauea Volcano. Lorrin Thurston, a well-
     After his work at Montagne Pelée in the Caribbean and                 connected businessman and political figure, also spoke to the
Vesuvius in Italy, Thomas Jaggar led a scientific expedition,              Chamber about the “purely commercial advantages of securing
funded by Boston businessmen, to various volcanoes in the                  for Kilauea such an observatory. . . . From a purely business
Aleutian Islands of Alaska in 1907. There, he witnessed the                point of view it would pay Hawaii to subscribe the funds
reactivation of Bogoslof volcano rising out of the sea but                 necessary for the maintenance of the observatory, irrespective
bemoaned the loss of data on the continuing eruption after the             of the great scientific benefit to accrue.” Jaggar asked for a
expedition had returned to the United States:                              commitment of $5,000 per year to locate an observatory at
                                                                           Kīlauea but received a promise of only half that amount before
     The remarkable processes of volcanism and earth
                                                                           he left for Boston (Hawaiian Gazette, 1909). With this partial
     movement in the Aleutian Islands deserve continu-
                                                                           encouragement, Jaggar redoubled his efforts back in Boston
     ous, close study from an observatory erected for the
                                                                           to seek financial supporters—in New England as well as in
     purpose on Unalaska. The winter of 1907–8 has been
                                                                           Hawai‘i—to build the observatory, including the facilities to
     wasted—lost to science, because no observers were
                                                                           house instruments and records, a laboratory, and offices.
     stationed there. (Jaggar, 1908, p. 400).
                                                                                 Jaggar and his associates were able to raise funds during
       The Messina earthquake, later in 1908, added to the human           1909–11 in Boston to purchase seismometers and temperature-
toll from natural disasters that Jaggar summarized as “100                 measuring instruments, to support initial field studies at
persons a day since January 1, 1901” (Jaggar, 1909). In his 1909           Kīlauea, and to construct a temporary small frame building
publication about the earthquake, Jaggar put forth his master plan         (the “Technology Station”) on the rim of Halema‘uma‘u
for 10 small observatories in “New York, Porto Rico [sic], Canal           Crater (fig. 1A) for observations of the continuous lava-lake
Zone, San Francisco, Alaska, Aleutian Islands, Philippines, Hawaii,        activity. Neither Jaggar nor any other MIT scientists were
Scotland, and Sicily.” The overall cost would be a $4.2 million            able to travel to Hawai‘i during 1910–11, however, and so
endowment that would continue support for each observatory with            the earliest observations and studies at Kīlauea fell to E.S.
$10,000 per year (Jaggar, 1909). The goals of these observatories          Shepherd (Geophysical Laboratory of the Carnegie Institution of
were simple: (1) prediction of earthquakes, (2) prediction of              Washington, D.C.) and Frank A. Perret (Apple, 1987). Doubtless,
volcanic eruptions, and (3) earthquake-proof engineering and               Jaggar worried that his delay would be during a critical time
construction in volcanic and seismic lands (Jaggar, 1909).                 in the nascent observatory; thus, he wisely enlisted Perret—a
       He also expressed deep admiration for the efforts of the            prominent, volcano-savvy scientist already well known for
Japanese in establishing geophysical monitoring (“. . . their              his work at Vesuvius, Etna, and Stromboli volcanoes—to be
island empire is girdled with observatories”) and spent 5                  his proxy. Jaggar considered Perret to be “the world’s greatest
weeks in Japan in 1909 with layovers in Honolulu both ways                 volcanologist” (Jaggar, 1956, p. xi).

A                                                                          B

Figure 1. Photographs showing facilities of the Hawaiian Volcano Observatory (HVO) through the years. A, The “Technology Station” (circled)
on the eastern rim of Halema‘uma‘u Crater, built by Frank A. Perret in 1911, was the first, though temporary, of a number of buildings that HVO has
occupied since its founding (USGS photograph by Frank A. Perret). B, Aerial view of present-day HVO and Jaggar Museum (lower left corner) on the
northwestern rim of the summit caldera of Kīlauea Volcano, with plume rising from vent in Halema‘uma‘u Crater. This vent opened in mid-March 2008
and has remained active through mid-2014 (USGS photograph taken in September 2008 by Michael P. Poland).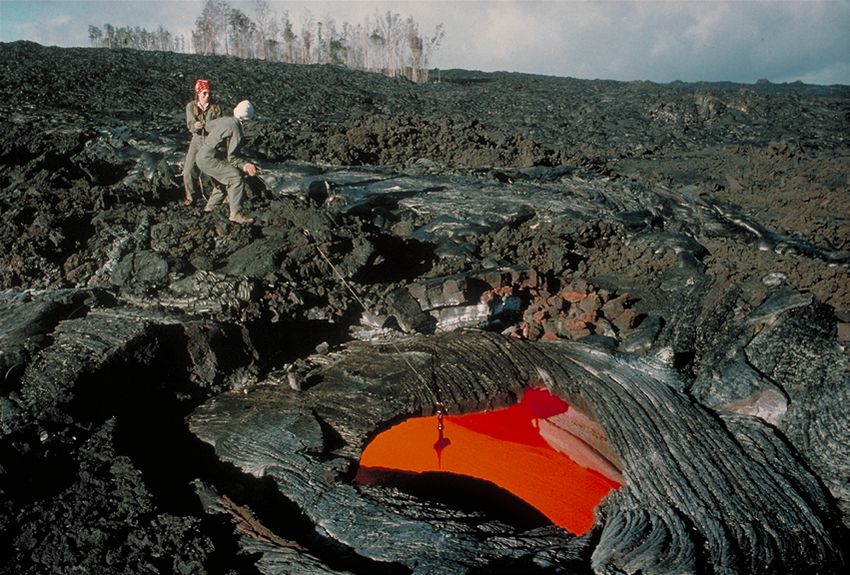
4  Characteristics of Hawaiian Volcanoes

      Under Jaggar’s direction, Perret built the Technology        Perret arrived to begin continuous observations, and July 1,
Station and conducted an experiment to measure the                 1912, when Jaggar received his first paycheck as HVO Director
temperature of Kīlauea’s active lava lake (see “Field              from the HVRA (Dvorak, 2011; Hawaiian Volcano Observatory
Measurements of Lava Temperature” section, below). He also         Staff, 2011). By mid-February 1912, construction was begun on
started nearly continuous observations and measurements of         what was to become the first of several permanent facilities of
the lava lake then within Halema‘uma‘u Crater. At Thurston’s       HVO, located near the present-day Volcano House Hotel on the
urging, he wrote weekly updates in The Pacific Commercial          northeastern rim of Kīlauea Caldera (Apple, 1987).
Advertiser (later The Honolulu Advertiser), which happened to
be owned by Thurston. In those updates, which began HVO’s
long tradition of regular scientific communications and public     Why in Hawai‘i?
outreach (see “Communication of Scientific Information and
Public Outreach” section, below), Perret listed himself as              To fully appreciate Jaggar’s accomplishment in
“Director pro tem” of the Technology Station, the first building   establishing HVO, we first must look back in time to the early
of the not yet formally established observatory. In the summer     20th century. Before 1912, only three volcano observatories
of 1911, Perret’s work, as summarized weekly in Thurston’s         existed in the world: (1) the Vesuvius Observatory (Reale
newspaper, greatly impressed and excited Thurston’s group of       Osservatorio Vesuviano [now a museum] on the flank of
Honolulu financial backers, prompting the group—formally           Vesuvius volcano in Italy), whose construction was completed
organized on October 5, 1911, as the “Hawaiian Volcano             in 1848; (2) the fledgling observatory established in mid-
Research Association” (HVRA)—to renew their pledge of              1903 on the island of Martinique by the French in response
financial support for the permanent observatory at Kīlauea.        to continuing eruptive activity at Montagne Pelée; and (3)
Perret’s achievements thus provided a solid financial, as well     the Asama Volcano Observatory, Japan, established in 1911
as scientific, base upon which Jaggar soon built the formal        (Suwa, 1980) by the renowned seismologist Fusakichi Omori,
observatory. HVRA’s funds, however, did not directly support       who later became a close colleague and friend of Jaggar.
HVO’s effort until mid-1912, when the 5-year contract                   Given Hawai‘i’s geographic isolation in the middle of
between HVRA and MIT became official (Dvorak, 2011).               the Pacific Ocean, what prompted Jaggar to build a volcano
      In January 1912, Jaggar (fig. 2) arrived to resume the       observatory at Kīlauea rather than pursuing his scientific
continuous observations begun by Perret and to start erecting an   studies at one of the three existing observatories? Jaggar
observatory building with financial and material donations from    (1912, p. 2) had a number of compelling scientific, as well as
Hilo businesses. The year 1912 has long been recognized as when    practical, reasons, including these: (1) Kīlaueaʼs location is in
HVO was founded. Though there was no formal ceremony or            “American” territory rather than in a foreign land, “and these
event to mark its “official” establishment, 1912 has long been     volcanoes are famous . . . for their remarkably liquid lavas
recognized as the year when HVO was founded. In any case, the      and nearly continuous activity”; (2) at other volcanoes the
founding date must be some time between July 2, 1911, when         eruptions are more explosive and an observatory located close

                                                                                                    Figure 2. Photograph showing
                                                                                                    Thomas A. Jaggar, Jr., founder of
                                                                                                    the Hawaiian Volcano Observatory
                                                                                                    (HVO), tending to seismometers in
                                                                                                    1913 in the Whitney Laboratory of
                                                                                                    Seismology (photograph courtesy
                                                                                                    of the Bishop Museum, Honolulu).
                                                                                                    Inset (upper left corner) shows
                                                                                                    portrait photograph of Jaggar in
                                                                                                    1916 (USGS/HVO photograph).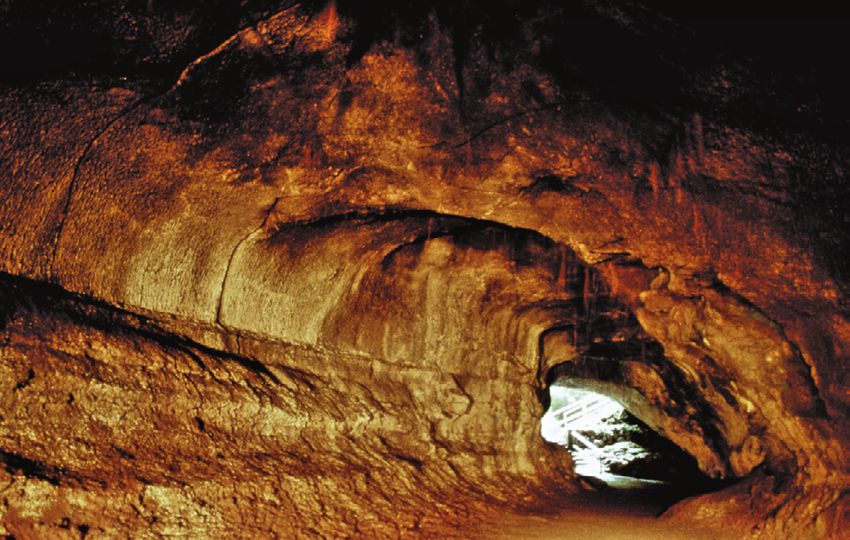
The Hawaiian Volcano Observatory—A Natural Laboratory for Studying Basaltic Volcanism  5

enough to the center of activity is in some danger. Kīlauea,            seismic phenomena and their associated hazards. HVO’s studies
while displaying great and varied activity, is relatively safe; (3)     of earthquake, volcanic, and tsunami hazards and associated
earthquakes are frequent and easily studied; and (4) “Kilauea           mitigation strategies, with some case histories, are treated in the
is very accessible,” only 50 km by road from Hilo harbor,               chapter by Kauahikaua and Tilling (this volume, chap. 10).
which, in turn, is only a one-day sail from Honolulu (the most
developed city in the Territory of Hawaii). Jaggar obviously
believed that these reasons more than compensated for the               Post-Jaggar History of HVO
disadvantages of Hawai‘i’s geographic remoteness.
                                                                               Jaggar served as HVO director through periods when the
     For Jaggar, another important motivation for locating
                                                                        observatory was administered by the Weather Bureau (1919–24),
an observatory in Hawai‘i was the powerful support from
                                                                        the U.S. Geological Survey (1924–35), and the National Park
Thurston, who was well connected financially and was keen to
                                                                        Service until his retirement in 1940. In 1947, administration
promote Kīlauea as a tourist attraction. At the time, the volcano
                                                                        of HVO permanently returned to the U.S. Geological Survey
was already an emerging tourist destination, and Thurston
                                                                        and, in 1948, the HVO operation was relocated to its present
was the major stockholder of the Volcano House Hotel on the
                                                                        site at Uēkahuna Bluff on the caldera’s northwestern rim
rim of Kīlauea Caldera and the owner of the train from Hilo
                                                                        (fig. 1B); its facilities were gradually expanded with addition
to the volcano. Thurston’s role as a tourism promoter is aptly
                                                                        of a geochemistry wing in the early 1960s and the construction
described by Dvorak (2011, p. 35):
                                                                        in 1985–86 of a much larger adjoining building with a viewing
     His grand plan was to make Kilauea one of the                      tower. For detailed accounts of the pivotal roles played by
     scheduled stops for the increasingly numerous                      Jaggar, Perret, Thurston, and the HVRA in the founding of HVO
     passenger ships crossing the Pacific. If someone                   and of the observatory’s early history, see Macdonald (1953a),
     wanted to see the lava lake, that person had to ride               Apple (1987), Barnard (1991), Hawaiian Volcano Observatory
     his train; if anyone wanted to stay overnight, his hotel           Staff (2011), Dvorak (2011), Kauahikaua and Poland (2012), and
     would provide the only available accommodations.                   Babb and others (2011).
       Indeed, according to Allen (2004, p. 196), “Lorrin A.
Thurston created the foundation for Hawaii tourism.”
Conceivably, funds raised by the HVRA to support HVO were               Developing, Testing, and Using Volcano-
given more for the promise of tourism enhancement, rather than          Monitoring Techniques
for stated reasons of scientific advancement or reduction of risk.
This notion, while not explicitly documented, may explain the                 Since the growth and spread of volcano surveillance
final phrase of one of Jaggar’s major goals for HVO (Jaggar,            throughout the world, experience clearly has shown that
1913, p. 4): “Keep and publish careful records, invite the whole        seismic and geodetic monitoring techniques are the most
world of science to co-operate, and interest the business man”          diagnostic and useful tools to detect eruption precursors
[italics in original]. A skillful promoter himself, Jaggar thus         (Tilling, 1995; Scarpa and Tilling, 1996; McNutt, 2000;
successfully merged his scientific interests with the more              McNutt and others, 2000; Dzurisin, 2007; Segall, 2010).
commercial interests of the Honolulu businessmen.                       By the early 20th century, the common association between
      Reflecting on the founding of HVO decades later, Jaggar           premonitory seismicity and ground deformation had been
comments in his book Volcanoes Declare War (1945, p. 148):              documented (for example, Omori, 1913, 1914; Wood, 1913,
          It is appropriate that Honolulu should have been              1915). As a specific example, after summarizing seismic and
     the American community to establish first a volcano                ground-tilt behavior at Kīlauea, The Volcano Letter of August
     observatory. We are in the midst of the greatest                   14, 1930, states (Powers, 1930, p. 3),
     ocean, surrounded by earthquakes and volcano lands.                     The conclusion drawn from all this evidence is that
     The place is like a central fire station, and there is                  lava pressure is increasing under Halemaumau. It is
     some appeal to the imagination in possessing a world                    impossible to say whether or not this will result
     fire alarm center.                                                      in an eruption, [bold in original] but it can be said
       After alluding to several “disasters” (volcanic and                   confidently that conditions look more favorable now
earthquake) in the circum-Pacific regions, he states that these              than at any time in the past several months.
disasters “and a hundred others constitute an endless warfare, and            On November 11, 1930, an 18-day eruption began in
what more fitting center for mobilization against it than the natural   Halema‘uma‘u.
laboratory of the Island of Hawaii?” Jaggar clearly envisioned an             Throughout the 20th century, HVO has served as a
observatory as needing to employ multiple scientific approaches         developing and testing ground for volcano-monitoring instruments
and all available and emerging technologies in its studies. With        and techniques, many of which have been further adapted for
its frequent eruptions, earthquakes, and tsunamis, the Island           use at other volcanoes worldwide. In recent decades, advanced
of Hawai‘i was the perfect locale for conducting continuous             satellite-based volcano-monitoring techniques—Global Positioning
scientific observation to more fully understand eruptive and            System (GPS), interferometric synthetic aperture radar (InSAR),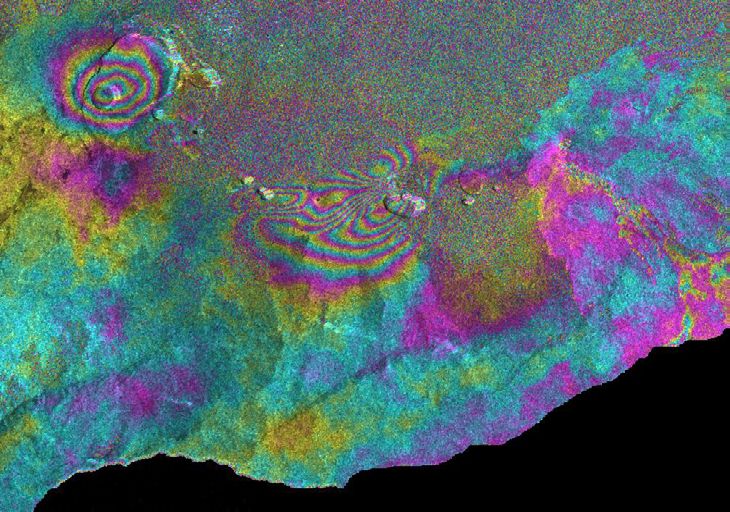
6  Characteristics of Hawaiian Volcanoes

and thermal imaging—have been successfully applied at Kīlauea         at Kīlauea within a few years (Wright, 1989; Klein and Wright,
and Mauna Loa, providing much more complete spatial and               2000; Okubo and others, this volume, chap. 2). Signals from six
temporal time series of deformation patterns and lava-flow            seismometers were transmitted to the observatory via overland
inundation than ever before. The data collected by HVO’s long-        cables and recorded on smoke-drum seismographs. Data from
term ground-based monitoring program, however, have proved            this rudimentary network, combined with a crustal-velocity
to be invaluable for checking and validating the results obtained     structure model also developed by Eaton, made possible routine
from space-age monitoring techniques. In summarizing HVO              determination of earthquake locations and magnitudes; Eaton’s
deformation studies and techniques employed during 1913–2006,         modernization of the network enabled HVO to produce catalogs
Decker and others (2008, p. 1–2) emphasized that “Many of             of reliably located earthquakes by the 1960s (Wright, 1989).
the techniques are complementary; for example, using GPS and          Equally important, Eaton’s seismic network in Hawai‘i served as
satellite measurements of benchmark positions provides ‘ground        a prototype upon which a number of “modern” networks in other
truth’ for InSAR (satellite radar interferometry) maps.” Below, we    regions (for example, California) were based.
offer some examples of developments in instrumental and volcano-             With expanded coverage, more sensitive instruments, and
monitoring techniques during HVO’s history.                           a more accurate seismic velocity model, the quality of the data
                                                                      catalog improved. By 1974, the HVO seismic network had
                                                                      grown to 34 seismic stations, and by 1979 all seismic data were
Seismic Monitoring                                                    processed by computer (Klein and others, 1987). The availability
                                                                      of high-quality data from the modern seismic network made it
      The use of seismic waves to detect unrest at volcanoes
                                                                      possible to extend the catalog of Hawaiian earthquakes back in
began in the mid-19th century. A Palmieri (electromagnetic)
                                                                      time by estimating locations and magnitudes of reported historical
seismograph at the Vesuvius Observatory detected precursory
                                                                      events (Wyss and Koyanagi, 1992; Klein and Wright, 2000). The
seismic activity before the 1861, 1868, and 1872 eruptions at
                                                                      first digital seismometers were installed at Kīlauea as part of a
Mount Vesuvius (Giudicepietro and others, 2010). The first
                                                                      joint United States-Japan seismic experiment in 1996 (McNutt
seismometer in Hawai‘i was installed on O‘ahu in 1899 (Klein
                                                                      and others, 1997); about 10 broadband seismometers remained
and Wright, 2000), and instrumental recording of earthquakes on
                                                                      operational at Kīlauea summit after the experiment but were
the Island of Hawai‘i was initiated with the completion in 1912
                                                                      not used in routine processing until 2007, when HVO’s data
of the Whitney Laboratory of Seismology (fig. 2)—a basement
                                                                      acquisition software was upgraded from Caltech-USGS Seismic
vault beneath HVO’s main building. The first seismometers
                                                                      Processing (CUSP) to Earthworm (Okubo and others, this volume,
at HVO were two instruments imported from Japan (shipped
                                                                      chap. 2). The American Recovery and Reinvestment Act funding
directly to Hawai‘i) and one from Germany (shipped from
                                                                      of 2009 allowed HVO to fully upgrade its seismic network with
Strasburg via Boston); some of these were modified later to
                                                                      more broadband seismometers and digital telemetry. As of this
better record volcanic seismicity at Kīlauea. The data from the
                                                                      writing (mid-2014), HVO’s seismic network (fig. 3A) is among the
seismographs that were collected in the HVO vault were flawed
                                                                      densest volcano-monitoring networks in the world, consisting of
for a variety of reasons (for instance, building vibrations, nearby
                                                                      57 stations over the five volcanoes of the island, 21 of which use
cultural noise, wide fluctuations in vault temperature) but still
                                                                      broadband digital instruments.
provided useful information (Apple, 1987; Klein and Wright,
                                                                             HVO’s seismic-monitoring data constitute an integral
2000). For example, these first instruments were sufficient in
                                                                      component in chronological narratives and interpretations
establishing that Hawaiian eruptions were preceded by increased
                                                                      of all Hawaiian eruptions since the first instrument became
seismicity and ground tilt changes (Wood, 1915).
      During the early decades of seismic monitoring, HVO             operational. Okubo and others (this volume, chap. 2) review,
                                                                      in detail, the evolution of HVO’s seismic monitoring
never operated more than five stations (two at Kīlauea’s summit,
                                                                      systems with time, highlighting the significant findings from
one at ~3,300 m elevation on the eastern flank of Mauna Loa,
                                                                      progressively improving data that sharpen our understanding
and two outlying ones in Kealakekua and Hilo). Moreover, these
                                                                      of how Hawaiian and other basaltic volcanoes work.
early instruments were heavy and unwieldy, had low sensitivity,
and lacked the capability to transmit data to the observatory.
It was not possible to determine accurate earthquake locations
because of the inadequate density of seismometers, imprecise          Geodetic Monitoring
timing mechanisms, and lack of direct data transmission.
Nonetheless, the early seismic recordings generally sufficed               It is now well demonstrated that the surfaces of active
to estimate relative intensity and distance to origin and to          volcanoes deform in response to inflation or deflation of
discriminate whether an earthquake was associated with Kīlauea,       subsurface magma reservoirs and hydrothermal systems (see,
Mauna Loa, or Hualālai or was a teleseism (Apple, 1987;               for example, Murray and others, 2000; Dzurisin, 2007). This
Wright, 1989; Wright and others, 1992a).                              phenomenon had been recognized but was poorly understood
      Seismic monitoring at HVO was upgraded substantially            in the early 20th century; however, from its beginning in
with the arrival in 1953 of seismologist Jerry P. Eaton, who          1912, HVO used geodetic measurements to track ground
introduced the smaller, more sensitive, electromagnetic               deformation. Decker and others (2008) provide a detailed
seismometer and established the first telemetered seismic network     account of the methodologies—including some developed,
The Hawaiian Volcano Observatory—A Natural Laboratory for Studying Basaltic Volcanism 7
adapted, or refined by HVO—that have been employed for inadvertent seismometric measurements well recorded the
deformation studies on active Hawaiian volcanoes. Drawing large tilt changes related to the 1924 explosive eruptions.
from this summary, we comment below on the historical Beginning in the 1950s, the quality of tilt measurements
importance of some of the early techniques and measurements improved greatly with use of permanent and portable water-
and then consider satellite-based geodesy. tube tiltmeters (Eaton, 1959) and by the installation in 1966
of a continuously recording mercury-capacitance tiltmeter
in the basement of HVO’s facilities on Uēkahuna Bluff (the
Tilt “Uēkahuna Vault”; Decker and others, 2008).
Additional continuously recording electronic tiltmeters,
The earliest tilt measurements were made after the
including electronic borehole tiltmeters, were later installed
discovery that the seismographs in the basement of HVO’s
at Kīlauea and Mauna Loa (fig. 3C). Four analog borehole
first building (the “Whitney Vault”) were affected by
tiltmeters operating along the Kīlauea East Rift Zone
deflection (relative to the vault floor) of the horizontal
(ERZ) documented dike propagation and the onset of the
pendulums, apparently in response to deformation of
Pu‘u ‘Ō‘ō eruption in January 1983 (Okamura and others,
Kīlauea’s summit. The deflection-induced offsets on the
1988). The borehole tilt networks were expanded throughout
seismograms could be related to summit tilt (Apple, 1987).
the 1990s and into the 21st century, and during 2010–11,
“Thus, the Hawaiian Volcano Observatory . . . inadvertently
several advanced digital borehole tiltmeters were installed
began to record tilt continuously . . . from 1913 to 1963”
on Kīlauea and Mauna Loa (their broad frequency response
(Decker and others, 2008, p. 8). While crude, these
allows them to record low-frequency seismic tremor and
156° 155°30' 155° 156° 155°30' 155°
Figure 3. Maps and photograph showing
A B location of selected Hawaiian Volcano
Kohala
Kohala Observatory (HVO) geophysical monitoring
stations and level lines on the Island of Hawai‘i as
20° of 2012. A, Seismic stations. B, Borehole tilt and
Mauna Kea scalar strain measurement stations. C, Global
Mauna Kea Positioning System (GPS) network. D, Level
Hualālai Hualālai
lines. E, An HVO technician servicing one of the
monitoring stations (ALEP) on Mauna Loa, at
HVO Mauna which a seismometer and continuously recording
19°30' Mauna Loa
Kīlauea Kīlauea GPS are co-located (USGS photograph by Kevan
Loa
Kamibayashi). Parts A–D are modified from Tilling
and others (2010). Not all stations provide real-
time data to HVO; some are campaign sites (for
Tilt/strain network example, blue circles in B and C).
Electronic tiltmeter
19°
Seismic station
Tilt survey array
Strainmeter
E
C D
Kohala Kohala
20°
Mauna Kea Mauna Kea
Hualālai
Hualālai
Mauna
19°30' Mauna Loa
Loa Kīlauea Kīlauea
Level lines
GPS network
19°
Continuously recording site 0 20 KILOMETERS
Survey benchmark
0 10 MILES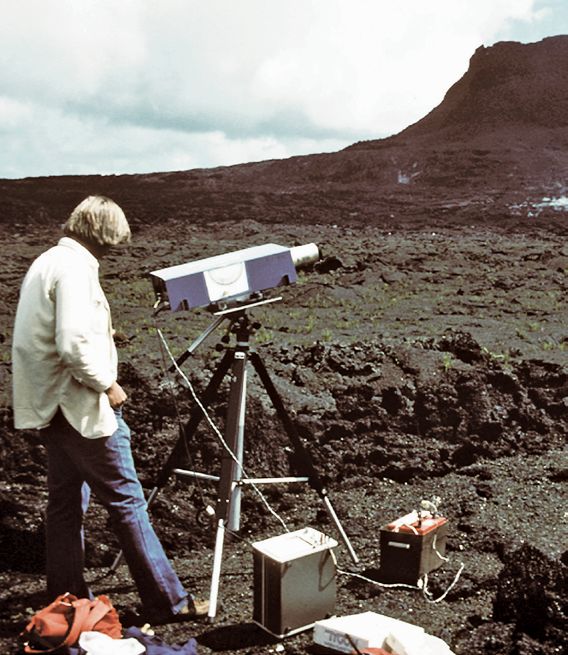
8  Characteristics of Hawaiian Volcanoes

teleseisms and blurs the line between seismic and geodetic             Satellite-Based Geodesy
monitoring). Tilt measurements at Kīlauea’s summit since
1912 (fig. 4) constitute the world’s longest duration and most               During the past quarter century, satellite-based techniques
comprehensive time-series dataset for such measurements.               (space geodesy) have increasingly been used to measure
                                                                       ground deformation related to a wide variety of dynamic
Electronic Distance Measurement (EDM)                                  earth processes, including fault movement/rupture and strain
                                                                       accumulation and release at volcanoes. To date, the two
      Among the world’s volcano observatories, HVO was a               techniques most widely used to detect and image deformation
pioneer in using theodolites, or electronic distance measurement       at active volcanoes are the Global Positioning System (GPS)
(EDM), to routinely measure horizontal displacements at                and interferometric synthetic aperture radar (InSAR). (For
deforming volcanoes, beginning in 1964 (Decker and others, 1966). good summaries of the principles and applications of these
A major advantage of EDM over traditional triangulation is the         techniques, see Dzurisin, 2007; Lu and Dzurisin, 2014.)
relative ease in measuring three sides of a triangle (“trilateration”)       Because repeat GPS measurements can yield both vertical
to yield precise determination of horizontal displacement vectors.     and horizontal displacements, the GPS technique quickly
Trilateration surveys in the 1970s and 1980s were HVO’s                became the geodetic-monitoring tool of choice at Hawaiian
mainstays for tracking horizontal distance changes related to          and other volcanoes. Beginning in 1996, in cooperation
eruptions, intrusions, and earthquakes (Decker and others, 1987,       with investigators at the University of Hawai‘i, Stanford
2008). HVO’s network of EDM benchmarks, later also used for            University, and other institutions, HVO established sites for
GPS monitoring (fig. 3D), grew significantly through the early         continuous GPS measurement on Kīlauea, Mauna Loa, and
1990s. EDM data also conclusively showed that Kīlauea’s south          Mauna Kea volcanoes. At present, HVO’s continuous GPS
flank was moving seaward several centimeters per year (see “Flank monitoring network consists of 60 receivers (fig. 3D). In the
Instability” section, below). The EDM technique is now used            21st century, the combination of continuous and campaign GPS
only for training purposes, to give students and scientists, mostly    measurement, together with conventional geodetic methods,
from developing countries, background about ground-deformation has provided greater time resolution for geodetic changes at
monitoring (see discussion in “Cooperative Research and Work           Hawaiian volcanoes unattainable in the previous century. The
with Other Organizations” section, below).                             comprehensive geodetic data now available make possible more

                        500

                        400

                        300

                        200
Tilt, in microradians

                                                                                                                             Uēkahuna E-W
                                      Whitney N-S
                        100

                          0
                                                                                                                             Uēkahuna N-S
                        -100
                                      Whitney E-W
                        -200

                        -300

                        -400
                               1920   1930          1940      1950          1960          1970          1980          1990          2000          2010
                                                                                Year

Figure 4. Graph showing fluctuations in summit tilt at Kīlauea Caldera during the period 1913–2011, as measured by the seismometric method in the
Whitney Vault and by water-tube tiltmeters at Uēkahuna (see text for discussion). Tilt readings in both north-south and east-west directions are shown.
The seismometric tilts have been converted to microradians (~0.00006 degree), the conventional measurement unit for tilt change. The seismometric
record is offset from the water-tube tiltmeter record because they pertain to different geographical sites at Kīlauea’s summit.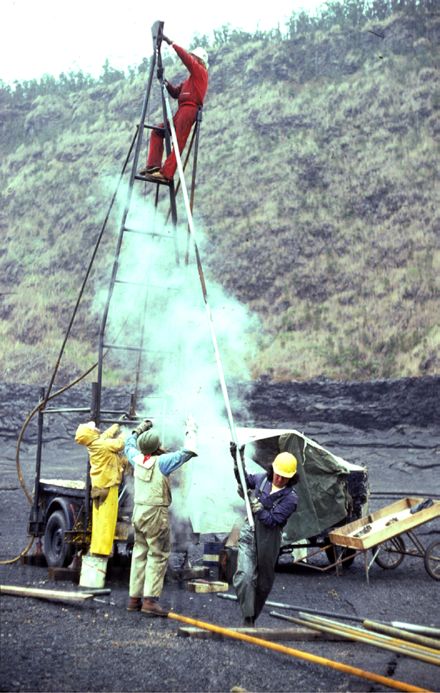
The Hawaiian Volcano Observatory—A Natural Laboratory for Studying Basaltic Volcanism  9

detailed and better constrained                          155°20'           155°15'            155°10'          155°05'                          155°                 154°55'
                                        19°30'
models of summit and rift zone
magma reservoir, transport, and                  A
eruption dynamics at Kīlauea and                                     Kīlauea
Mauna Loa (see, for example,                                         Caldera
Cervelli and Miklius, 2003; Miklius
                                        19°25'                                                                                                  e
and others, 2005; Poland and others,                                                                                                      Zon
2012; Wright and Klein, 2014;                                                                                            Rift
Poland and others, this volume,                                                                                 t
                                                                                                          Eas
chap. 5). Moreover, continuous GPS
measurements (fig. 5A) have made
possible real-time tracking of ground   19°20'

deformation associated with magma
movement, eruption dynamics, and
the motion of Kīlauea’s unstable
south flank (see “How Hawaiian
Volcanoes Work” section, below).        19°15'

      The potential of InSAR
in volcano monitoring was                                                                                                                           10    5   0 cm
first demonstrated by imaging
                                                                                                                    0                 5             10 KILOMETERS
the 1992–93 deflation at Etna
Volcano, Italy (Massonnet and           19°10'                                                                      0           2.5           5 MILES
others, 1995). This technique
is especially powerful in that it
captures deformation of the entire               B                             Kīlauea
radar-imaged ground area, rather                                               Caldera
than change at individual points,
as measured by other monitoring
techniques (for instance, GPS,                                                                                                    e
EDM, tilt, and leveling). InSAR                                                                                              Zon
                                                                                     Ea                                               Pu‘u ‘Ō‘ō
mapping was first tested at Kīlauea                                                      st             Rift
in 1994, but the interferograms
contained large errors because
of atmospheric effects related to
Hawai‘i’s tropical environment,                                                                                             Makaopuhi
resulting in ambiguous interpretation                                                                                        Crater
(Rosen and others, 1996). With
time, however, the InSAR technique
improved as atmospheric artifacts
                                                                                                                                 Range change, in cm
were more easily recognized and
new techniques developed to                                                                                             0                                     2.83
mitigate such artifacts. InSAR is                                                                                           0             2         4 KILOMETERS
now a versatile tool routinely used
                                                                                                                            0         1         2 MILES
for mapping volcano deformation
at Kīlauea (fig. 5B) and Mauna Loa
(for example, Amelung and others,
2007) and at volcanoes around the            Figure 5. Map and InSAR (interferometric synthetic aperature radar) image showing horizontal and
world (for example, Dzurisin and             vertical ground deformation at Kīlauea Volcano. A, An example of geodetic monitoring results using
Lu, 2007, and examples summarized            continuously recording Global Positioning System (GPS) receivers of the Hawaiian Volcano Observatory
                                             (HVO), Stanford University, and the University of Hawai‘i. Vectors indicate the horizontal displacements
therein). The development in 2007
                                             produced by magma intrusion into Kīlauea’s upper East Rift Zone and associated brief eruption during
of airborne InSAR (a radar pod               June 17–19, 2007. Station locations are at the tails of vectors, and circles indicate 95-percent confidence
attached to fixed-wing aircraft)             levels (modified by Asta Miklius from Montgomery-Brown and others, 2010, figure 3). B, An InSAR
eliminated constraints of orbit paths        interferogram, derived from a pair of satellite radar images acquired by the European Envisat satellite 35
and satellite repeat passage, thereby        days apart for the same event in 2007. The patterns of fringes indicate subsidence of Kīlauea Caldera
providing much greater flexibility           and a combination of uplift and subsidence near Makaopuhi Crater as magma from the summit reservoir
in the acquisition of data. Airborne         intruded into the East Rift Zone (image by Michael Poland, USGS).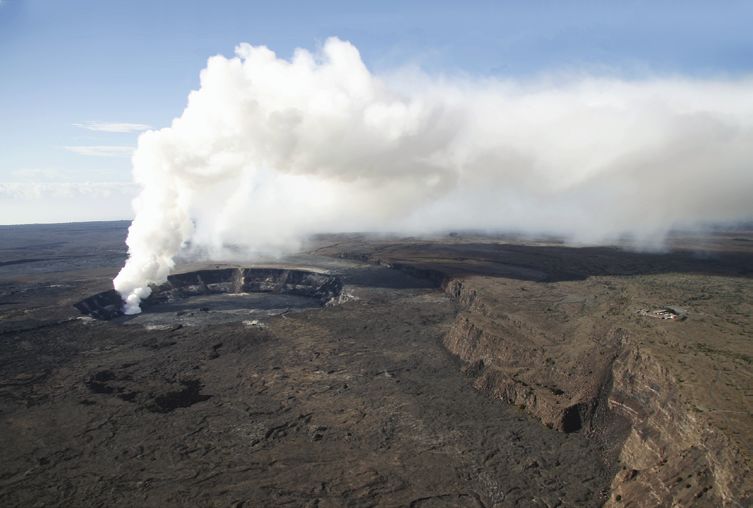
10  Characteristics of Hawaiian Volcanoes

InSAR data were collected in Hawai‘i in 2010 and 2011, and        temporal scales compared to any other geodetic monitoring
the results were invaluable in documenting subsurface dike        technique. For example, photographic measurements made
processes associated with the March 2011 Kamoamoa fissure         during 2011 at the Overlook vent within Halema‘uma‘u
eruption (Lundgren and others, 2013).                             and at Pu‘u ‘Ō‘ō crater showed that the lava lake levels
                                                                  varied sympathetically, indicating that an efficient hydraulic
                                                                  connection linked Kīlauea’s simultaneous summit and East Rift
Precise Gravity Monitoring                                        Zone eruptive activity (Orr and Patrick, 2012; Patrick and Orr,
                                                                  2012a). Significantly, these photographically documented lava
      Measuring changes in the acceleration of gravity,
                                                                  level changes “mirror trends in summit tilt and GPS line length”
coupled with precise leveling, is the only known way to
                                                                  (Patrick and Orr, 2012a, p. 66). Tilling (1987) previously
measure changes in subsurface mass associated with magma
                                                                  reported a similar correlation—but based on limited and
movement. The first reliable measurements of gravity changes
                                                                  imprecise data—between Kīlauea’s summit tilt and the levels
were made in the 1970s. Jachens and Eaton (1980) analyzed
                                                                  of active lava lakes at Mauna Ulu and ‘Alae. However, with
gravity data for Kīlauea summit stations measured before and
                                                                  acquisition of digital, high-resolution time-lapse photographic
after a major summit deflation produced by the November
                                                                  data now possible, detailed measurements of fluctuations in lava
29, 1975, earthquake and interpreted the results to indicate
                                                                  level can monitor localized changes in magma pressurization
a mass loss, probably from two sources in the south part of
                                                                  (inflation versus deflation) in the volcanic plumbing system
Kīlauea Caldera. Dzurisin and others (1980) exploited gravity
                                                                  feeding eruptive vents (Patrick and Orr, 2012a; Patrick and
measurements to conclude that the November 1975 earthquake
of magnitude (M) 7.2 (Tilling and others, 1976) created void      others, 2014, figs. 6, 7, and 9; Orr, 2014).
space in the summit area that completely filled with magma
over the subsequent months, thereby setting the stage for two
intrusions into the East Rift Zone in mid-1976.
                                                                  Volcanic Gas Monitoring
      Johnson (1992) interpreted gravity and leveling
                                                                        Sutton and Elias (this volume, chap. 7) summarize the
measurements at Kīlauea, specifically for the period 1984–86,
                                                                  history of volcanic gas studies at HVO during the past century.
and distinguished three variables that modulate deflation of
                                                                  Here, we present a few selected highlights.
the magma reservoir: volume and depth of magma transfer;
                                                                        Regular measurements of volcanic gases, especially
pressure and volume of CO2 gas; and spreading of the summit
                                                                  SO2 and CO2, became part of HVO’s monitoring program
area. Kauahikaua and Miklius (2003) interpreted gravity and
leveling trends from 1983 through 2002 in terms of mass-          in the late 1970s. Initially, monitoring of gas composition
storage changes of Kīlauea’s magma reservoir. Johnson and         was accomplished using direct sampling near eruptive vents
others (2010) examined measurements from late 1975 to             for gas chromatographic analysis at HVO (Greenland, 1984,
early 2008 over a broader network of measurement sites to         1987a, 1987b; and references therein). It was during this time
document the refilling of void space inferred by Dzurisin and     that remote-sensing techniques began to be used to monitor
others (1980) beneath the summit created by the 1975 M7.2         gas-emission rates—correlation spectrometry (COSPEC) for
earthquake (Tilling and others, 1976). In addition, Johnson and   SO2 and infrared spectrometry for CO2 (Casadevall and others,
others (2010) suggest the 2008 Kīlauea summit vent probably       1987). Since 1987, huge strides have been made in the field of
tapped the magma that had accumulated since 1975.                 remote-sensing measurements—ground-, plane-, and satellite-
      Continuous gravity measurements started in 2010             based—of volcanic gases (see, for instance, Carn and others,
at Uēkahuna Vault and on the caldera floor above the              2003; Nadeau and Williams-Jones, 2008; and Carn, 2011).
Halema‘uma‘u “Overlook vent” (as the 2008 summit eruptive         The COSPEC (fig. 6A) was the instrument used to make SO2
vent has been informally named), and in 2013 at Pu‘u ‘Ō‘ō         emission measurements at Kīlauea through September 2004,
(Michael Poland, oral commun., 2013). These data have             when—after a period of comparison and calibration with
already documented a previously unknown oscillation with a        newer instruments—it was replaced by a miniature ultraviolet
period of 150 s that is almost certainly not seismic in nature.   spectrometer (nicknamed FLYSPEC; fig. 6B), which is much
Carbone and Poland (2012) suggest that its origin may be          smaller and more portable (Elias and others, 2006; Horton
linked to convective processes within the shallow magma           and others, 2006). Another regular component of HVO’s
reservoir. In addition, gravity changes detected during abrupt    gas monitoring program uses the Fourier transform infrared
changes in lava level within the Overlook vent are consistent     (FTIR) spectrometer (McGee and Gerlach, 1998; McGee and
with the near-surface magma having a very low density,            others, 2005). The FTIR is capable of analyzing many other
compatible with a gas-rich foam (Carbone and others, 2013).       species of volcanic gases in addition to SO2 and CO2, thereby
                                                                  making possible estimates of the ratios of other gas species not
                                                                  directly measured by FLYSPEC.
Time-Lapse Photography                                                  Over the past two decades, near-real-time remote-sensing
                                                                  measurements of gas emission—of SO2 (regularly) and CO2
     Localized deformation of the ground surface can also be      (infrequently)—have become one of the primary tools, along with
captured in time-lapse photography at very fine spatial and       seismic and geophysical techniques, in HVO’s volcano-monitoring
The Hawaiian Volcano Observatory—A Natural Laboratory for Studying Basaltic Volcanism 11
program for Kīlauea and Mauna Loa (see, for example, Elias HVO’s increased gas-measuring capability allows for more
and others, 1998; Sutton and others, 2001, 2003; Elias and measurements (in different locations) to be made easily, and the
Sutton, 2002, 2007, 2012). Indeed, the time-series data for SO2 availability of long-term data now permits identification of possibly
emission rates at Kīlauea (fig. 7) acquired from 1979 to the present significant changes in emission rate (in other words, greater than
constitutes the longest duration dataset of its type for any volcano “background” variations) from long-measured sources. Beginning
in the world; CO2 emission measurements at Kīlauea were added to in 1983, the essentially continuous eruptive activity at Pu‘u ‘Ō‘ō-
the mix starting in 1995 and collected more frequently after 2004. Kupaianaha has been accompanied by relatively high rates of
Since 1958, atmospheric CO2 levels have been SO2 emission, fluctuating between 3,000 metric tons
continuously monitored by the National Oceanic and of SO2 per day (fig. 7A). This relatively high, nonstop rate of gas
Atmospheric Administration (NOAA) Mauna Loa Observatory emission at Kīlauea—from both the summit and the East Rift
(MLO) on the north slope of Mauna Loa (at 3,397 m elevation— Zone—has produced a persistent “vog” (volcanic smog) that poses
above the inversion layer). Estimates of volcanic CO2 emission a significant volcanic hazard for Hawai‘i residents and visitors
can be obtained from analysis of the “excess” amounts above (Sutton and others, 1997). This problem worsened with the onset
normal atmospheric levels captured during periods when wind of the 2008-present Halema‘uma‘u eruption at Kīlauea’s summit,
directions bring emissions from known volcanic sources to which greatly increased the SO2 emission rate (fig. 7B) from a
the sensors (Ryan, 1995, 2001). For a detailed discussion of second location (in addition to the East Rift Zone eruptive vents,
gas studies and their importance for HVO’s overall volcano- like Pu‘u ‘Ō‘ō), exacerbating vog conditions in more communities,
monitoring program, as well as the most recent developments, some much closer to the summit vent than Pu‘u ‘Ō‘ō (for detailed
see Sutton and Elias (this volume, chap. 7). discussion, see Kauahikaua and Tilling, this volume, chap. 10).
A B
UV window
Data
acquisition
computer
Battery for
Spectrometer USB hub
GPS
Motor controllers
for cell wheel
and scanner
Motorized SO2
calibration cells USB
control
cable
COSPEC
FLYSPEC
Figure 6. Photographs of spectrometers used by the Hawaiian Volcano Observatory (HVO). A, The correlation spectrometer (COSPEC), seen
here in stationary operating mode at Pu‘u ‘Ō‘ō, was the workhorse instrument used by HVO to measure SO2 emission rates at Kīlauea through
2004 (USGS photograph by J.D. Griggs). It has been replaced by the lighter, less cumbersome, and lower-cost FLYSPEC, a miniature ultraviolet
spectrometer. B, The compactness of the latest model of the miniature ultraviolet spectrometer can be appreciated from this schematic (top) of the
measurement system (Horton and others, 2006, figure 1). Road-based configuration (bottom) for running the FLYSPEC and COSPEC instruments
side-by-side for experiments conducted during 2002–03 (Elias and Sutton, 2007, figure 2A). For detailed discussion of FLYSPEC measurements, see
Horton and others (2006), Elias and others (2006), and Sutton and Elias (this volume, chap. 7).12 Characteristics of Hawaiian Volcanoes
10,000
A East Rift Zone
9,000 Summit
8,000
Onset of
summit eruption
7,000
mid-March 2008
6,000
5,000
4,000
3,000
2,000
SO2 emission rate, in metric tons per day
1,000
0
1997 1998 1999 2000 2001 2002 2003 2004 2005 2006 2007 2008 2009 2010 2011 2012 2013
2,500
B Summit
2,000
Summit eruption
April 1982 (The Hawaiian Volcano Observatory—A Natural Laboratory for Studying Basaltic Volcanism 13
Petrologic-Geochemical Monitoring Geologic, Petrologic, and Geochemical
Investigations
When Gordon Macdonald joined the HVO staff in
the early 1940s, he initiated what might be considered the The first geological studies of Hawaiian volcanoes
forerunner of “petrologic-geochemical” monitoring of were made during 1840–41, as part of the U.S. Exploring
Hawaiian eruptions—the systematic sampling and analysis of Expedition, commanded by U.S. Navy Lieutenant Charles
eruptive products to examine temporal changes to composition Wilkes (Wilkes, 1844). These early scientific observations
as an eruption progresses. Beginning in 1952, every eruption were led by James Dwight Dana, a 27-year-old, Yale-educated
at Kīlauea and Mauna Loa, ranging in duration from days to natural scientist who had worked at Mount Vesuvius in
decades, has been “sampled at regular intervals to cover both 1834. Dana is considered the first American volcanologist,
the spatial and temporal distribution of eruptive products” and his expedition report “constitutes a virtual textbook of
(Wright and Helz, 1987, p. 628). Such systematic sampling Hawaiian volcanology and geology” (Appleman, 1987, p.
(fig. 8) is especially important during prolonged eruptions, 1607). Clarence E. Dutton—the first USGS geologist to work
such as the ongoing Pu‘u ‘Ō‘ō-Kupaianaha eruption (1983 to in Hawai‘i—spent 5 months in the Hawaiian Islands in 1882
present). Time-series compositional data complement those “for the purpose of studying the features and processes of a
from seismic, geodetic, and gas monitoring to characterize volcano in action, and thus obtaining the practical knowledge
preeruption conditions and processes within magma which is essential to the investigation of extinct volcanoes”
reservoirs, as well as syneruptive dynamics (for example, (Dutton, 1884, p. xxvi) before starting a new mapping
Thornber, 2003; Thornber and others, 2003). The availability assignment in the Cascade Range of the Pacific Northwest.
of extensive time-series compositional datasets for Hawaiian The work and findings of Dana (1849) and Dutton have
lavas fostered the development of the breakthrough concepts guided subsequent geologic studies. In his memoir, Dana
of “olivine control,” “magma batches,” and “magma mixing” (1890) summarized concepts learned from study of Hawaiian
(see, for instance, Powers, 1955; Wright, 1971), which are volcanoes, listing topics needing further study in the preface
now widely applied in igneous petrology, especially in studies of that volume (table 1). As is obvious from the now-abundant
of basaltic volcanism. The obvious synergy between HVO volcanologic literature, HVO and many other investigators
petrologic-geochemical monitoring and basic research is continue to address many of these fundamental research
amply illustrated by the many advances in our petrologic questions—first emphasized by Dana more than a century
understanding of basaltic volcanism, as reviewed by Helz and ago—to better understand basaltic volcanism in Hawai‘i and,
others (this volume, chap. 6). by extrapolation, elsewhere.
Figure 8. In the regular
petrologic-geochemical
monitoring of eruptive
products, Hawaiian Volcano
Observatory (HVO)
scientists, using a steel
cable with a hammerhead
attached, collect a sample
through a skylight of an
active lava tube originating
at Pu‘u ‘Ō‘ō vent. Molten
lava adheres to the
hammerhead dangling at
edge of skylight above the
flowing lava stream. (USGS
photograph by J.D. Griggs,
December 5, 1990).14 Characteristics of Hawaiian Volcanoes
Table 1. Some aspects of Hawaiian volcanism that geologist James D. Dana thought still needed investigation in 1890 (excerpted from Dana,
1890, p. vii–viii).
“But much remains to be learned from further study of the Hawaiian volcanoes. Some of the points requiring elucidation are the following:
• the work in the summit-crater between its eruptions;
• the rate of flow of lava-streams and the extent of the tunnel-making in the flow;
• the maximum thickness of streams;
• the existence or not of fissures underneath a stream supplying lava;
• the temperature of the liquid lava;
• the constitution of the lava at the high temperatures existing beneath the surface;
• the depth at which vesiculation begins;
• the kinds of vapors or gases escaping from the vents or lakes;
• the solfataric action about the craters;
• the source of the flames observed within the area of a lava lake;
• the differences between the lavas of the five Hawaiian volcanoes . . . ;
• the difference in kind or texture of rock between the exterior of a mountain and its deep-seated interior or centre . . . ;
• the difference between Loa, Kea, and Haleakala in the existence below of hollow chambers resulting form lava discharges . . .
• the movements of the lavas in the great lava columns, and the source or sources of the ascensive movement.”
Observations of Kīlauea Lava Lake Activity
Because of its frequent and sustained effusive eruptions
and relative accessibility, Kīlauea Volcano has served as Table 2. Eruptions at Kīlauea Volcano over the past ~200 years.
a prime natural laboratory for systematic studies of active Year Duration
basaltic lava lakes. Table 2 is a compilation of episodes of Eruption site Selected references
start (days)1
lava-lake activity at Kīlauea, lasting 30 or more days, during
the period pre-1823 to the present. Halema‘uma‘u Pre-1823 >35,000 Jaggar (1947)
Between Jaggar’s first visit to Kīlauea in 1909 with fellow (intermittent) Bevens and others (1988)
MIT geologist R.A. Daly to early 1924, the continuously active
lava lake at Halemaʻumaʻu Crater provided a natural and easily Halema‘uma‘u 1934 33 Jaggar (1947)
accessible focus for systematic visual observations of eruptive
No eruptive activity at Kīlauea during 1935–51
activity at Kīlauea. The accounts of the earliest observers were
conveniently summarized in Brigham (1909) and Hitchcock
Halema‘uma‘u 1952 136 Macdonald (1955)
(1911). Daly incorporated his 1909 lava-lake observations into a
larger work on volcanism (Daly, 1911), concluding that (1) the Kīlauea Iki 1959 36 Richter and Eaton (1960)
circulation of lava in the shallow, saucer-shaped Halemaʻumaʻu Richter and others (1970)
lakes was driven by two-phase magmatic convection within a
narrower conduit below; (2) lava fountains were the result of Halema‘uma‘u 1967 251 Kinoshita and others (1969)
“explosive dilation” of entrained gas bubbles as magma rose
within that conduit; (3) the lake surface was a “froth”; and Mauna Ulu 1969 875 Swanson and others (1979)
(4) the predominant gas release was at lake edges, where lava
pooled. Based on night-and-day observations in 1911, Perret Mauna Ulu 1972 455 Tilling (1987)
Tilling and others (1987a)
(1913a,b,c,d) came to the conclusion that lava-lake circulation
was driven by the sinking of cooled, degassed slabs at the Mauna Ulu 1973 222 Tilling and others (1987a)
eastern end of the lake into the same conduit from which fresh,
vesiculating magma was rising before flowing westward along Pauahi 1979 30 Tilling and others (1987a)
the bottom to emerge at the western end of the lake.
Jaggar’s much longer series of lava-lake observations Pu‘u ‘Ōʻō- 1983 >11,500 Wolfe and others (1987)
led him to more refined ideas of the active lava lake and Kupaianaha (intermittent, Wolfe and others (1988)
associated processes within the Halema‘uma‘u pit crater ongoing) Heliker and others (2003a)
Orr and others (2012)
(Jaggar, 1920). He correctly concluded that gases are in
solution in magma at depth (“hypomagma”) and only start
Halema‘uma‘u >2,400 Hawaiian Volcano
to vesiculate in the magma as it rises (“pyromagma”). Once (ongoing) Observatory Staff (2008)
the lava loses its gas while in the lake, it becomes denser Patrick and others (2013)
and more viscous (“epimagma”) and collects at the base and
along the edges of the lake, as well as draining back into 1
Updated from Peterson and Moore (1987, table 7.3).You can also read