The Short-Term Load Forecasting for Special Days Based on Bagged Regression Trees in Qingdao, China
←
→
Page content transcription
If your browser does not render page correctly, please read the page content below
Hindawi
Computational Intelligence and Neuroscience
Volume 2021, Article ID 3693294, 16 pages
https://doi.org/10.1155/2021/3693294

Research Article
The Short-Term Load Forecasting for Special Days Based on
Bagged Regression Trees in Qingdao, China

 Huanhe Dong , Ya Gao, Yong Fang , Mingshuo Liu , and Yuan Kong
 College of Mathematics and Systems Science, Shandong University of Science and Technology, Qingdao 266590, China

 Correspondence should be addressed to Yuan Kong; kongyuan@sdust.edu.cn

 Received 30 July 2021; Revised 24 August 2021; Accepted 26 August 2021; Published 16 September 2021

 Academic Editor: Yu-Ting Bai

 Copyright © 2021 Huanhe Dong et al. This is an open access article distributed under the Creative Commons Attribution License,
 which permits unrestricted use, distribution, and reproduction in any medium, provided the original work is properly cited.

 There are many factors that affect short-term load forecasting performance, such as weather and holidays. However, most of the
 existing load forecasting models lack more detailed considerations for some special days. In this paper, the applicability of the
 bagged regression trees (BRT) model combined with eight variables is investigated to forecast short-term load in Qingdao. The
 comparative experiments show that the accuracy and speed of forecasting have some improvements using the BRT than the
 artificial neural network (ANN). Then, an indicator variable is newly proposed to capture the abnormal information during special
 days, which include national statutory holidays, bridging days, and proximity days. The BRT model combined with this indicator
 variable is tested on the load series measured in 2018. Experiments demonstrate that the improved model generates more accurate
 predictive results than BRT model combined with previously variables on special days.

1. Introduction results are obtained. These methods are easy to implement,
 but the drawback is that they hardly capture the sudden
Accurate short-term forecasts of electricity load are essential variety among time series and achieve the expected per-
for the real-time scheduling of power systems, optimizing formance because of their linear definition theoretically.
operational costs, and improving the reliability of distri- Recently, artificial neural network (ANN) models have been
bution networks. Specially, these forecasts have been playing extensively explored to receive more higher forecasting
a crucial role in unit commitment and maintenance, power accuracy and overcome the above limitations [8–10]. Due to
interchange, and task scheduling of both the power gen- their excellent learning and generalization capabilities,
eration and distribution facilities. Economically, the high neural networks have been found to be the first-choice
precision in load forecasts can allow utilities to operate at candidates in the field of time-series forecasting. For ex-
minimum cost, which may contribute to significant savings ample, hourly short-term electricity load forecast using
in electric companies. Therefore, improving the accurate ANN in England was presented and showed a very good
level of short-term load forecasting could not only increase prediction that the mean absolute percentage errors (MAPE)
the management efficiency in terms of schedule planning but are 1.38% for weekdays and 1.39% for weekends [10].
also reduce the energy budgets, which is an encouraged However, the network training of ANN requires huge
behavior for those resource-saving developing countries amounts of data, and its interpretability of the prediction
[1, 2]. results is poor [11]. Apart from neural network-based
 Now, there have been numerous works for developing models, there are also many machine learning algorithms
accurate short-term load forecasting. Many statistical producing superior abundant results in some applications,
methods, including linear or multiple regression, autore- such as atmospheric rainfall forecasting [12], financial
gressive integrated moving average (ARIMA) models [3, 4], forecasting [13], and tourism forecasting [14]. The machine
Kalman filtering technology [5], and exponential smoothing learning algorithms mainly include support vector regres-
models [6, 7], have been applied in this filed, and some good sion (SVR) [12, 15, 16], decision trees [17–20], random forest
2 Computational Intelligence and Neuroscience

(RT) [21], and gradient boosting regression trees (GBRT) relative coefficient analysis to make the prediction better. In
[22]. The SVM can solve the practical problems such as small fact, the actual power load data had shown that the load
sample, nonlinear, high, and local minimum point, but this patterns on the days before and after the holidays were also
method cannot determine the input variables effectively and different from normal days [30]. Considering the load drop
reasonably, and it has slow convergence speed and poor due to the proximity of the forecast day, Lamedica et al.
forecasting results while suffering from strong random applied a special rule with adding a distance variable of a
fluctuation time series [15]. Therefore, Fan et al. proposed an specific day from Sunday or holiday day [31]. On the days
improved SVR model hybridized with the empirical mode before and after public holidays, the accuracy of load
decomposition method and autoregression, which can both forecasting had some improvement. And, Pardo et al.
provide more accuracy forecasts and interpretability [16]. employed dummy variables to capture the weekly period-
Recently, the application of decision tree algorithm to load icity, yearly periodicity, and holiday effects and used addi-
forecasting has received some excellent results. Decision tree tional dummy variables to represent the days following
is a kind of tree structure used in regression and classifi- public holidays that often exhibit different load profile from
cation, which is also called regression tree used for re- that of normal days [32].
gression. It allows to extract if-then rules and clarify the In general, some different special days are usually
nonlinear relationship between inputs and outputs easily. classified as the same type to avoid overparameterization in
The most significant favor of regression trees is the ability of the method to deal with anomalous load that involves the use
easy development and interpretation due to their non- of dummy variables [28, 33]. The classification of special
parametric design. Bootstrap aggregated (bagged) is an days should rely on the assumption that the load shapes of
ensemble method that can solve the overfitting problem for different special days can be considered similar and would
regression trees. It builds multiple trees repeatedly based on remain similar for many years. In addition, it is extremely
resampling with replacement and then integrates these necessary to analyze local data in detail and choose a suitable
decision trees to vote to obtain better prediction accuracy. In method, because the load variation patterns have large
fact, bagged regression trees (BRT) have demonstrated the differences in different regions. In our previous work [34],
applicability and effectiveness of load forecasting in some the load time-series measured from 2016 to 2018 in Qingdao
studies. For example, Carmen et al. evaluated the effec- was investigated in order to make a prediction more ac-
tiveness of ensemble methods (bagging, random forest, curately by using an ANN model combined with eight input
conditional forest, and boosting) based on regression trees in variables. Among these inputs, for the sake of simplicity,
short-term load forecasting [21]. Four ensemble models public holidays and weekends were assumed as one group of
were applied to the electricity consumption of a campus nonworking days. Then, one dummy variable was generated
university in Cartagena, Spain. Accuracy results for four in the load prediction model, including 0 for nonworking
models showed that bagging and random forest provided the days and 1 for working days. However, there are some
best accuracy in the training dataset. Accordingly, the BRT differences in load profile during public holidays and
model will be employed in this paper. weekends.
 It is well-known that the error of short-term load In this paper, it is aimed to make contributions to ad-
forecasts mainly derives from the special days when the load dress the issues on short-term load forecasting for special
shape deviates significantly from the normal days, such as days. First, the applicability of BRT model combined with
weekends, public holidays, and days preceding and following eight predictors, which had been used in [34], is investigated
holidays [23–25]. Load observed on normal days is regarded to forecast short-term load in Qingdao. Then, the Chinese
as normal load, whereas the load observed on special days is national holidays are classified into five different categories
regarded as anomalous load. Typically, while the load data to better mining of different load profiles. According to the
on special days have been used in the training of prediction analysis result of the load data during the holidays from 2016
models, they have been eliminated from testing set [26]. to 2017, these special days are divided into three types in-
Darbellay and Slama [27] divided the data into working days cluding statutory days, bridging days, and days preceding
and holidays to forecast separately but still did not achieve and following holidays, which are called proximity days. As a
good results during holidays. It can be seen that the mod- result, an indicator variable is proposed to represent dif-
elling of anomalous load had usually been overlooked in ferent special days. Lastly, the BRT model combined with
many previous works, and there are some reasons sum- this proposed indicator variable for special days is tested on
marized as follows: (1) load shapes on special days are quite load time-series measured from 2018.
different from those of normal days; (2) the lack of obser- The remainder of this paper is structured as follows:
vation samples of special days leads to insufficient training; Section 2 introduces the BRT forecasting model. Then, a
(3) different special days exhibit different load variation brief description of the load characteristic can be found in
patterns [28]. For this, several works are done for developing Section 3. Section 4 provides the empirical comparison
accurate short-term load forecasting methods for special between BRT model and ANN model. In Section 5, the
days. For instance, the new fuzzy regression model was detailed analysis of the load characteristic for special days is
applied, and it improved the prediction accuracy of the given. At the same time, a new indicator variable is proposed
holidays falling [29]. Although, forecasting errors of holidays to distinguish different special days. In Section 6, the BRT
falling on Saturday or Monday were bigger than those of model combined with this new indicator variable is tested on
other days, they further studied linear regressive analysis and the load data for whole year and holiday periods in 2018.
Computational Intelligence and Neuroscience 3

Section 7 provides some discussion of the prediction results.
Finally, main conclusions are presented in Section 8. Root node

 Yes No
2. Bagged Regression Trees
Decision tree was firstly proposed in 1984 by Breiman, which Internal node Root node
is widely used in both classification problems and regression
 Yes No Yes
analysis [35]. When used for classification, each leaf node in No
the decision tree represents a category, and when used for
 Leaf node Internal node Leaf node Leaf node
regression, each leaf node represents a predicted value,
which is continuous. Considering the practical application
 Yes No
of this study, we only introduce the case of regression.

 Leaf node Leaf node
2.1. Regression Tree. The regression trees represent a map-
ping between object attributes and object values. Each node Figure 1: The structure of a simple regression tree.
in the tree represents an object, each fork path represents the
value of a possible property, and each leaf represents the
value of the object represented by the path taken from the
root to that leaf. The structure of a simple regression tree is ⎡⎢ 2⎤ ⎥
 min⎢⎢⎢⎣min yi − c2 ⎥⎥⎦.
 2
shown in Figure 1. Specifically, each regression tree repre- yi − c1 + min
 c1 c2
sents a division of the feature space and the output value on xi ∈R1 {j,s} xi ∈R2 {j,s}

the division unit. (5)
 Assume a training data set: D � (x1 , y1 ), (x2 ,
y2 ), . . . , (xi , yi )}, xi ∈ Rn , y ∈ R. The object of the regression Use the selected pair (j, s) to divide the area and de-
problem is to construct a function f(x), which can fit the termine the corresponding output value:
elements in the data set D to minimize the loss function. R1 j, s � x|x(j) ≤ s ,
 1 (6)
 object � min Loss f xi − yi . (1)
 n R2 j, s � x|x(j) > s ,
 In this context, the mean square error (MSE), which is
 1
common for regression problem, is used as the loss function cm � yi , x ∈ Rm , m � 1, 2, (7)
and shown in the following equation: Nm xi ∈Rm (j,s)
 n
 MSE � f xi − yi 2 . (2) where Nm refers to the number of elements in the m-th
 i�1 region. Continue to call formulae (5)–(7) on the two divided
 subregions until the stop condition is met.
 Suppose that a constructed regression tree has M leaves, Finally, the input space X is divided into M regions
which means that the tree divides the input space X into M R1 , R2 , . . . , RM , and generate a regression tree:
units R1 , R2 , . . . , RM , and it also means that there are at most
M different predictions. The MSE minimization formula of ⎪
 ⎧
 ⎪ c1 , xi ∈ R1 j, s
 ⎪
 ⎪
the tree is as follows: ⎪
 ⎪
 ⎪ c2 , xi ∈ R2 j, s
 ⎪
 ⎨
 1 M 2 f(x) � ⎪ c3 , xi ∈ R3 j, s (8)
 min cm − yi , (3) ⎪
 ⎪
 n m�1 x ∈R ⎪
 ⎪ ···
 i m ⎪
 ⎪
 ⎪
 ⎩
 cM , xi ∈ RM j, s .
where cm represents the predicted value of the m-th leaf:
 cm � ave yi |xi ∈ Rm . (4) The regression tree algorithm has the potential to sim-
 ulate highly nonlinear and complex relationship between the
to minimize the overall MSE of this regression tree, that is, to input variables and the outputs. And, it can be considered as
minimize the MSE of each leaf. a base learner in the field of machine learning. In addition,
 Therefore, in each division, the splitting variable and the constructed regression tree has the ability to accurately
splitting point that minimize the sum of MSE of each leaf extract features from data with large differences in data
should be selected. This content adopts the heuristic method types. However, regression trees can be extremely nonrobust
to traverse all splitting variables and splitting points and then and generally provide less forecasts accuracy than some of
select the case with the smallest sum of leaf nodes MSE as the the other regression methods. Fortunately, these disad-
division. vantages can be easily improved by aggregating many re-
 Traverse the variable j, scan the splitting point s for the gression trees using ensemble methods, such as bootstrap
fixed splitting variable j, and select the pair (j, s) that aggregating (bagging), random forests, and boosting [35].
minimizes the following formula: The bagging ensemble method is used in this study.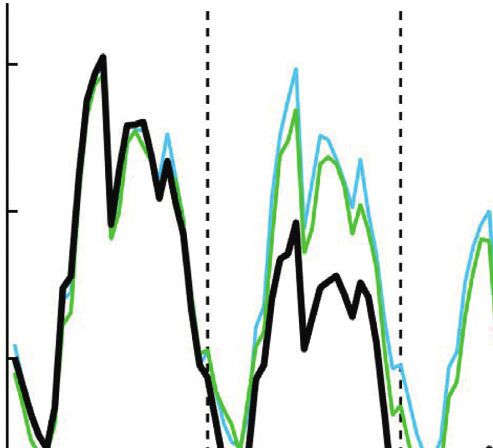
4 Computational Intelligence and Neuroscience

2.2. Bagging. The principle of bagging ensemble method, the power spectral density in [34]. Moreover, it is noted that
which was primarily designed by Breiman [36], is to con- the load values during public holidays marked by green
struct and combine multiple individual learners to ac- curve are considerably lower than those on normal days, and
complish the final prediction task. This ensemble learning the load values are the lowest during the Chinese Lunar
method is often used to reduce the variance of regression Spring Festival. Specific dates of all public holidays in China
trees and remedy the overfitting problem in the single tree. can be found in Table 1.
The specific steps can be summarized as follows:
 Step 1: randomly generate T new sample sets of the 3.2. Intraday and Intraweek Seasonality. The average in-
 same size as the training sets using bootstrap method. traday profile for each day of the week from 2016 to 2017 is
 Step 2: generate the corresponding regression tree shown in Figure 4. It can be seen from the figure that the load
 based on the method mentioned above on each training values during weekend are lower than those during week-
 set. For example, 50 trees are used in the bagging trees days, and the load value on Sunday is the lowest. However,
 models in this work. the daily change pattern is consistent throughout the week. It
 Step 3: apply the generated regression trees to the test is worth noting that the load value at 12 am shows a sharp
 sample to obtain the predicted values. And the final decline. The existence of this phenomenon is also one of the
 predicted values can be obtained by averaging the reasons why statistical models cannot be used to make
 values of each trees. The prediction of the bagging trees predictions. This is due to the fact that the statistical ap-
 model is expressed as proach is based on the theory of polynomials, which cannot
 capture this sudden change well.
 In this paper, the eight predictors are adopted based on
 the consideration of power spectrum analysis and mutual
 1 T
 h(x) � f (x), (9) information [34]. The eight predictors include hour of day,
 T t�1 t load from the same hour in the previous day, previous day’s
 average load, day of week load from the same hour and same
where ft is the predicted value based on the t-th tree. day from the previous week, a dummy variable indicating
 The overall flowchart of the basic idea of bagged re- whether it is a working day or nonworking day, temperature,
gression trees prediction is shown in Figure 2. and humidity.
 As an ensemble algorithm, the bagging algorithm is
mainly used to randomly extract mutually independent
training sets, and each round of training is parallel to im- 4. Empirical Comparison
prove the training speed. Theoretically, it can be proved that
 4.1. Evaluation Criteria. To assess the forecasting perfor-
the variance of prediction can be reduced to 1/N (N is the
 mance of the proposed model, four well-known accuracy
number of learners) of the original variance (single learner)
 indexes, including mean average error (MAE), MSE, MAPE,
[37]. Therefore, prediction variance can be reduced by using
 and root mean squared error (RMSE), are used in this study
multiple learners.
 and are shown as follows:

3. Load Characteristic 1 N
 MAE � i ,
 yi − y
 N i�1
In this paper, three years of hourly load in Qingdao are used
from January 1, 2016, to December 31, 2018, which accu-
 i
 1 N yi − y
mulate 26, 304 observation points. The period from January MAPE � ,
1, 2016, to December 31, 2017, is employed for estimation N i�1 yi , (10)
purposes (in-sample), and the data observed in 2018 are left �����

for forecast evaluation (out of sample). The complete load
 1 N
profile is shown as follows. RMSE � y −y i 2
 N i�1 i

3.1. Intrayear Seasonality. It can be seen from Figure 3 that where N is the total number of forecasting results; yi is the
the load exhibits a recurring-year pattern because of the i is the forecast load at point i.
 actual load at point i; and y
seasonal effects, which is referred to as the intrayear sea-
sonality. The summer load is the highest with the largest
fluctuations in the whole year. In contrast, the load levels in 4.2. Empirical Comparison. To demonstrate the applicability
spring and autumn are low and stable. However, there are of the BRT model with eight predictors to forecast short-
two completely different variation trends in winter: it term load, the empirical comparison between the ANN
gradually increases during the transition from autumn to model used in our previous paper and BRT model is carried
winter and decreases sharply at the end of January and early out, based on an evaluation of their simulation accuracy for
February. Overall, the annual average load shows an upward the out of-sample period, which consist of load observations
trend. In addition, there are intraday and intraweek sea- of all hours in 2018. The most classic backpropagation neural
sonality in the load sequence, which has been confirmed by network (BPNN) was used in a previous work. Similarly,
Computational Intelligence and Neuroscience 5

 To build bagging regression trees model

 Sample set 1 Train Tree 1 prediction

 Sample set 2 Train Ensemble Predicted
 Training Tree 2 prediction
 set model loads

 Sample set N Train Tree N prediction
 Original
 data
 Input variables

 Actual
 Test set
 loads

 Figure 2: Flowchart of the basic idea of bagged regression trees prediction.

 9000

 8000

 7000

 6000
 Load (MW)

 5000

 4000

 3000

 2000

 1000
 2016 2017 2018
 Time
Figure 3: Raw load profile for Qingdao from 1 January 2016 to 31 December 2018. The gray fluctuation line describes the raw hourly load,
the blue curve shows the profile of daily average load, and the green curved section represents some public holidays.

 Table 1: Specific dates of public holidays in China.
Public holidays 2016 2017 2018
 1/1–1/3 2016/12/31–2017/1/2 2017/12/30–2018/1/1
New Year’s day
 Fri Sat Sun Sat Sun Mon Sat Sun Mon
Chinese Lunar 2/7–2/13 1/27–2/2 2/15–2/21
Spring Festival Sun Mon Tue Fri Sat Sun Thu Fri Sat
 4/2–4/4 4/2–4/4 4/5–4/7
Qingming Festival
 Sat Sun Mon Sun Mon Tue Thu Fri Sat
 4/30–5/2 4/29–5/1 4/29–5/1
May Day
 Sat Sun Mon Sat Sun Mon Sun Mon Tue
 6/9–6/11 5/28–5/30 6/16–6/18
Dragon Boat Festival
 Thu Fri Sat Sun Mon Tue Sat Sun Mon
 9.15–9.17 9/22–9/24
Mid-Autumn Festival
 Thu Fri Sat 10/1–10/8 Sat Sun Mon
 10/1–10/7 Sun Mon Tue 10/1–10/7
Chinese National Day
 Sat Sun Mon Mon Tue Wed
Note: the statutory days are denoted in bold.

MAPE is used as the forecasting accuracy index. The pre- experiments is due to the input variables used in the pre-
dictors considered in the basic experiment (Be) and four diction model. So, this will not be repeated here, and more
comparative experiments (Ce) are the same as before. Note details about ANN model and experiments can be found in
that the only difference between the above two types of [30].
6 Computational Intelligence and Neuroscience

 5500 Table 2: MAPE of five experiments (%).
 Experiment Be Ce-1 Ce-2 Ce-3 Ce-4
 5000 ANN 3.73 3.66 3.51 3.61 3.45
 BRT 3.71 3.54 3.39 3.62 3.15
Load (MW)

 4500

 5.1. Category A: Basic Public Holiday. The basic holidays in
 4000 2016 and 2017 are classified into three different types, be-
 cause the statutory day of the basic holiday may occur on any
 3500 day during the holiday periods.
 00:00 06:00 12:00 18:00
 Time of day (hours) 5.1.1. Statutory Day Occurred on the Third Day of the Holiday
 Period. Using the Qingming Festival in 2016 as a repre-
 Mon Fri
 Tue Sat sentative case, its statutory holiday is one day, but as shown
 Wed Sun in Figure 5, it is extended to three days for practical reasons.
 Thu It can be seen from the figure that the load on statutory day
Figure 4: Average intraday profile for each day of the weeks from (April 4, Monday, Day 3) is noticeably lower than that of the
2016 to 2017. other two days (April 2–3, Day 1 and Day 2) during the
 holiday, namely, bridging days. Specially, there are huge
 differences for load between the statutory day and the
 The forecasting accuracy of the Be and Ce is presented in normal Monday, which are working days. It is worth noting
Table 2. Note that the BRT model shows slightly higher ac- that load values during the two bridging days and load values
curacy in almost all experiments except for Ce-3. More during weekends from the normal weeks are very similar.
specifically, the prediction accuracy of the BRT model in five Moreover, the days both preceding and following holiday
experiments is 0.11% lower than that of the ANN model on (April 1 and April 5), which are referred to as proximity days
average. Particularly, for Ce-4 that considers eight features, in this study, exhibit similar load variation patterns with
the MAPE value of the BRT model reaches 3.15%, which is normal days. Therefore, proximity days can be treated as
0.3% lower than that of the ANN model. These results il- normal days in modelling.
lustrate not only the effectiveness of the BRT model for load
forecasts, but also the adaption of the above eight predictors to
 5.1.2. Statutory Day Occurred on the Second Day of the
the BRT model. However, there still exists a slightly larger
 Holiday Period. In Figure 6, the load profile for special days
error on some special days. Therefore, a targeted study on the
 is displayed, including the May Day holiday and bridging
load variation pattern on special days is conducted below.
 days, five normal days from the preceding week, and five
 normal days from the preceding week. As excepted, the
5. Load Characteristic for Special Days statutory day (May 1, Sunday, Day 2) has the lowest load
 value, followed by the bridging days (April 30 and May 2,
The load profiles of public holidays were significantly dif- Day 1 and Day 3). There are some differences between load
ferent from those of normal days, and different public values in the bridging days and the days from normal weeks.
holidays have different load profiles, so it is necessary to But the load pattern of bridging days is very similar with
analyze the load data of each holiday separately. We identify normal weekends. Moreover, proximity days and the cor-
a total of three categories of seven public holidays in China responding days from normal weeks are observed to have
via the legal public holidays’ arrangement and the actual particularly similar intraday load pattern, which is generally
situation. The current standards for some public holidays are consistent with the above analysis.
one day, such as New Year Day, Qingming Festival, May
Day, Dragon Boat Festival, and Mid-Autumn Festival, but it
is usually extended to three days in the form of an ad- 5.1.3. Statutory Day Occurred on the First Day of the Holiday
justment or continuous holiday. We refer to these holidays Period. As shown in Figure 7, due to the impact of the
as basic public holidays and classify them as category A. In Dragon Boat Festival, the load values during the entire
the same way, Chinese National Day holiday, which origi- holiday period have dropped significantly. The load values
nally stipulated a three-day holiday, is usually extended to on statutory days (June 9, Day 1) are much lower than those
one week, and we classify it as category B. As mentioned on bridging days (June 10-11, Day 2-3). The two bridging
above, the load variation during the Chinese Lunar New days are Friday and Saturday; and the load pattern is similar
Year is indeed remarkably different from other public to that of the normal weekend (June 4-5 or June 18-19). As a
holidays. At the same time, the Chinese Lunar New Year result, the bridging days can be considered the same as
with longer holiday period is classified as Category C. Al- normal weekends here.
though the New Year’s legal holiday is the same as the The load profiles during three different type of basic
National Day, it is generally extended to one to two weeks or holidays from 2016 to 2017 are presented in Figure 8. As
even longer. excepted, the lowest peak of load values during each holiday
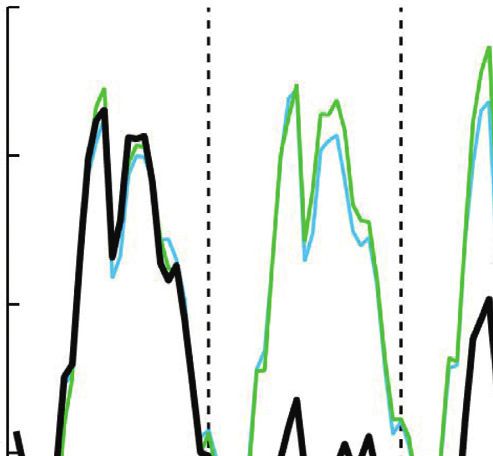
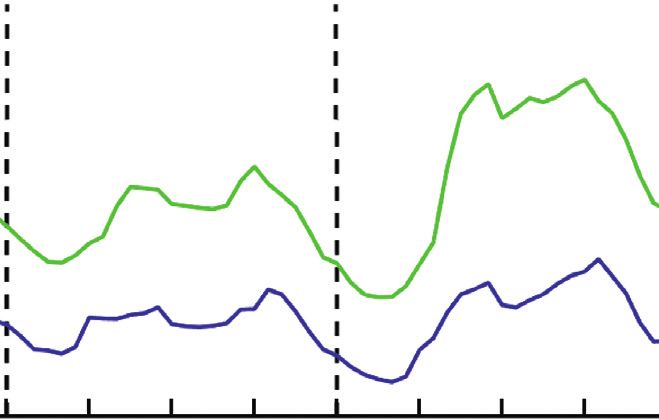
Computational Intelligence and Neuroscience 7

 5000 5000

 4500 4500

 4000 4000
Load (MW)

 Load (MW)
 3500 3500

 3000 3000

 2500 2500
 Preceding Day Day 1 Day 2 Day 3 Following Day
 Preceding Day Day 1 Day 2 Day 3 Following Day
 Time
 Time
 Preceding Normal Week
 Preceding Normal Week Special Week
 Special Week Following Normal Week
 Following Normal Week
 Figure 7: Load profile for five days of special week including the
Figure 5: Load profile for five days of special week including the Dragon Boat Festival (June 9–11, 2016), five normal days (June 1–5,
Qingming Festival (April 2–4, 2016), five normal days (March 2016) from the preceding week, and five normal days (June 15–19,
25–29, 2016) from the preceding week, and five normal days (April 2016) from the following week. The line representation is the same
8–12, 2016) from the following week. The blue line represents the as in Figure 4.
hourly load on normal week preceding holiday, the black line
represents the hourly load on special week, and the green line
represents the hourly load on the normal week following holiday. proximity and normal working days, and 0 for both bridging
 days and weekends.

 4500
 5.2. Category B: Chinese National Day. As a relatively im-
 portant holiday, the statutory holiday of Chinese National
 4000 Day lasts for three days, but it is usually extended to one
 week. As shown in Figure 9(a), the load values on the whole
 Load (MW)

 holiday period (October 1–7) in 2016 are significantly lower
 3500
 than those on the other days, especially on statutory days
 (October 1–3). Moreover, the load values on the five days
 3000 preceding holiday are observed to show a downward trend,
 which is undoubtedly under the influence of the holiday
 period. Fortunately, the normal intraweek variation pattern
 2500 can be found before September 25 and after October 9. It
 should be noted that October 8 and 9 has changed from
 Preceding Day Day 1 Day 2 Day 3 Following Day weekends to working days to compensate for the loss of
 Time working days due to public holidays. Thus, the load level and
 Preceding Normal Week variation on these two days are slightly different from those
 Special Week of normal weekends, such as September 24 and September
 Following Normal Week 25. In 2017, the overall load variation during the holiday
Figure 6: Load profile for five days of special week including the May period is almost the same as in 2016, but as shown in
Day (April 30–May 2, 2016), five normal days (April 22–26, 2016) Figure 8(b), the load values drop on a special day in 2017
from the preceding week, and five normal days (May 6–10, 2016) from (i.e., September 30, 2017, the Mid-Autumn Festival), which
the following week. The line representation is the same as in Figure 4. should be considered as an inevitable special situation. From
 what has been discussed above, this public holiday has af-
period appears on statutory day, which should be considered fected the load pattern for two weeks.
as abnormal variation. Moreover, the load pattern on
bridging days can be roughly regarded as the same as normal
weekend. In addition, load pattern on proximity day of the 5.3. Category C: Chinese Lunar Spring Festival. It can be
basic holiday period is similar to that on normal days, which clearly seen from Figure 10(a) that the load values during the
does not have special processing in modelling. Therefore, holiday period (February 7–13) are lowest among the four
one indicator variable is proposed to capture the above weeks, especially on statutory days (February 7–9). The load
abnormal patterns, including 2 for statuary days, 1 for values for almost two weeks preceding the holiday show a
8 Computational Intelligence and Neuroscience

 5500
 5000

 Load (MW)
 4500
 4000
 3500
 3000
 2500
 Preceding Day Day 1 Day 2 Day 3 Following Day
 Time
 New year Day in 2016
 Dragon Boat Festival in 2016
 Mid-Autumn Festival in 2016
 (a)

 6000
 Load (MW)

 5000

 4000

 3000

 2000
 Preceding Day Day 1 Day 2 Day 3 Following Day
 Time
 May Day in 2016
 Qingming Festival in 2017
 (b)

 5000
 4500
 Load (MW)

 4000
 3500
 3000
 2500
 Preceding Day Day 1 Day 2 Day 3 Following Day
 Time
 Qingming Festival in 2016 May Day in 2017
 Qingming Festival in 2017 Dragon Boat Festival in 2016
 (c)

Figure 8: Three types of basic holidays in 2016 and 2017. (a–c) The load profile on basic holidays that statuary day occurred on the first day,
second day, and third day, respectively.

downward trend, and the third week preceding the holiday 6. Experiments
returns to normal.
 Based on the above visual inspection of the load data on In this section, the comparison experiments and experi-
two long holidays, we notice that the load on statutory days mental results are presented for prediction hourly load for
is lowest on whole holiday, and the load on the bridging days 2018 in Qingdao. All experiments are executed under the
(other four days of holiday except for statutory days) tends to MATLAB environment on a PC platform, with 2 Intel Core
be lower than that of the normal days, but higher than that of dual core CPUs (2.4 GHz) and 8 GB RAM in Windows 10
statutory days. In addition, load variation on some prox- operating system.
imity days including the one-week preceding holiday is also
abnormal. Therefore, these special days are marked by an
indicator variable, including 2 for statutory days, 1 for 6.1. Comparison Experiments. The comparison experiments
normal working days, and 0 for bridging days, proximity between the BRT-1 model and the BRT-2 model are carried
days, and weekends. The method of incorporating subjective out, which is used to demonstrate the effectiveness of the
judgment in forecasting models using some specific rules has proposed indicator variable explained in Section 5 for im-
been widely employed in load forecasting field [28]. proving prediction accuracy, especially on special days. The
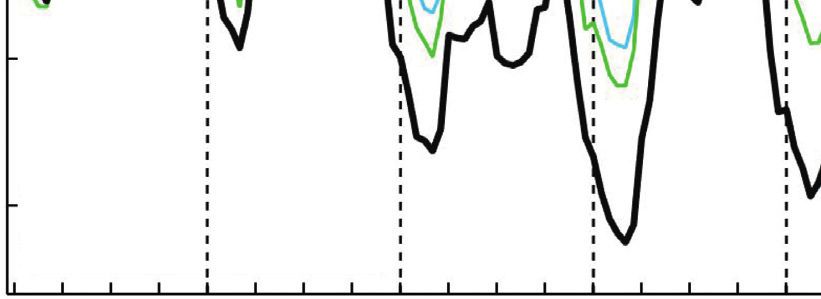
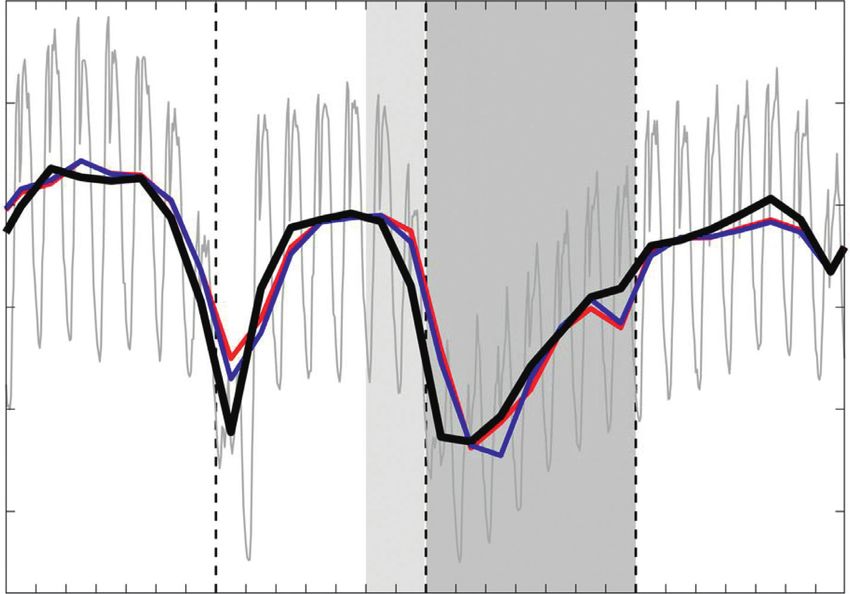
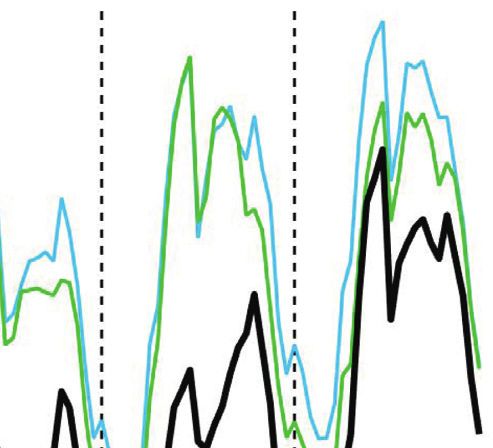
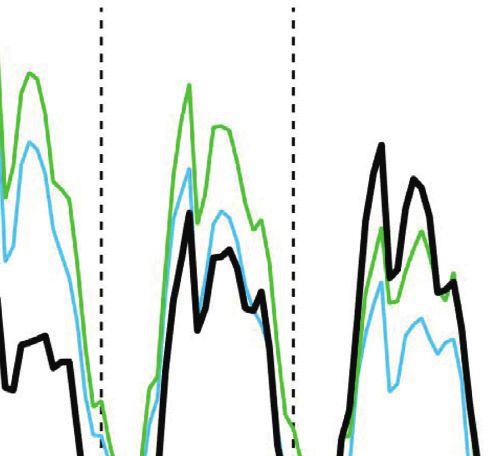
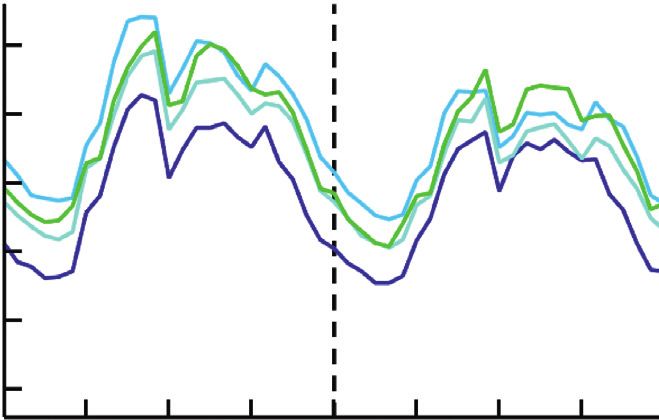
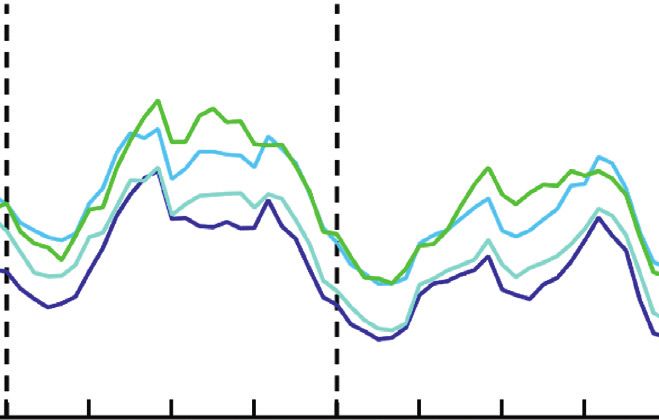
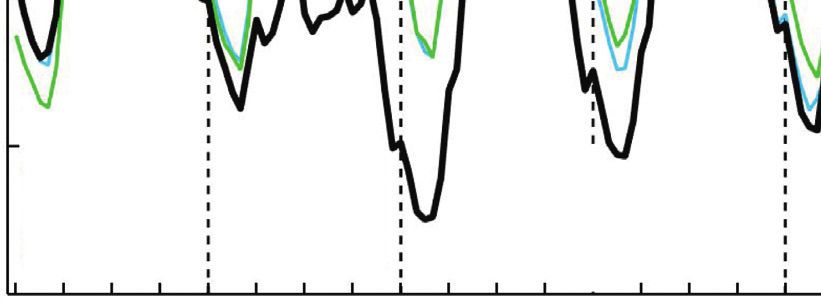
Computational Intelligence and Neuroscience 9

 5500

 5000

 4500
 Load (MW)

 4000

 3500

 3000

 2500
 9/19 9/26 10/1 10/8 10/10 10/16
 Time
 (a)
 6000

 5500

 5000
 Load (MW)

 4500

 4000

 3500

 3000

 2500
 9/18 9/25 9/30 10/1 10/9 10/15
 Time
 (b)

Figure 9: (a) Load profiles for 4 weeks including Chinese National Day Holiday (October 1–7), two weeks in which the load is affected
(September 26–30 and October 1–7), and two normal weeks (September 19–25 and October 10–16), observed in 2016. (b) Load profiles for 4
weeks including Chinese National Day Holiday (October 1–8), a working day (September 29), two weeks affected (September 25–29), and
two normal weeks, observed in 2017. The black curves represent the hourly load, and the red curves represent daily average load.

 6500

 5500
 Load (MW)

 4500

 3500

 2500

 1500
 1/18 1/25 2/62/7 2/14 2/22 2/28
 Time
 (a)
 Figure 10: Continued.
10 Computational Intelligence and Neuroscience

 Load (MW) 5500

 4500

 3500

 2500

 1/9 1/16 1/22 1/27 2/2 2/4 2/13 2/19
 Time
 (b)

Figure 10: Load profiles for Chinese Lunar Spring Festival in 2016 and 2017. The red curves represent daily average load. The dark gray
shaded parts represent holiday, and the light gray shaded parts represent working days. The line representation is the same as in Figure 8.

BRT-1 model refers to the BRT model considering eight three statutory days of Qingming Festival, May Day, and
features used in Ce-4 (see Section 3). For BRT-2 model, the Mid-Autumn Festival than on the statutory day of the
dummy variable used in BRT-1 model is replaced with the Dragon Boat Festival holiday period. The reason that the
new indicator variable that can capture the abnormal var- predicted load values are higher than the actual load values
iation of load values on special days. The specific model in 2018 may be due to the fact that the load pattern of these
inputs of BRT-1 and BRT-2 are shown in Table 3. holidays in 2016 and 2017 is not the same as that in 2018,
 which is also a normal phenomenon. Overall, the BRT-2
 model can better capture the abnormal variation of the
6.2. Experimental Results and Analysis statutory days during the basic holiday, when compared with
 the BRT-1 model. In addition, there are slight improvements
6.2.1. Results for All Hours in 2018. As shown in Table 4, the in some proximity days using the BRT-2 model.
MAE, MSE, MAPE, and RMSE are adopted as the fore-
casting accuracy indexes of model. It can be seen from this
table that the BRT-2 model is superior to BRT-1 model in 6.2.3. Results for Chinese Lunar Spring Festival.
terms of MAE, MSE, and RMSE. These results fully justify Figure 13 shows the comparison between actual and forecast
and highlight the importance of incorporating the proposed loads using BRT-1 and BRT-2 model during Chinese Lunar
indicator variable for special days in the modelling for the Spring Festival. Encouragingly, both prediction models
load data of Qingdao. As the forecast results in terms of capture the overall situation of holiday load values well.
MAPE have not been improved overall, the MAPE of hourly Specifically, load values predicted by BRT-2 model showed a
load using the BRT-1 and BRT-2 model is shown in Fig- slightly upward trend on February 11, which is a working
ure 10 in a more specific form. day. However, the BRT-2 model fails to capture the load
 In Figure 11(a), there is no significant difference between variation on February 24, which is also a working day. And,
the forecast and the actual load values using the BRT-1 and the responses of the two models lag behind the normal load
BRT-2 model. But, we can observe from Figure 11(b) that by about one day. Since the model has learned and trained
BRT-2 model shows better prediction results in August than the load data features of 2016 and 2017, some forecasting
the BRT-1 model. For further comparison, Figure 11(c) errors in 2018 are normal and in line with reality. However,
presents the forecasting accuracy of the BRT-1 and BRT-2 there may be special characteristics in 2018 that are different
model. Obviously, the BRT-2 model achieves smaller MAPE from the previous two years.
values on some days, such as the few days in January,
February, June, August, September, and October. Encour-
agingly, the BRT-2 model is considerably more accurate on 6.2.4. Results for Chinese National Day. The forecast load
special days, including the Chinese national day holiday and values for the four weeks around the Chinese National Day
some proximity days, than the BRT-1 model. Therefore, in using BRT-1 and BRT-2 model are presented in Figure 14.
terms of the above four accuracy indexes, the prediction As shown in Figure 14, the BRT-2 model roughly captures
results of the BRT-2 model have improved to varying the pattern of changes throughout the holiday and has a
degrees. slight advantage over the forecasting error of the BRT-1. The
 most significant improvement of the BRT-2 model can be
 found in September 24, which is a proximity day. This is
6.2.2. Results for Basic Holidays. The comparison of four because the BRT-1 model makes no attempt to model the
basic holidays between actual and forecast loads is presented proximity days. However, the response of the BRT-2 model
in Figure 12. As expected, the BRT-2 model fits better on also shows a lagging trend from September 29 to October 3.
Computational Intelligence and Neuroscience 11

 Table 3: Model inputs of BRT-1 and BRT-2.
Experiments Model inputs
BRT-1 (BRT) H(t), L(t − 24), AveL(t − 24), Day(t), L(t − 144), DuVara (t), Tem(t), Hum(t)
BRT-2 H(t), L(t − 24), AveL(t − 24), Day(t), L(t − 144), InVarb (t), Tem(t), Hum(t)
a
The value of DuVar is 0 or 1. bThe value of InVar is 0, 1, or 2. Refer to Section 5 for specific settings.

 Table 4: Summary of results of the forecasting models.
Model MAE MSE MAPE (%) RMSE
BRT-1 (BRT) 155.86 4.95 × 10⁴ 3.15 222.42
BRT-2 154.90 4.71 × 10⁴ 3.15 217.07

 9000

 7500
 Load (MW)

 6000

 4500

 3000

 Jan Feb Mar Apr May Jun Jul Aug Sep Oct Nov Dec
 Time
 Actual
 BRT-1
 BRT-2
 (a)

 7000

 6000
 Load (MW)

 5000

 4000

 3000

 Jan Feb Mar Apr May Jun Jul Aug Sep Oct Nov Dec
 Time
 Actual
 BRT-1
 BRT-2
 (b)
 Figure 11: Continued.
12 Computational Intelligence and Neuroscience

 15

 MAPE (%)
 10

 5

 0
 Jan Feb Mar Apr May Jun Jul Aug Sep Oct Nov Dec
 Time
 Actual
 BRT-1
 BRT-2
 (c)

Figure 11: (a) Comparison for hourly load between actual and forecast loads; (b) comparison for average hourly load of each day between
actual and forecast loads; (c) MAPE across hourly load using the BRT-1 and BRT-2 model.

 5500
 Load (MW)

 4500

 3500

 Preceding Day Day 1 Day 2 Day 3 Following Day
 Time

 Actual
 BRT-1
 BRT-2
 (a)

 5000
 Load (MW)

 4000

 3000
 Preceding Day Day 1 Day 2 Day 3 Following Day
 Time

 Actual
 BRT-1
 BRT-2
 (b)
 Figure 12: Continued.
Computational Intelligence and Neuroscience 13

 5000
 Load (MW)

 4000

 3000

 Preceding Day Day 1 Day 2 Day 3 Following Day
 Time

 Actual
 BRT-1
 BRT-2
 (c)

 5000
 Load (MW)

 4000

 3000

 Preceding Day Day 1 Day 2 Day 3 Following Day
 Time

 Actual
 BRT-1
 BRT-2
 (d)

Figure 12: Comparison for basic holidays including (a) Qingming Festival, (b) May Day, (c) Dragon Boat Festival, and (d) Mid-Autumn
Festival between actual and forecast loads.

 7500

 6500

 5500
 Load (MW)

 4500

 3500

 2500
 1/29 2/5 2/11 2/15 2/21 2/24 2/26 3/5
 Time
 Actual
 BRT-1
 BRT-2
Figure 13: Comparison for Chinese Lunar Spring Festival between actual and forecast loads in 2018. The black curves represent the actual
load, the red curves represent the predicted load of BRT-1 model, and the blue curves represent the predicted load of BRT-2 model.
14 Computational Intelligence and Neuroscience

 5500

 5000

 4500
 Load (MW)

 4000

 3500

 3000

 9/17 9/24 9/29 10/1 10/8 10/14
 Time
 Actual
 BRT-1
 BRT-2
Figure 14: Comparison for Chinese National Day between actual and forecast loads in 2018. The line representation is the same as in
Figure 12.

7. Discussion for load forecasting work than the ANN model. (2) A sig-
 nificant decline in load values happens on the statutory days
Overall, compared to the BRT-1 model with the original during any public holiday, followed by that on bridging days.
dummy variable, the BRT-2 model with the proposed Moreover, load values on some proximity days also exhibit
indicator variable produced the more accurate predictions different load pattern from normal days. A new indicator
on special days. For these days, the MSE obtained with variable is proposed to capture the abnormal variations. (3)
BRT-2 is 4.8% lower than the MSE obtained with BRT-1, The BRT model with the proposed indicator variable per-
which makes no attempt to model bridging days and forms better than the BRT model with the original dummy
proximity days. However, what needs special explanation is variable, which indicates that the proposed indicator vari-
that although the forecast results on few days are not as able is extremely effective for the prediction accuracy of
expected, the overall situation is still relatively good. Since special days.
the model has learned and trained the load data features of Based on the above research, the prediction results of
2016 and 2017, there may be differences between the special days have been fundamentally improved, and some
forecasting results in 2018 and those in 2016 and 2017. The work has been done in the past for the selection of pre-
slight discrepancy between model learning and reality is dictors. In future work, our research focus will shift to
also in line with the actual situation. In addition, the lag in forecasting models. Considering the predictors used in this
the response of the prediction model appears during the study, some improved algorithms will be adopted and
two long holiday periods of the Chinese New Year and the compared for short-term load forecasting, such as other
National Day. The reason for this phenomenon may be due boosted regression tree [38], SVR with empirical mode
to the high randomness of the load sequence during the two decomposition and autoregression [16], SVR with chaotic
long holiday periods and the few available test data. In GASA algorithm [39], LSSVM, LSSVM with fuzzy time
further work, it is possible to make reasonable adjustments series, and global harmony search algorithm [15].
or further improvement on the model based on actual
applications. Data Availability
8. Conclusion The data used to support the findings of this study are in-
 cluded within the article.
The accuracy of short-term load forecasting on special days
is further improved by incorporating the proposed indicator Conflicts of Interest
variable in the BRT model. Thus, the conclusions of this
paper can be stated as follows: (1) under the same model The authors declare that there are no conflicts of interest
inputs and test data, the BRTmodel is slightly outperforming regarding the publication of this paper.
Computational Intelligence and Neuroscience 15

Acknowledgments ScienceDirect,” International Review of Financial Analysis,
 vol. 71, 2020.
This work was supported in part by the Natural Science [14] G. Xie, Y. Qian, and S. Wang, “Forecasting Chinese cruise
Foundation of Shandong Province under Grant no. tourism demand with big data: an optimized machine
ZR2019QD018, the Croucher Foundation Visitorship for learning approach,” Tourism Management, vol. 82, 2021.
PRC Scholars 2020/21, the National Natural Science [15] Y. Chen, W.-C. Hong, W. Shen, and N. Huang, “Electric load
Foundation of China under Grant no. 11975143, and the forecasting based on a least squares support vector machine
Scientific Research Foundation of Shandong University of with fuzzy time series and global harmony search algorithm,”
 Energies, vol. 9, no. 2, p. 70, 2016.
Science and Technology for Recruited Talents under Grant
 [16] G.-F. Fan, S. Qing, H. Wang, W.-C. Hong, and H.-J. Li,
nos. 2017RCJJ068 and 2017RCJJ069. The authors wish to
 “Support vector regression model based on empirical mode
thank Dr. Yuen Manwai from the Education University of decomposition and auto regression for electric load fore-
Hong Kong for his kind discussion and some English im- casting,” Energies, vol. 6, no. 4, pp. 1887–1901, 2013.
provements of this paper. [17] L. Rokach and O. Maimon, “Top-down induction of decision
 trees classifiers-A survey,” IEEE Transactions on Systems, Man
References and Cybernetics, Part C (Applications and Reviews), vol. 35,
 no. 4, pp. 476–487, 2005.
 [1] S. Arora and J. W. Taylor, “Short-term forecasting of [18] Q. Ding, “Long-term load forecast using decision tree
 anomalous load using rule-based triple seasonal methods,” method,” in Proceedings of the IEEE PES Power Systems
 IEEE Transactions on Power Systems, vol. 28, no. 3, Conference and Exposition, pp. 1541–1543, Atlanta, GA, USA,
 pp. 3235–3242, 2013. November 2006.
 [2] Z. Zhang, W.-C. Hong, and J. Li, “Electric load forecasting by [19] J. Yang and J. Stenzel, “Short-term load forecasting with
 hybrid self-recurrent support vector regression model with increment regression tree,” Electric Power Systems Research,
 variational mode decomposition and improved cuckoo search vol. 76, no. 9, pp. 880–888, 2006.
 algorithm,” IEEE Access, vol. 8, pp. 14642–14658, 2020. [20] Z. Y. Li, “An empirical study of knowledge discovery on daily
 [3] K. Liu, S. Subbarayan, R. R. Shoults et al., “Comparison of very electrical peak load using decision tree,” Advanced Materials
 short-term load forecasting techniques,” IEEE Transactions on Research, vol. 433–440, pp. 4898–4902, 2012.
 Power Systems, vol. 11, no. 2, pp. 877–882, 1996. [21] J. Luo, T. Hong, and S.-C. Fang, “Benchmarking robustness of
 [4] Y. Li, D. Han, and Z. Yan, “Long-term system load forecasting load forecasting models under data integrity attacks,” Inter-
 based on data-driven linear clustering method,” Journal of national Journal of Forecasting, vol. 34, no. 1, pp. 89–104, 2018.
 Modern Power Systems and Clean Energy, vol. 6, 2017. [22] S. Ben Taieb and R. J. Hyndman, “A gradient boosting ap-
 [5] A. D. Papalexopoulos and T. C. Hesterberg, “A regression- proach to the Kaggle load forecasting competition,” Inter-
 based approach to short-term system load forecasting,” IEEE national Journal of Forecasting, vol. 30, no. 2, pp. 382–394,
 Transactions on Power Systems, vol. 5, no. 4, pp. 1535–1547, 2014.
 1990. [23] J. Moon, J. Park, and E. Hwang, “Forecasting power con-
 [6] W. R. Christianse, “Short term load forecasting using general sumption for higher educational institutions based on ma-
 exponentitials smoothing,” IEEE Transactions on Power Ap- chine learning,” The Journal of Supercomputing, vol. 3,
 paratus and Systems, vol. 90, pp. 900–911, 1971. pp. 1–23, 2017.
 [7] J. W. Taylor, “Short-term load forecasting with exponentially [24] Z. Shi, Y. Li, and T. Yu, “Short-term load forecasting based on
 weighted methods,” IEEE Transactions on Power Systems, LS-SVM optimized by bacterial colony chemotaxis Algo-
 vol. 27, no. 1, pp. 458–464, 2012. rithm,” in Proceedings of the International Conference on
 [8] S. Kelo and S. Dudul, “A wavelet Elman neural network for Information and Multimedia Technology, pp. 306–309, Jeju,
 short-term electrical load prediction under the influence of Republic of Korea, December 2009.
 temperature,” International Journal of Electrical Power & [25] M. D. Ruiz-Abellón, A. Gabaldón, and A. Guillamón, “Load
 Energy Systems, vol. 43, no. 1, pp. 1063–1071, 2012. forecasting for a campus university using ensemble methods
 [9] A. S. Khwaja, X. Zhang, A. Anpalagan, and B. Venkatesh, based on regression trees,” Energies, vol. 11, no. 8, 2018.
 “Boosted neural networks for improved short-term electric [26] J. Nowicka-Zagrajek and R. Weron, “Modeling electricity
 load forecasting,” Electric Power Systems Research, vol. 143, loads in California: ARMA models with hyperbolic noise,”
 pp. 431–437, 2017. Signal Processing, vol. 82, no. 12, pp. 1903–1915, 2002.
[10] S. Singh, S. Hussain, and M. A. Bazaz, “Short term load [27] G. A. Darbellay and M. Slama, “Forecasting the short-term
 forecasting using artificial neural network,” in Proceedings of demand for electricity,” International Journal of Forecasting,
 the Fourth International Conference on Image Information vol. 16, no. 1, pp. 71–83, 2000.
 Processing (ICIIP), pp. 1–5, Shimla, India, December 2017. [28] S. Arora and J. W. Taylor, “Rule-based autoregressive moving
[11] Y. Gao, Y. Fang, H. Dong, and Y. Kong, “A multifactorial average models for forecasting load on special days: a case
 framework for short-term load forecasting system as well as study for France,” European Journal of Operational Research,
 the jinan’s case study,” IEEE Access, vol. 8, vol. 266, 2017.
 pp. 203086–203096, 2020. [29] K.-B. Song, Y.-S. Baek, D. H. Hong, and G. Jang, “Short-term
[12] S. M. Hosseini and N. Mahjouri, “Integrating support vector load forecasting for the holidays using fuzzy linear regression
 regression and a geomorphologic artificial neural network for method,” IEEE Transactions on Power Systems, vol. 20, no. 1,
 daily rainfall-runoff modeling,” Applied Soft Computing, pp. 96–101, 2005.
 vol. 38, pp. 329–345, 2016. [30] M. López, C. Sans, S. Valero, and C. Senabre, “Classification of
[13] A. Samitas, E. Kampouris, and D. Kenourgios, “Machine special days in short-term load forecasting: the Spanish case
 learning as an early warning system to predict financial crisis- study,” Energies, vol. 12, 2019.
16 Computational Intelligence and Neuroscience

[31] R. Lamedica, A. Prudenzi, M. Sforna, M. Caciotta, and
 V. O. Cencellli, “A neural network based technique for short-
 term forecasting of anomalous load periods,” IEEE Trans-
 actions on Power Systems, vol. 11, no. 4, pp. 1749–1756, 1996.
[32] A. Pardo, V. Meneu, and E. Valor, “Temperature and sea-
 sonality influences on Spanish electricity load,” Energy Eco-
 nomics, vol. 24, no. 1, pp. 55–70, 2002.
[33] A. Rafati, M. Joorabian, and E. Mashhour, “An efficient hour-
 ahead electrical load forecasting method based on innovative
 features,” Energy, vol. 201, 2020.
[34] H. Dong, Y. Gao, X. Meng, and Y. Fang, “A multifactorial
 short-term load forecasting model combined with periodic
 and non-periodic features—a case study of Qingdao, China,”
 IEEE Access, vol. 8, pp. 67416–67425, 2020.
[35] L. Breiman, J. H. Friedman, R. A. Olshen, and C. J. Stone,
 “Classification and regression trees (CART),” Biometrics,
 vol. 40, no. 3, 1984.
[36] L. Breiman, “Bagging predictors,” Machine Learning, vol. 24,
 no. 2, pp. 123–140, 1996.
[37] F. Harrou, A. Saidi, and Y. Sun, “Wind power prediction using
 bootstrap aggregating trees approach to enabling sustainable
 wind power integration in a smart grid,” Energy Conversion
 and Management, vol. 201, 2019.
[38] J. Elith, J. Leathwick, and T. RHastie, “A working guide to
 boosted regression trees,” Journal of Animal Ecology, vol. 77,
 no. 4, pp. 802–813, 2008.
[39] W. Y. Zhang, W.-C. Hong, Y. Dong, G. Tsai, J.-T. Sung, and
 G.-f. Fan, “Application of SVR with chaotic GASA algorithm
 in cyclic electric load forecasting,” Energy, vol. 45, no. 1,
 pp. 850–858, 2012.
You can also read