The Skincare project, an interactive deep learning system for differential diagnosis of malignant skin lesions. Technical Report
←
→
Page content transcription
If your browser does not render page correctly, please read the page content below
The Skincare project, an interactive deep learning
                                           system for differential diagnosis of malignant skin
                                           lesions. Technical Report
                                           Daniel Sonntag1 , Fabrizio Nunnari1 , and Hans-Jürgen Profitlich1
                                           1 German   Research Center for Artificial Intelligence, Saarbrücken, Germany
arXiv:2005.09448v1 [eess.IV] 19 May 2020

                                           ABSTRACT

                                           A shortage of dermatologists causes long wait times for patients who seek dermatologic care from general practitioners. In
                                           addition, the diagnostic accuracy of general practitioners has been reported to be lower than the accuracy of artificial intelligence
                                           software. This article describes the Skincare project (H2020, EIT Digital). Contributions include enabling technology for clinical
                                           decision support based on interactive machine learning, a reference architecture towards a Digital European Healthcare
                                           Infrastructure (also cf. EIT MCPS), technical components for aggregating digitised patient information, and the integration of
                                           decision support technology into clinical test-bed environments. However, the main contribution is a diagnostic and decision
                                           support system in dermatology for (1) patients and (2) doctors, an interactive deep learning system for differential diagnosis of
                                           malignant skin lesions. In this article, we describe its functionalities and the user interfaces to facilitate machine learning from
                                           human input. The baseline deep learning system, which delivers state-of-the-art results and the potential to augment general
                                           practitioners and even dermatologists, was developed and validated using de-identified cases from a dermatology image data
                                           base (ISIC), which has about 20000 cases for development and validation, provided by board-certified dermatologists defining
                                           the reference standard for every case. ISIC allows for differential diagnosis, a ranked list of eight diagnoses, that is used to plan
                                           treatments in the common setting of diagnostic ambiguity. We give an overall description of the outcome of the Skincare project
                                           (2019 and 2020), and we focus on the steps to support communication and coordination between humans and machine in
                                           interactive machine learning. This is an integral part of the development of future cognitive assistants in the medical domain,
                                           and we describe the necessary intelligent user interfaces. Future work will be needed to prospectively assess the clinical
                                           impact of using this interactive tool extension in actual clinical workflows.

                                           1 Introduction
                                           Recent advances in deep learning have facilitated the development of artificial intelligence tools to assist in diagnosing skin
                                           cancer from dermatoscopic images. We combine patient records with images from the smartphone without a dermatoscope
                                           (macroscopic images) and dermatoscopic images with a dermatoscope (microscopic images) for knowledge discovery and
                                           knowledge acquisition toward decision support and services in clinical and non-clinical environments. Input modes include
                                           smartphones for a direct digitisation of patient data and images. Prior works have focused on the visual recognition of skin
                                           lesions from dermoscopic images, which requires a dermatoscope. The innovative aspect is a holistic view on individual patients
                                           based on teledermatology, whereby patient data and lesions photographed with a mobile device can be taken into account
                                           for clinical decision support. In order to provide such a system, many technical questions around machine learning and the
                                           interaction with the domain user have to be answered. The starting point is a system based on microscopic (dermoscopic) images,
                                           to be augmented by macroscopic images after the deployment of the system. Our baseline visual classification system provides
                                           a differential diagnosis across 8 conditions: "Melanoma", "Melanocytic nevus", "Basal cell carcinoma", "Actinic keratosis",
                                           "Benign keratosis (solar lentigo / seborrheic keratosis / lichen planus-like keratosis)", "Dermatofibroma", "Vascular lesion", and
                                           "Squamous cell carcinoma". The images and classifications stem from The International Skin Imaging Collaboration (ISIC);
                                           this is a combined academia and industry effort aimed at improving melanoma diagnoses and reducing melanoma mortality by
                                           facilitating the application of digital skin imaging technologies, see https://dermoscopedia.org/ISIC_project.
                                               Image labelling enabled by explainable deep learning technology should enhance dermatologists’ interactions with such
                                           instances of interactive machine learning (IML) systems in the future. We give an overall description of DFKI’s main outcome
                                           of the Skincare project, focussing on its functionalities, and the user interfaces to facilitate machine learning from human
                                           input: section 2 lists the objectives of the project in more detail. Section 3 gives an overview of the functionalities offered
                                           by the system. Section 4 illustrates the overall software architecture of the system. Section 5 describes the end-user interface
                                           implemented to enable a stand-alone and interactive use of the decision support and interactive machine learning system.
                                           Section 6 describes the REST API of the intelligent user interface’s web page.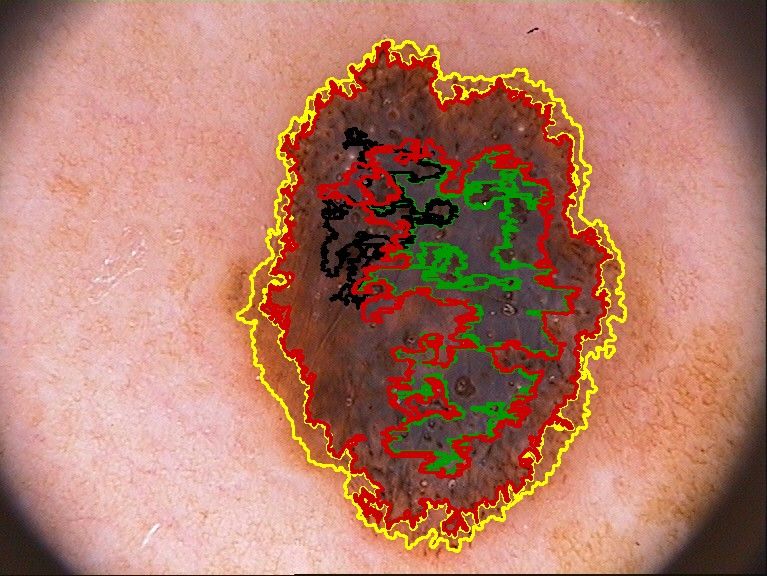
2 Objectives
The goal of the project Skincare (see http://ai-in-medicine.dfki.de/) is to develop a decision support system
for the diagnosis of malignant skin lesions (e.g., Melanoma). Contributions include enabling technology for clinical decision
support based on interactive machine learning, a reference architecture towards a Digital European Healthcare Infrastructure
(also cf. EIT MCPS), technical components for aggregating digitised patient information (patient record and teledermascopic
images), and the integration of decision support technology into clinical test-bed environments. However, the main contribution
is a diagnostic and decision support systems in dermatology towards an interactive deep learning system for differential
diagnosis of malignant skin lesions.
     The software should support the dermatologists on several aspects: i) providing a colour analysis of the image, ii)
highlighting regions of interest (RoIs) on the images, iii) proposing a differential diagnosis. The interactive learning system
runs on top of this decision support system, to elicit user feedback via a graphical user interface (GUI) for improving the
machine learning model. However, core functionalities of the system must be GUI-agnostic and available for all the partners
of the project. They will be made available as a stand-alone web service accessible through a REST API. On top of that, a
web-based GUI will allow dermatologists to interactively use and improve the system.
     From a machine learning perspective, we provide an environment for grounding decisions based on visualisations of skin
anomalies (and the internal workings of the machine learning systems) to identify and visualise such anomalies. More precisely,
and similar to [1] we create attention maps to provide more interpretable output as opposed to only outputting a classification
label of the whole image without internal structure. In addition, the segmentation explained in section 3 delivers medical visual
prior information (as opposed to background information about the patient) to boost the classification performance and deliver
better localisations of attention maps indicating specific regions of the images. This should help, in the end, to gain insights
into which image regions contribute to the results. A further question is how to train future models to focus on the expected
regions of interest (ROIs) and validate the effectiveness of ROI priors.
     Focussing on the visual analytics and machine learning part, the objective is to support model explanation and interpretation
for deep learning decisions based on ROIs relevant for classification. Model debugging and improvement are additional
objectives. In addition to the general aim of democratising machine learning for non-experts, we tackle the challenge of
interpretability and transparency of blackbox models for the medical expert. A general sense of model understanding should be
essential for medical decision support. A recent survey on visual analytic and deep learning classifies such systems around
attention maps and heatmaps for image classification [2]. Our recent survey at DFKI focusses on actual tools for visual analytics
in machine learning in addition. Here, an interpretation is a special form of explanation, where we show the predictions
by elucidating the (spatial) mechanism by which the model works. This interpretation is the mapping of an image and its
classification into a domain (e.g., the locations-based heatmap) the medical expert can make sense of. This interpretation of the
concepts interpretability and explainability are in line with recent definition in the scientific community [3, 4]. Also, insights for
social sciences suggest that explanations in AI-based decision making processes should have a structure that the domain experts
can accept [5]; location-based heatmaps as used here are not controversial to how doctors explain malignant skin lesions to
each other and can serve as a useful starting point for explaining computer-aided differential diagnosis in the medical domain.
     In the Skincare project, we visualise feature spaces by using visual detectors of ROIs. By visualising ROIs of correctly
classified image instances (or misclassified ones), we gain insight and an intuitive understanding of how the dermatology
recognition system works. The identification of the ROIs is performed using algorithms fostering the explainability of decisions
taken by deep learning approaches. In image classification problems solved with CNNs, identifying ROIs corresponds to
identifying the groups of pixel that contribute to the final classification choice. The granularity of the groups depends on the
explainability technique. Each group is also associated to a quantification of the contribution, called saliency. The output of an
explanation algorithm is called saliency map, which is often converted into a heat map, via a direct gray-scale-to-color scheme
conversion, for both aesthetic reasons and an easier human interpretation.
     The algorithms for attributing important regions and feature visualisation either highlight important regions of the image
(attribution) or create a heatmap that is representative of the features for a given class, e.g., melanoma. We generate translucent
heatmaps in real-time as overlays to highlight important regions that contribute to the AI-based classification. It is important to
note that we visualise the deep learning process after training, hence we perform a dermatology image instance-based analysis
and exploration; a further interactive experimentation task is explained further down. For the Skincare project, we use two
visual explanation techniques with translucent overlays: GradCAM [6] and RISE [7]. GradCAM computes heatmaps through
an analysis of the CNN structure, namely, by measuring the intensity of the inner activation values at a given convolution stage.
Complementarily, RISE uses a stochastic method; an input image is repeatedly classified while being bombed with masking
noise (grid of black quadrants) at random frequencies and phases, while the contribution of each pixel to the classification of
the input sample is accumulated.
     The GradCAM algorithm is very fast and memory-saving, as it requires only a single pass of forward and back-propagation
through the network, but the final resolution of the saliency map is limited by the resolution of the last convolutional layer.

                                                                                                                                2/20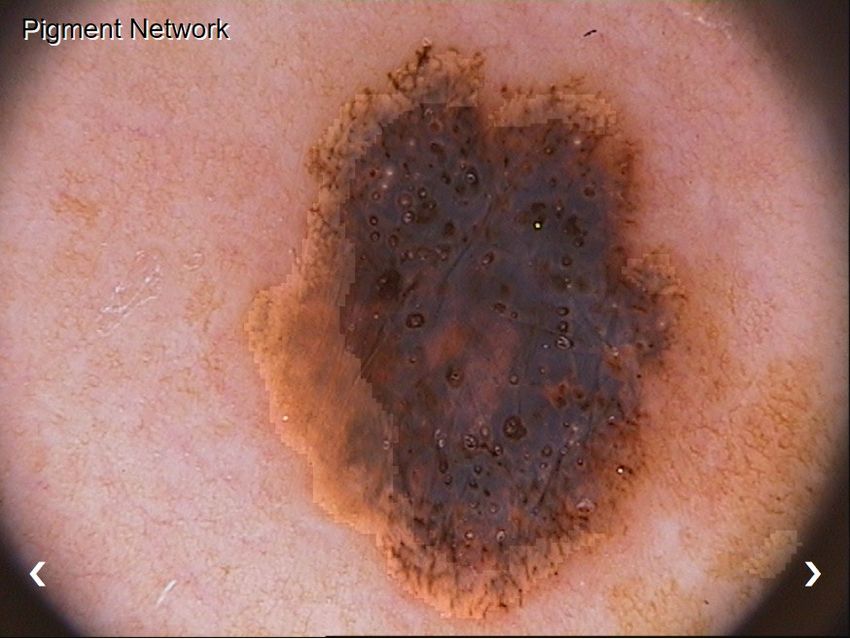
Figure 1. Basic architecture of the VGG16 CNN for image classification

RISE can potentially reach very high image resolutions, but its applicability is limited by the quantity of computer memory
available for the accumulation matrix and the time needed to repeat multiple (likely more than 1000) predictions to achieve
reliable results. Both methods can be triggered via the web page as shown in figures 12 and 13.

3 Functionalities
The Skincare system allows the user to interact with a classifier to detect malign lesions. After uploading dermatological
images, the user can start an analysis which delivers the following results (see also figures 9 and 10):

   • a binary classification of images between benign or malign or an 8-class classification (partly based on the following
     segmentation and feature extraction steps);
   • a segmentation of the lesion, i.e., a separation of the areas pertaining to the lesion from the rest of the healthy skin. One
     version of the segmentation is implemented by a neural network (pixel-oriented); a second version is implemented by
     visual image preprocessing techniques (visual filter-oriented colour analysis).
   • feature extraction: the identification of five types of dermoscopic feature patterns: globules, streaks, pigment network,
     milia-like cyst, and negative network;
   • feature extraction: numerical indicators for borders, diameters, and asymmetries;
   • feature extraction: graphical features supporting the ABCD rule including segmentation, color areas, and asymmetries.

    Additionally, the user can upload sets of benign and malign images and evaluate the classification results under different
thresholds for malignity. A wide number of quality measures are computed and presented graphically.

3.1 Binary Classification (Malignant vs. Benign)
Classification is the task of assigning an input image to one of several pre-defined categories. The classifier is based on a
VGG161 [8] deep convolutional neural network (see figure 1) trained on a set of about 25000 lesion images downloaded from
the open ISIC repository in February 2019. The architecture has 5 convolution blocks, each appended with 2x2 max pooling
layer. The convolution blocks are followed by 2 fully connected layers (fc1, fc2) followed by a softmax (sigmoid+multinomial)
activation instead of the original ReLU activation. We tried different number of neurons in fc1 and fc2 layers, ranging from 512
to 4096 in powers of 2, and found that 2048 gives the best performances.
    The network has been trained by applying transfer learning from the original version, which was trained for the classification
among 1000 classes on the ImageNet dataset [9]. As common practice in transfer learning, we kept the pre-trained weights
of the convoutional layers and modified the final part of the network to accommodate the classification among a reduced set
of classes (currently two, malignant or benign, or the eight classes mentioned in the introduction). As a preprocessing step,
  1 http://www.robots.ox.ac.uk/~vgg/research/very_deep/

                                                                                                                             3/20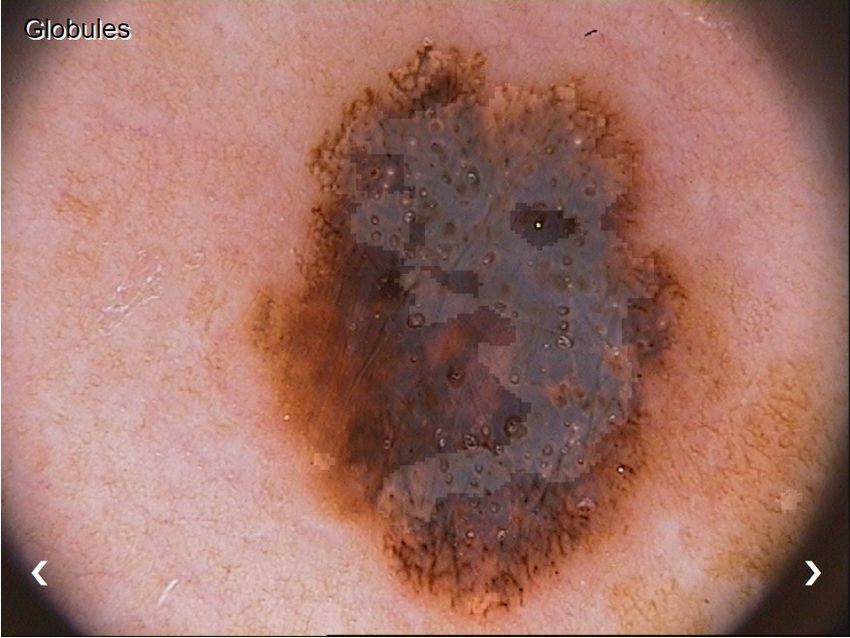
Class       MEL            NV       BCC       AK      BKL       DF    VASC      SCC      Tot
                          Count       4346     10632         3245      845     2333      235      222     622    22480
                          Pct        17.8%     50.8%        13.1%     3.4%    10.4%     1.0%     1.0%    2.5%    100%

                                      Table 1. Class distribution in the ISIC 2019 training set.

                            Lesion           MEL           NV        BCC      AK       BKL      DF      VASC    SCC
                            Frequency        17.8%        50.8%     13.1%    3.4%     10.4%    1.0%     1.0%    2.5%
                            Accuracy         0.844        0.824     0.925    0.962    0.918    0.985    0.995   0.970
                            Specificity      0.892        0.895     0.953    0.975    0.951    0.986    0.996   0.977
                            Sensitivity      0.626        0.756     0.738    0.570    0.634    0.783    0.880   0.694
                            ROC AUC          0.867        0.920     0.960    0.955    0.921    0.964    0.991   0.953

                                  Table 2. Performance metrics of the 8-class classification model.

images are cropped and scaled to a resolution of 450x450 pixels. During learning, we used stochastic gradient descent (SGD)
with Nesterov acceleration. The learning rate is 0.0001 with 0.9 momentum. We used the weight decay policy with coefficient
0.0001. We performed a 48-times data augmentation by both flipping and rotating each image 24 times (15 degree steps), as
suggested by Fujisawa et al. [10]. Additional details about the CNN structure, training parameters, and performances can be
found in [11]. What follows is the description of the 8-class classification. Future extensions will provide a more fine-grained
classification of the most common lesion types of the medical literature.

3.2 8-class Classification
Our baseline visual classification system provides a differential diagnosis across 8 conditions: "Melanoma (MEL)", "Melanocytic
nevus (NV)", "Basal cell carcinoma (BCC)", "Actinic keratosis (AK)", "Benign keratosis (BKL)", "Dermatofibroma (DF)",
"Vascular lesion (VASC)", and "Squamous cell carcinoma (SCC)". The model is trained using the same dataset provided from
the ISIC2019 challenge2 . The distribution among the classes is reported at the top of table 1.
    The classification of the 8 types of lesions is performed by the same architecture used for binary classification (see figure 1),
with the difference in the number of outputs.
    For these models, we used ∼20k images for training, and the remaining images are equally divided for validation and test.
Training the Model-8cls for 10 epochs using an 9th gen 8-core i7 CPU and an NVIDIA RTX TITAN GPU (24 GB RAM) took
about 3 days and 17 hours. With the available GPU memory we could train with a batch size of 16.
    Table 2 shows the state-of-the-art results on the test set (∼1.5k samples) in terms of Accuracy, Specificity, Sensitivity,
and ROC AUC, together with the distribution of image samples. In general we can observe that the model performs better in
specificity (up to 0.996 for the VASC class) rather than sensitivity (with a lower value of 0.570 for class AK). Interestingly,
better results are obtained for classes with less samples than for classes with more samples, probably because of the specific
morphology of such pathologies.

3.3 Presentation of classification results (Confidence)
Given an image to classify, neural networks output a probability distribution, i.e., they associate a real number between 0 and 1
to each of the classes for which the network is trained. The numbers, i.e., probabilities (p), sum up to 1.0. Typically, the results
of the classification are presented to a user by selecting the class with the highest p-value, or by selecting a fixed-size list of the
top k images with the highest p-values.
    However, this method of presenting the classification results can lead to erroneous interpretation about the reliability or
confidence of the classification. For example, consider a binary classification between benign or malignant lesions. Given an
image, the system returns a probability distribution of p = 0.51 for benign and p = 0.49 for malignant. It is common practice
to simply select the class with the highest p-value and inform the users that the analysis resulted in a verdict for benign, thus
hiding the ambiguity of the decision. Of course, presenting the user with all the p-values would give him or her more detailed
information. However, these are harder to interpret when performing a classification on multiple classes, where p-values for
non-top-1 classes can be small numbers, very close to 0.
    Hence, we use a methodology which presents a variable number of top images according to a level of confidence c,
which is computed on the p-value as the percentage on the range between a uniform distribution threshold u (1.0 divided by
the number of classes) and 1.0. Back to the previous example on 2 classes, p = 0.51 would lead to c = 0.5% confidence,
   2 https://challenge2019.isic-archive.com/

                                                                                                                                 4/20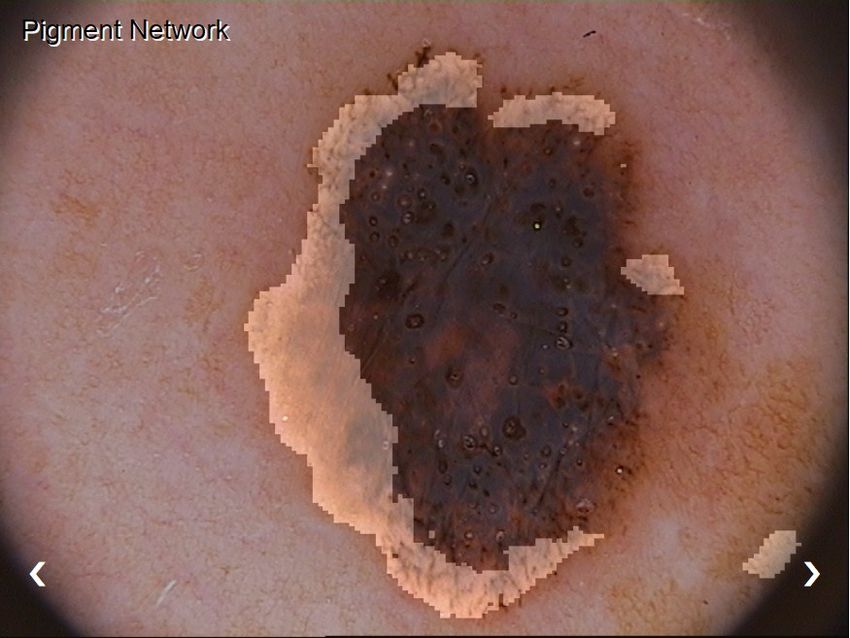
Conv 3x3x3 + ReLu Skip connection Upsampling
Max - pooling (by 2) Concatenation
Figure 2. The architecture of the U-Net used for lesion segmentation. The input image is 3-channels RGB, while the output
image is 1-channel gray-scale with the same resolution.
p = 0.75 → c = 50%, and p = 1.0 → c = 100%. More formally, given n classes:
p−u
c= ∗ 100
1.0 − u
where u = 1/n, n is the number of classes, and images are presented to the user only if p > u. The rationale behind this is to
discard all images whose p is below the threshold of pure uniform probability distribution (total uncertainty). For example,
consider an 8-class classification problem (where u = 0.125) where an image gets p = 0.67 for Benign Keratosis, p = 0.28 for
Melanoma, and p < 0.125 for all other classes. The system will show to the user that the classification is likely to be Benign
Keratosis with confidence 62.4%, but also likely a Melanoma with confidence 17.4%.
3.4 Segmentation (with CNN)
Segmentation is the task of tracing a contour on the image in order to separate the lesion area of the skin from the healthy part.
The segmentation task is performed by a masking model based on the U-Net architecture [12], which is a (de-)convolutional
deep neural network for pixel-level classification. The model was trained using data from the ISIC 2018 Task 1, where the
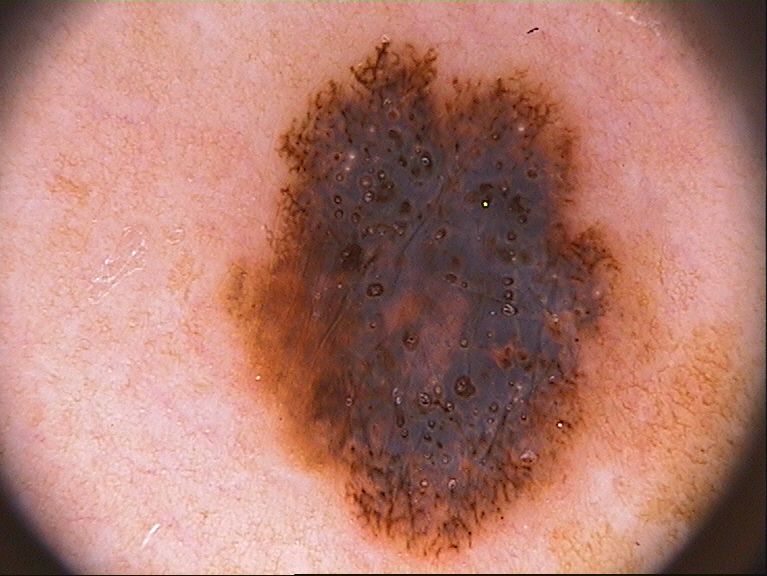
input are 2594 skin lesion images in RGB colour format (see figure 3a) and, for each sample, the ground truth is a binary
mask of the same resolution of the input image (e.g., figure 3b). The ground truth masks have been created by filling the
manually-traced contour of lesions (by dermatologists). Hence, a white pixel in the mask indicates a pixel pertaining to the
lesion in the corresponding RGB image, while black pixels are associated with the surrounding skin.
Figure 2 shows the U-Net architecture together with a sample input and output. The architecture is composed of 9
convolution blocks, each of them is a pair of 2D same convolutions with stride 3x3x3. Downsampling is the result of a
max-pooling with size 2x2. Upsampling is the result of a 2x2 transposed 2D same convolution. After each upsampling
step, the convolution is performed on the concatenation between the upsampling result and the output of the downsampling
with corresponding resolution. The initial number of filters (32) doubles at each downsampling. For this work, we used an
input/output resolution of 180x180 pixels.
To train the U-Net we randomly sampled 20% of the total 2594 images as a test set, and extracted another 5% of the
remaining samples for a final distribution of 2075/104/415 images for training/validation/test. Images in the training set were
pre-processed to center data by subtracting the mean per channel and scaled to match the input resolution of U-Net. After
prediction, the output images are converted into binary masks using a threshold of 0.5.
We trained the U-Net for 100 epochs, optimising for cross-entropy loss, reaching the lowest loss after 40 epochs, and
obtained a Jaccard index J=0.75. The Jaccard index constrains the generated lesion boundaries to be spatially and geometrically
precise invariant of lesion contours; it computes the expectation of pixel-wise similarity between a predicted image segmentation
5/20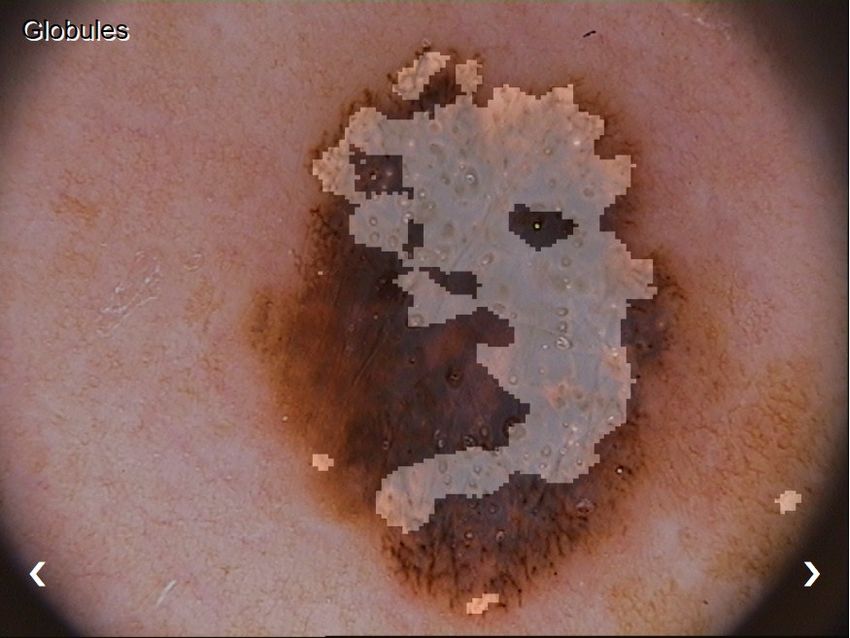
a) original                          b) segmentation                   c) segmentation overlay (0.9)

                       Figure 3. Segmentation: a) original image, b) DL-based segmentation, c) overlay

and its corresponding ground truth as a measure of the intersection over union. The Jaccard Index is defined as:

                      ∑ ytruth y predict
      J=                                                                                                                      (1)
           ∑ ytruth + ∑ y2predict − ∑ ytruth y predict
              2

where ytruth and y predict represent the ground truth and predicted pixel values respectively, with y ∈ {0, 1}, with sums taken
over the dimension of the image.
    The current implementation computes segmentation masks of a resolution of 180x180 pixels, which are then re-scaled to
the resolution of the original image for overlapping and interactive masking (see figure 3c with overlay 0.9).

3.5 Segmentation (visual filter-oriented colour analysis)
Dermoscopic images may contain artefacts, such as hairs, ruler markings, air bubbles, and uneven illumination. The first stage in
this segmentation pipeline towards classifying involves some preprocessing of the captured image, in order to remove the effects
of such artefacts, reduce noise, and enhance the image contrast in the image. In this preprocessing step, color transformation is
performed first, where the RGB image is converted to the Y’UV color space that separates the color (chroma) component from
the illumination component of the image. This conversion helps the classification process to perform consistently under varying
illumination conditions.
    To reduce unwanted effects of further artefacts, the image is smoothed by a two-dimensional (2-D) Gaussian filter [13–16],
that produces an image by performing convolutions of the filter with the image. The size of the filter is determined by its kernel
value k, where large kernel values significantly blur the image and weaken the borderline along with noise, whereas small
kernel values do not reduce the noise to a desirable extent. Tests showed that a kernel of k = 5 and a standard deviation of
σ = 1 provide the best results. Alternative filters are median [17–19], and anisotropic diffusion filters [20, 21].
    A number of segmentation algorithms have been reported in the literature, such as the edge detection [21, 22], thresholding
[23], and active contour methods. Some segmentation algorithms are very sensitive to noise and require high-contrast images,
sometimes in addition to input from the user to adjust the segmented region. Recently active contour algorithms have come
up, where a flexible curve narrows until it fits the boundary of the ROI. Active contour algorithms can be categorised as
parametric or geometric based on the curve tracking method. Parametric models have difficulties in handling ROIs with large
curvatures and topological changes [18, 24]. The geometric active contour model improves by adapting to topological changes.
Generally speaking, active contour models involve solving partial differential equations (PDEs) for curve evolution, creating a
computational burden [25]. One popular geometric active contour model is known as the Chan–Vese model [20, 26]. SkinCare
uses a modified Chan–Vese model that runs in real-time with fast level-set approximation [27]. The model updates the curve
during each evolution until it fits the boundary of the object of interest. Figure 4 shows the processing steps from the original
image (a), shrinking surrounding circles (b), the resulting contour of the ROI, to the final segmented lesion. This computation
of segmentation is completely based on computer vision algorithms whereas the segmentation described in section 3.4 is based
on a pixel-wise CNN mask.

3.6 Feature Extraction (U-Net)
Feature extraction is the task of identifying the areas of a skin lesion presenting the visual patterns of specific dermoscopic
features. In the Skincare project, the identification of each of the features has been implemented using a U-net [12] (de-)
convolutional neural network on the dataset provided for the Task 2 of the ISIC 2018 challenge3 . The Skincare platform
currently recognises five type of features: globules, streaks, pigment network, milia-like cyst, and negative network (see figure
  3 https://challenge2018.isic-archive.com/task2/

                                                                                                                             6/20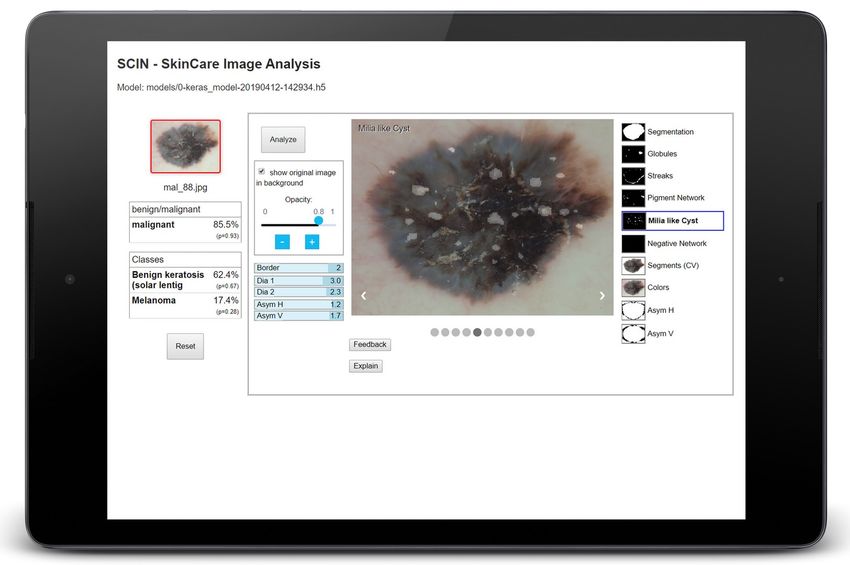
a)                                 b)                                 c)                                 d)

Figure 4. Segmentation steps: a) original image, b) active contours evolution steps, c) active contours result, d) resulting
segmentation of the lesion.

                    a) original                            b) globules                             c) streaks

                d) pigment network                      e) milia-like-cyst                    f) negative network

                                                Figure 5. Features of an image

5). Each of the five attributes is identified by a dedicated neural network. Hence, the same pixel might be identified by the
platform as pertaining to more than one category.
    The current implementation computes area masks of resolution 180x180 pixels, which are then re-scaled to the resolution
of the original image for overlapping and interactive masking. The advantage of overlays, whose transparency can be easily
configured via a slider, is shown in figure 6.

3.7 Feature Extraction (visual filter-oriented colour analysis)
The Asymmetry feature stems from the fact that lesion images are generally not symmetric with the major x–y axes of the
images. However, to judge if there is any asymmetry in shape, the lesion axes must be aligned to the major axes of the image.
To first accomplish this alignment, it is necessary to transform the segmented image by finding the lesion’s minimum enclosing
rectangle and extracting the rectangular matrix from the image. This matrix provides the major and minor axes, along with the
tilt angle of the rectangle. Next, we calculate the rotation matrix from the tilt angle and transform the segmented image to
the rotated image. The asymmetry score is calculated from a total of eight parameters. The first two parameters, vertical and
horizontal asymmetry, are calculated by overlapping the binary form of the warped segmented image with the mirror images in
vertical and horizontal directions. The sum of all the non-zero pixels in the image is computed and the asymmetry level (AS) is
calculated as a percentage of these non-zero pixels in the overlapped image over the lesion area. The remaining six parameters
refer to the asymmetry in structure and are calculated as the distance between the lesion centroid and the weighted centroids of
the color contours (obtained from the colour variegation feature). The Border irregularity feature is generally defined as the
level of deviation from a perfect circle and measured by the irregularity index. The minimum value of the irregularity index
corresponds to a perfect circle. The Diameter greater than 6 mm feature refers to the size of a lesion. The diameter of the lesion
is calculated from the side length of the minimum area rectangle and the conversion factor from pixels to millimeters. The
Color variegation feature indicates the number of colours of the lesion from the HSV (Hue, Saturation, and Value) image by
grouping all pixels with HSV values within a given range. The predefined color set includes the colours white, red, light brown,

                                                                                                                             7/20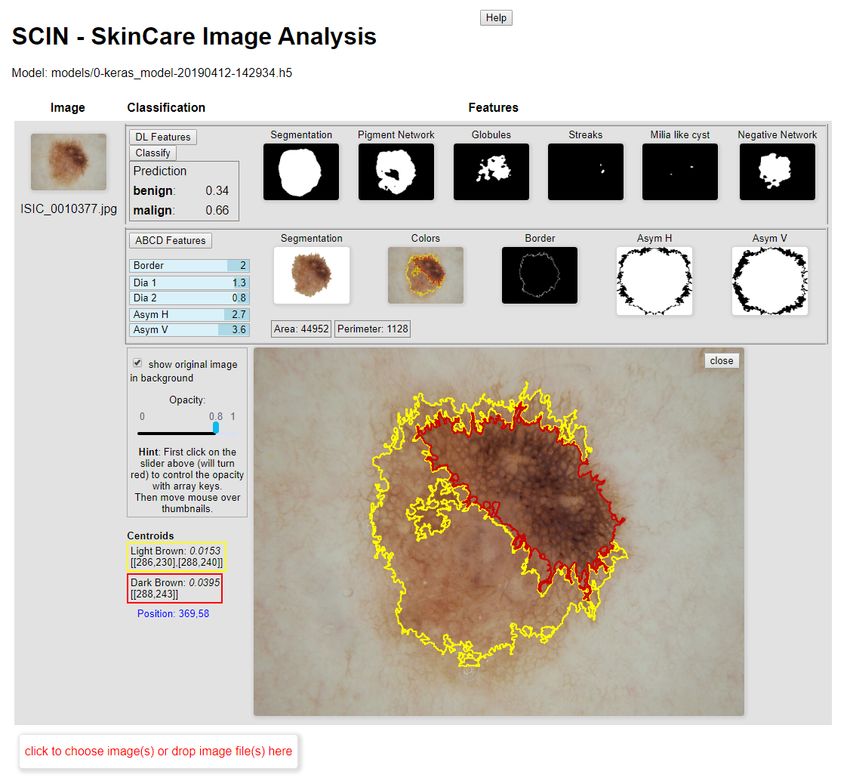
a) original             b) pigment network mask       c) pigment network               d) pigment network
                                                                   visualised as overlay (0.7)      visualised as overlay (0.9)

             e) original                 f) globules mask          g) globules visualised as        h) globules visualised as
                                                                   overlay (0.7)                    overlay (0.9)

                 Figure 6. Advantage of overlays: transparency can be controlled by user, here: 0.7 and 0.9

dark brown, blue-gray, and black. In general, a benign mole has one or two colours while a malignant mole may have more
than three colours.

                               a) original                                            b) colour regions

      Figure 7. Colour variegation: a) original image, b) image showing 4 different colour regions (see also figure 9)

     These (numerical) feature values are projected into a range of [0..10] and displayed in the web page (see the blue bars
in figures 9 and 10) as A1/A2: horizontal resp. vertical asymmetry, B: irregularity index of the border, D1/D2: the diameter
values (horizontal resp. vertical). The colour variegation is directly visualised as one of four images shown in the web page (see
figure 9 for more details of the presentation in the web page).

3.8 The ABCD Rule
Melanoma detection can be done following the so-called ABCD rule which stands for Asymmetry, Border irregularity, Color
variegation, and Diameter greater than 6 mm. The ABCD rule is well known and described in various scientific articles,
e.g. [28–30]. According to [31], the ABCD rule is the most popular and most effective algorithm for ruling out melanoma
among all the computerised methods for melanoma detection. There are other prominent clinical methods for early melanoma
detection. The ABCDE method extends the ABCD rule by adding the evolution of the lesion (e.g., elevation, enlargement, and
color change). Although the ABCDE rule has been validated in clinical practice, no randomised clinical trials have shown that
there is an improvement in the early detection of melanoma [32, 33].
    Colour, architectural disorder, symmetry, and homogeneity/heterogeneity of mole structures are used in the in the C.A.S.H.
algorithm [34] (which has a lower specificity compared to the ABCD rule [35, 36].) Video microscopy and epifluorescence are
used for pattern analysis to categorise the type of skin lesion based upon its general appearance, border, surface, pigmented

                                                                                                                                  8/20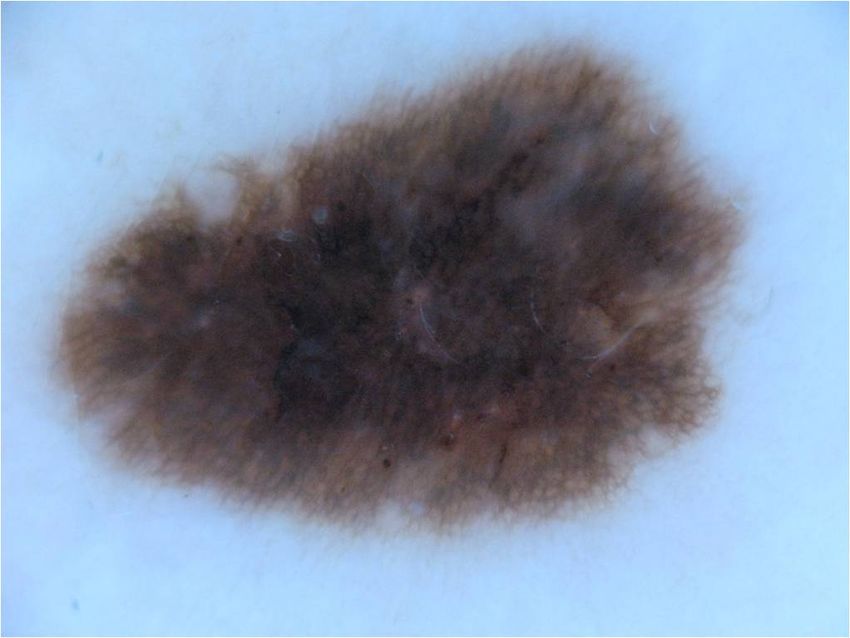
Figure 8. Skincare Basic Architecture: The web page interacts with the HTTP server, that integrates proxy entries for the
different flask servers in the backend.

patterns, and depigmentation [37,38]. The Glasgow seven-point checklist performs diagnosis on three major features (change in
size of lesion, irregular pigmentation, and irregular border) and four minor features (inflammation, itching sensation, diameter
greater than 7 mm, and oozing of lesions) [32, 35, 39–41]. Because of its inherent complexity, it is not widely adopted and
has a lower pooled sensitivity than the ABCD rule [42]. Image acquisition methods have been developed to differentiate
the amount of light absorbed, transmitted, or back-scattered by the melanin part of a lesion. Examples of such methods are
reflectance confocal microscopy, hyperspectral imaging, and optical coherence tomography [36]. However, these methods
aren’t standardised yet to accurately calibrate absorbance and reflectance from the image. Ultrasound technology and electrical
bioimpedance measurements are used to retrieve information about the inflammatory process in the skin. However, these
ultrasound images are difficult to interpret and the electrical impedance of the skin can vary greatly based on age, gender, and
body location [35].
     Pattern analysis and the ABCD rule are the oldest and most widely adopted methods for melanoma detection [43] by
dermatologists; therefore is is very suitable for building an automatic AI-based system for it. The SkinCare system includes
and extends the software described in [44] which is available on github4 . The software uses the SVM classification algorithm
and was trained on the PH2 data set [45].
     In order to further support the medical judgement of an image, the user interface includes a segmentation based on CNN or
filter-based computer vision, relevant colour areas (so called centroids), the graphics that visualise the asymmetry values and
numeric values for asymmetry, borders, and diameters (second row of images titled ‘ABCD Features’ and the information left
of the large image in figure 9). More information about the user interface is provided in section 5.

4 Architecture
Figure 8 shows the basic architecture of the Skincare system.
    The back-end consists of an HTTP server that delivers the static HTML pages and interacts with the flask5 servers wrapping
the classification networks and other Python libraries. This ensures maximum flexibility in adding/exchanging computational
services. The front-end consists of several web pages for the intelligent user interfaces which are described in detail in the next
section. In the future, more multimodal interfaces [46] can be built with the help of domain-specific speech-based dialogue
systems [47].

5 Intelligent User Interfaces
The Skincare graphical user interfaces comprises of three web pages:

Classification page (decision support): (http://www.dfki.de/skincare/classify.html) A page to upload im-
      ages and start different image analysis processes (‘Deep Learning features’, classification and ‘ABCD Features’ (see
  4 https://github.com/ukalwa/melanoma-detection-python
  5 http://flask.palletsprojects.com/

                                                                                                                              9/20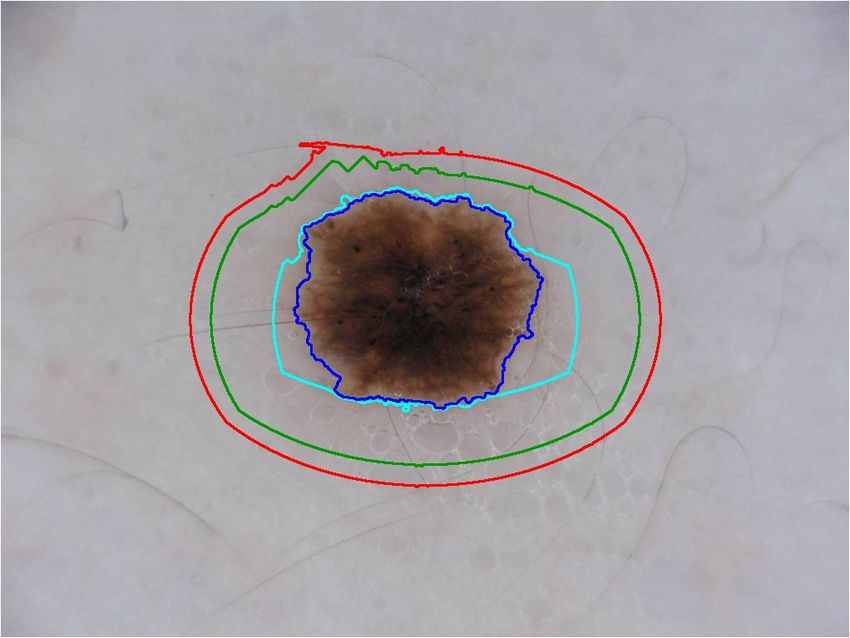
figure 9). The different masks (for segmentation, globules, colours, for example) can be used as overlays over the original
      image to allow for further inspection by the user (selected by mouse-over). Results of the ABCD module are integrated
      as additional masks (for segmentation, colours, and asymmetry) and (blue) bars representing the numerical values.
Extended classification page for touch screens: (http://www.dfki.de/skincare/classifytouch.html) A vari-
     ant of the classification page that is optimized for touch screens (see figure 10). This presentation is more compact to
     support smaller screens and the selection of masks can also be done by swiping through the graphics. Some additional
     functionalities like two kinds of classification (binary and 8-class), color coding showing the probability of malignancy,
     user feedback (figure 11) and heatmaps (figures 12 and 13) of the last layers of the model are included in this version.
Evaluation page: (http://www.dfki.de/skincare/evaluate.html) This page allows us to evaluate the (binary)
     classifier results. Two sets of images with known results (benign and malign) can be uploaded and classified. All images
     are classified and the evaluation measures precision, recall, specificity, accuracy, F1, FPR (false-positive-rate), and
     TPR (true-positive-rate) are presented6 with different thresholds. Additional charts show the ROC (receiver operating
     characteristic) curve and the relation between precision and recall (figure 14).

6 REST API
The Skincare implementation provides a web REST API to perform classification, segmentation, and feature extraction. The
calls return either a JSON dictionary or an image. In the following, the REST commands available from the classification server
are described in detail.

6.1 Info
Returns information about the used classifier.
path ‘/model_info’
method POST
input parameters none
returns ‘binary_classification_model’: The model used for this classification

6.2 Static content
Used to serve static html pages, useful to enrich the service. Just create a subdirectory named ‘html’ in your server working
directory and store your files there.
path ‘/html/’
method POST
input parameters the name of the file to retrieve
returns the specified file, contained in the ‘html’ subdirectory
Content-Type inferred from the file extension

6.3 Classification: Benign vs. Malignant
Binary classification is the process of analyzing an image of a lesion and return the probability distribution between benign (0)
and malign (1).
path ‘/classify/binary’
method POST
input parameters : ‘file‘: the image to classify. Must be a JPEG or PNG image. No alpha.
returns a JSON structure with info about the classification with the following fields:
      error If there was an error, otherwise this entry is absent
      filename The name of the file provided as input
      prediction A 2-dimension array with the probability for benign and malignant cases, respectively.
  6 generated   with www.highcharts.com

                                                                                                                           10/20
Figure 9. The classification web page (decision support). The first row shows classification results
(benign/malign) and extraction features computed by the deep learning algorithm (‘DL Features’)
such as globules and streaks. The second row (‘ABCD Features’) displays features computed by
computer vision methods and some numeric values categorising attributes like border, diameter, and
asymmetry (blue bars). The large image is selected by mouse-over (here showing colours from the
ABCD features) and is rendered as an overlay to the original image. The shown large image has three
color regions, namely a region of dark-brown, marked red, and two regions of light-brown, marked
yellow. More information about the centroids of these regions is displayed in the yellow and red
boxes, respectively.
11/20Figure 10. The touch-optimised version of the classification web interface. The original image in the middle has an
overlay with the selected ‘Milia like Cyst’ mask (opacity 0.8, which can be changed via the blue slider controls). The left
part of the page shows the original image with a color-coded border (representing the probability of malignancy) and the
numerical results (confidences) of the binary and the 8-class classifier (the probability is shown in brackets).
12/20Figure 11. User feedback, Interactive Machine Learning (IML): The user marked two regions of interest on the
‘Streaks’ mask and chose actions (add/remove). Clicking on the ‘send’ button will post the data to the back-end
where it can be used as feedback to the machine learning process. See http://iml.dfki.de for further
examples of how IML is performed.
13/20Figure 12. RISE: The image on the bottom shows the result of the RISE algorithm
called with 100 masks (triggered over the button “Explain - Method 2”). “Method 1”
uses the GradCAM algorithm, “More Details” opens another pane where the parameters
can be changed individually, as shown in figure 13. For more details on this method see
section 2.
14/20Figure 13. GradCAM: The three images at the bottom show heatmaps of the last layers
of the model. This is a more elaborated pane for experienced users where the methods
and parameters can be changed directly. For more details on this method see section 2.
6.4 Segmentation
Segmentation is the process of taking the image of a lesion as input and generating another image representing a binary mask
containing the lesion.
The output image is a gray-scale PNG image, pixels can be only black (the pixels are outside of the lesion) or white (the
pixels pertains to the lesion).
path /segment
method POST
input parameters : ‘file’: the image to segment. Must be a JPEG or a PNG image. No alpha.
returns depending on result:
• In case or error, returns a JSON file with the error reason,
Content-Type: ‘application/JSON’
‘error‘: The reason of the error
• Otherwise, returns a PNG image (same size as input), gray-scale (1 channel), with the lesion mask.
Content-Type: ‘image/png’
6.5 Feature Extraction
Feature Extraction is the process of extracting, from the image of a lesion, pixel areas classified as pertaining to a certain
category.
The output image is a gray-scale PNG image, pixels can be only black (the pixels are not in the feature class) or white (the
pixels pertains to the feature class).
path /extract_feature/
with ‘feature_class’ one of: ‘globules’, ‘streaks’, ‘pigment_network’, ‘milia_like_cyst’, ‘negative_network’.
method POST
input parameters : ‘file’: the image to process. Must be a JPEG or a PNG image. No alpha.
returns depending on result:
15/20Figure 14. The evaluation base: two sets of dermatological images (benign, left column, and malign,
right column) can be uploaded; the classification results are shown in this part of the page. The page
also contains some quality measures (shown in figure 15).
16/20Figure 15. The evaluation results: the system computes several evalutaion measures
based on the classification results (see figure 14) and displays them in corresponding
graphical charts.
17/20• In case or error, returns a JSON file with the error reason,
Content-Type: ‘application/JSON’
‘error‘: The reason of the error
• Otherwise, returns a PNG image (same size as input), gray-scale (1 channel), with the lesion mask.
Content-Type: ‘image/png’
7 Installation
Download the main package for the Skincare classification project. It contains a number of files, put all of them in an empty
directory:
‘README.md’ containing the installation instructions
‘skincare_dfki-x.y.z-py3-none-any.whl’ The installable python package.
‘models’ directory with the binary trained models.
E.g. ‘0-keras_model-20190412-142934.h5‘ is the trained model for binary classification.
‘model-segment_weights.h5‘ is the model for the segmentation.
‘skincare_config.json‘ The configuration file for the server. Edit it to point to new models, if needed.
‘REST-API.md‘ Documentation for the REST API (see also previous section)
plus some example images for testing.
7.1 Install Python Package
Create a Python3 environment and install the package from the wheel archive
bash
cd path/to/your_directory
python3 -m venv skincare-p3env
source skincare-p3env/bin/activate
pip install -U skincare_dfki-x.y.z-py3-none-any.whl
7.2 Run the server providing the REST-API
The http REST interface is implemented using Flask. To run the server from a terminal:
bash
cd path/to/your_directory
export FLASK_APP=skincare.networking.__main__.py
python -m flask run
By default, the server takes connections on port 5000. From a browser, you can use the server with:
• ‘http://127.0.0.1:5000/model_info‘ returns info about the loaded classifiers.
• ‘http://127.0.0.1:5000/html/hello.html‘ Test if serving the static html pages works.
• ‘http://127.0.0.1:5000/classify/binary‘ performs the actual classification. This must be a POST, providing the image.
In order to support public connections and different ports:
python -m flask run --host=0.0.0.0 --port=80
Acknowledgements
We would like to thank all student assistants that contributed to the development of the platform: Abraham Ezema, Haris
Iqbal, Md Abdul Kadir, and Duy Nguyen. This research is partly supported by H2020 and BMBF. See our project page
about Skincare http://medicalcps.dfki.de/?page_id=1056 and the Interactive Machine Learning Lab (http:
//iml.dfki.de).
18/20References
1. Yan, Y., Kawahara, J. & Hamarneh, G. Melanoma recognition via visual attention. In Chung, A. C. S., Gee, J. C.,
Yushkevich, P. A. & Bao, S. (eds.) Information Processing in Medical Imaging, 793–804 (Springer International Publishing,
Cham, 2019).
2. Hohman, F., Kahng, M., Pienta, R. & Chau, D. H. Visual analytics in deep learning: An interrogative survey for the next
frontiers. CoRR abs/1801.06889 (2018). 1801.06889.
3. Lipton, Z. C. The mythos of model interpretability. Queue 16, 31?57, DOI: 10.1145/3236386.3241340 (2018).
4. Montavon, G., Samek, W. & Müller, K.-R. Methods for interpreting and understanding deep neural networks. Digit. Signal
Process. 73, 1 – 15, DOI: https://doi.org/10.1016/j.dsp.2017.10.011 (2018).
5. Miller, T. Explanation in artificial intelligence: Insights from the social sciences. Artif. Intell. 267, 1 – 38, DOI:
https://doi.org/10.1016/j.artint.2018.07.007 (2019).
6. Selvaraju, R. R. et al. Grad-CAM: Visual Explanations From Deep Networks via Gradient-Based Localization. In The
IEEE International Conference on Computer Vision (ICCV) (2017).
7. Petsiuk, V., Das, A. & Saenko, K. RISE: Randomized Input Sampling for Explanation of Black-box Models. In Proceedings
of the British Machine Vision Conference (BMVC) (2018).
8. Simonyan, K. & Zisserman, A. Very Deep Convolutional Networks for Large-Scale Image Recognition. arXiv:1409.1556
[cs] (2014). ArXiv: 1409.1556.
9. Deng, J. et al. ImageNet: A large-scale hierarchical image database. In 2009 IEEE Conference on Computer Vision and
Pattern Recognition, 248–255, DOI: 10.1109/CVPR.2009.5206848 (IEEE, Miami, FL, 2009).
10. Fujisawa, Y. et al. Deep-learning-based, computer-aided classifier developed with a small dataset of clinical images
surpasses board-certified dermatologists in skin tumour diagnosis. Br. J. Dermatol. DOI: 10.1111/bjd.16924 (2018).
11. Nunnari, F. & Sonntag, D. A CNN toolbox for skin cancer classification. arXiv:1908.08187 [cs, eess] (2019). ArXiv:
1908.08187.
12. Ronneberger, O., Fischer, P. & Brox, T. U-Net: Convolutional Networks for Biomedical Image Segmentation. In Navab,
N., Hornegger, J., Wells, W. M. & Frangi, A. F. (eds.) Medical Image Computing and Computer-Assisted Intervention
– MICCAI 2015, vol. 9351, 234–241, DOI: 10.1007/978-3-319-24574-4_28 (Springer International Publishing, Cham,
2015).
13. Erkol, B., Moss, R. H., Stanley, R. J., Stoecker, W. V. & Hvatum, E. Automatic lesion boundary detection in dermoscopy
images using gradient vector flow snakes. Ski. Res Technol 11, 17–26 (2005).
14. Majtner, T., Yildirim Yayilgan, S. & Hardeberg, J. Y. Efficient melanoma detection using texture-based rsurf features. In
Campilho, A. & Karray, F. (eds.) Image Analysis and Recognition - 13th International Conference, ICIAR 2016, in Memory
of Mohamed Kamel, Póvoa de Varzim, Portugal, July 13-15, 2016, Proceedings, vol. 9730 of Lecture Notes in Computer
Science, 30–37, DOI: 10.1007/978-3-319-41501-7_4 (Springer, 2016).
15. Barata, C., Ruela, M., Francisco, M., Mendonça, T. & Marques, J. S. Two systems for the detection of melanomas in
dermoscopy images using texture and color features. IEEE Syst. J. 8, 965–979, DOI: 10.1109/JSYST.2013.2271540
(2014).
16. Barata, C., Ruela, M., Francisco, M., Mendonça, T. & Marques, J. S. Two systems for the detection of melanomas in
dermoscopy images using texture and color features. IEEE Syst. J. 8, 965–979, DOI: 10.1109/JSYST.2013.2271540
(2014).
17. Do, T. T., Zhou, Y., Zheng, H., Cheung, N. M. & Koh, D. Early melanoma diagnosis with mobile imaging. Conf Proc
IEEE Eng Med Biol Soc 2014, 6752–6757 (2014).
18. Oliveira, R. B. et al. Computational methods for the image segmentation of pigmented skin lesions: A review. Comput.
Methods Programs Biomed 131, 127–141 (2016).
19. Garnavi, R., Aldeen, M., Celebi, M. E., Varigos, G. & Finch, S. Border detection in dermoscopy images using hybrid
thresholding on optimized color channels. Comput. Med Imaging Graph 35, 105–115 (2011).
20. Oliveira, R. B., Marranghello, N., Pereira, A. S. & Tavares, J. M. R. S. A computational approach for detecting pigmented
skin lesions in macroscopic images. Expert. Syst. Appl. 61, 53–63, DOI: 10.1016/j.eswa.2016.05.017 (2016).
21. Barcelos, C. A. Z. & Pires, V. B. An automatic based nonlinear diffusion equations scheme for skin lesion segmentation.
Appl. Math. Comput. 215, 251–261, DOI: 10.1016/j.amc.2009.04.081 (2009).
19/2022. Pennisi, A. et al. Skin lesion image segmentation using Delaunay Triangulation for melanoma detection. Comput. Med
Imaging Graph 52, 89–103 (2016).
23. Ma, Z. & Tavares, J. M. A Novel Approach to Segment Skin Lesions in Dermoscopic Images Based on a Deformable
Model. IEEE J Biomed Heal. Inf. 20, 615–623 (2016).
24. Mendonca, T. et al. Comparison of segmentation methods for automatic diagnosis of dermoscopy images. Conf Proc IEEE
Eng Med Biol Soc 2007, 6573–6576 (2007).
25. Shi, Y. & Karl, W. C. A real-time algorithm for the approximation of level-set-based curve evolution. IEEE Trans Image
Process. 17, 645–656 (2008).
26. Chan, T. F. & Vese, L. A. Active contours without edges. IEEE Trans Image Process. 10, 266–277 (2001).
27. Suta, L., Bessy, F., Veja, C. & Vaida, M. Active contours: Application to plant recognition. 181–187, DOI: 10.1109/ICCP.
2012.6356183 (2012).
28. Friedman, R. J., Rigel, D. S. & Kopf, A. W. Early detection of malignant melanoma: the role of physician examination and
self-examination of the skin. CA: a cancer journal for clinicians 35, 130–151 (1985).
29. She, Z., Liu, Y. & Damatoa, A. Combination of features from skin pattern and abcd analysis for lesion classification. Ski.
Res. Technol. 13, 25–33 (2007).
30. Jain, S., Pise, N. et al. Computer aided melanoma skin cancer detection using image processing. Procedia Comput. Sci. 48,
735–740 (2015).
31. Harrington, E. et al. Diagnosing malignant melanoma in ambulatory care: a systematic review of clinical prediction rules.
BMJ open 7, e014096 (2017).
32. Tsao, H. et al. Early detection of melanoma: reviewing the ABCDEs. J. Am. Acad. Dermatol. 72, 717–723 (2015).
33. Robinson, J. K. & Turrisi, R. Skills training to learn discrimination of ABCDE criteria by those at risk of developing
melanoma. Arch Dermatol 142, 447–452 (2006).
34. Henning, J. S. et al. The CASH (color, architecture, symmetry, and homogeneity) algorithm for dermoscopy. J. Am. Acad.
Dermatol. 56, 45–52 (2007).
35. Rigel, D. S., Russak, J. & Friedman, R. The evolution of melanoma diagnosis: 25 years beyond the ABCDs. CA Cancer J
Clin 60, 301–316 (2010).
36. Leachman, S. A. et al. Methods of Melanoma Detection. Cancer Treat. Res. 167, 51–105 (2016).
37. Sáez, A., Acha, B. & Serrano, C. Pattern Analysis in Dermoscopic Images, 23–48. In [40], DOI: 10.1007/
978-3-642-39608-3_2 (2014).
38. Pehamberger, H., Steiner, A. & Wolff, K. In vivo epiluminescence microscopy of pigmented skin lesions. I. Pattern analysis
of pigmented skin lesions. J. Am. Acad. Dermatol. 17, 571–583 (1987).
39. Korotkov, K. & Garcia, R. Computerized analysis of pigmented skin lesions: a review. Artif Intell Med 56, 69–90 (2012).
40. Scharcanski, J. & Celebi, M. E. Computer Vision Techniques for the Diagnosis of Skin Cancer (2013).
41. Abbasi, N. R. et al. Early diagnosis of cutaneous melanoma: revisiting the ABCD criteria. JAMA 292, 2771–2776 (2004).
42. Harrington, E. et al. Diagnosing malignant melanoma in ambulatory care: a systematic review of clinical prediction rules.
BMJ Open 7, e014096 (2017).
43. Forsea, A. M. et al. The impact of dermoscopy on melanoma detection in the practice of dermatologists in Europe: results
of a pan-European survey. J Eur Acad Dermatol Venereol 31, 1148–1156 (2017).
44. Kalwa, U., Legner, C., Kong, T. & Pandey, S. Skin cancer diagnostics with an all-inclusive smartphone application.
Symmetry 11, 790, DOI: 10.3390/sym11060790 (2019).
45. Mendonça, T., Ferreira, P. M., Marques, J. S., Marcal, A. R. & Rozeira, J. Ph 2-a dermoscopic image database for research
and benchmarking. In 2013 35th annual international conference of the IEEE engineering in medicine and biology society
(EMBC), 5437–5440 (IEEE, 2013).
46. Oviatt, S. et al. (eds.) The Handbook of Multimodal-Multisensor Interfaces: Foundations, User Modeling, and Common
Modality Combinations - Volume 1, vol. 14 (Association for Computing Machinery and Morgan & Claypool, 2017).
47. Sonntag, D., Neßelrath, R., Sonnenberg, G. & Herzog, G. Supporting a rapid dialogue engineering process. Paper presented
at the First International Workshop on Spoken Dialogue Systems Technology (IWSDS-2009), Kloster Irsee, Germany
(2009). Available from http://www.dfki.de/web/forschung/publikationen?pubid=4673.
20/20You can also read