Towards Forklift Safety in a Warehouse: An Approach Based on the Automatic Analysis of Resource Flows
←
→
Page content transcription
If your browser does not render page correctly, please read the page content below
sustainability

Article
Towards Forklift Safety in a Warehouse: An Approach
Based on the Automatic Analysis of Resource Flows
Alessandra Cantini , Filippo De Carlo *                 and Mario Tucci
 Department of Industrial Engineering (DIEF), University of Florence, Viale Morgagni, 40, 50134 Florence, Italy;
 alessandra.cantini@unifi.it (A.C.); mario.tucci@unifi.it (M.T.)
 * Correspondence: filippo.decarlo@unifi.it; Tel.: +39-05-5275-8677

 Received: 30 September 2020; Accepted: 22 October 2020; Published: 28 October 2020

 Abstract: Warehouse management is a discipline that has gained importance in recent decades. In the
 era of the Digital Revolution and Industry 5.0, to enable a company to attain a competitive advantage,
 it is necessary to identify smart improvement tools that help search for warehouse problems
 and solutions. A good tool to highlight issues related to layout and resource flows is the spaghetti
 chart which, besides being used to minimize waste according to lean philosophy, can also be used
 to assess warehouse safety and reliability and improve the plant sustainability. This article shows
 how to exploit “smart spaghetti” (spaghetti chart automatically generated by smart tracking devices)
 to conceive improvements in the layout and work organization of a warehouse, reducing the risk
 of collision between forklifts and improving the operators’ safety. The methodology involves
 automatically mapping the spaghetti charts (searching for critical areas where the risk of collision
 is high) and identifying interventions to be carried out to avoid near misses. “Smart spaghetti”
 constitutes a valuable decision support tool to identify potential improvements in the system through
 changes in the layout or in the way activities are performed. This work shows an application of the
 proposed technique in a pharmaceutical warehouse.

 Keywords: smart spaghetti chart; spaghetti diagram; warehouse sustainability; forklift movements;
 safety assessment; near miss detection; lean layout planning; strategy for improving layout

1. Introduction
      In recent decades, the discipline of warehouse management has gained increasing importance [1,2].
Nevertheless, even today, sometimes the problems of the warehouse and the benefits that can be
obtained from its optimization are still lost sight of [3]. To increase a company’s competitive advantage,
it is necessary to identify continuous improvement tools that highlight critical inventory issues and
facilitate the search for improvement solutions [4]. Among these tools, the spaghetti chart is useful to
point out critical aspects related to layout and resource flows [5].
      However, in the era of Industry 5.0 and digital manufacturing, it is essential to automate the
construction of spaghetti charts, which would otherwise have to be created manually after long and
numerous inspections at companies [6]. Using smart tracking devices to track the movement of
resources within a system, it is possible to automatically generate spaghetti charts (that we will call,
according to Uddin et al. [7,8], “smart spaghetti”). In this way, a valid integrated digital system can be
obtained that supports decisions and helps to make a system more efficient by identifying possible
improvements to its layout and work organization [7].
      The literature shows how the spaghetti chart can be applied to any kind of field.
Previous contributions show its use in mechanical industries [9], in electronics [10]
and telecommunications industries [5], in hospitals [11,12], in healthcare laboratories [13], and even in

Sustainability 2020, 12, 8949; doi:10.3390/su12218949                        www.mdpi.com/journal/sustainability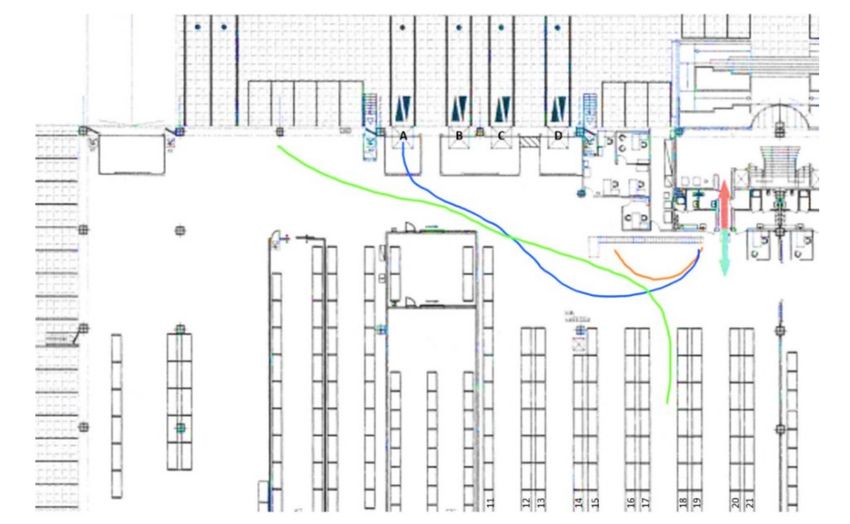
Sustainability 2020, 12, 8949                                                                         2 of 17

hotels and in the tourism sector [14]. Recently, a case study application has been shown to improve the
management of warehouses and to visualize the critical issues related to their layout [15].
      Even though the literature reports several applications of spaghetti charts, few authors show the
advantages that can be achieved using smart tracking devices for automatic and smart flow [16,17].
Besides, the available case studies mention the spaghetti chart within broader studies focused on
the application of lean approaches [18–20], and the introduction of the concept of “kaizen” in
companies [15,21,22]. In such studies, a spaghetti chart is used to find layout solutions that minimize
waste, distances covered, and handling times. However, in the case of warehouses, there is another
well-known problem [23] that can be treated using the spaghetti chart: the assessment of the risk of
collision due to means of transport and moving workers.
      This article shows how to use smart spaghetti (spaghetti charts automatically build through
smart tracking devices) to map the reliability of the warehouse and the risk of accidents between
company workers (pedestrians or forklift drivers). The proposed methodology involves recording the
movements of staff using smartphones. The flow maps are drawn automatically, then the “hot zones”
of the layout (the most critical areas of the warehouse) are highlighted searching for near misses.
In this way, the reliability of the warehouse is mapped, identifying the areas at high risk of collision,
which negatively impacts the safety of the system. Based on the obtained results, observing the smart
spaghetti and their critical areas, it is possible to identify potential interventions that should be made to
improve the structure’s safety. The proposed approach is particularly interesting for the companies that
are looking for a decision support system to improve the organization of their warehouses, pursuing as
objectives the more sustainable development of a plant according to social aspects, greater safety in
the workplace, and better interaction between humans and machines [24].
      This paper shows an application of smart spaghetti to map the movements of forklifts and
workers in a pharmaceutical material storage facility. The remainder of the present paper is as follows:
Section 2 outlines the proposed approach; in Section 3, a case study is used to demonstrate its application;
and finally, Section 4 provides a discussion on the results and some conclusions.

2. Materials and Methods
     The spaghetti diagram (also known as a spaghetti chart) is a tool for mapping and visualizing
physical flows of resources (materials, people, documents, or other) that pass through a predetermined
volume of control [7]. It consists of drawing lines (called “spaghetti” because their shape recalls the
pasta format) that represent the path taken by the entities moving in the system. To make the mapping
of the flows more understandable, different colors can be used to draw the spaghetti by distinguishing
the resources that move in the system or the time bands in which they move [25].
     Typically, a spaghetti chart is used in the initial phase of planning improvement actions [26]. It is
recognized as one of the tools to apply lean philosophy and it is useful to establish the optimal layout of
a system based on the observation of distances traveled by resources and the quantification of material
exchanges between departments [10].
     The construction of a spaghetti chart is possible if inspections are carried out at the system under
analysis and the movements of resources are recorded [11].
     Traditionally, the spaghetti lines are manually drawn on a planimetry of the system [26].
However, some authors have recently proposed new software, sensors, and digital devices to automate
the construction of maps according to the concepts of “digital transformation” and “Industry 5.0” [8,25].
     During the construction of a spaghetti chart, tables called “from-to-chart” are often compiled,
in which the following information is listed for each flow [10]: movements, duration, distance traveled,
presence of intersection/overlap between flows, and any other information of a numerical nature.
The combination of spaghetti chart and from-to-chart allows visualizing the company’s weaknesses
and redesigning the layout and organization of the system to minimize waste, distances traveled,
lead times, and all the non-value-added operations [27]. As stated by [26], the use of a spaghetti chart
is indicated when looking for effective tools to achieve the following three objectives.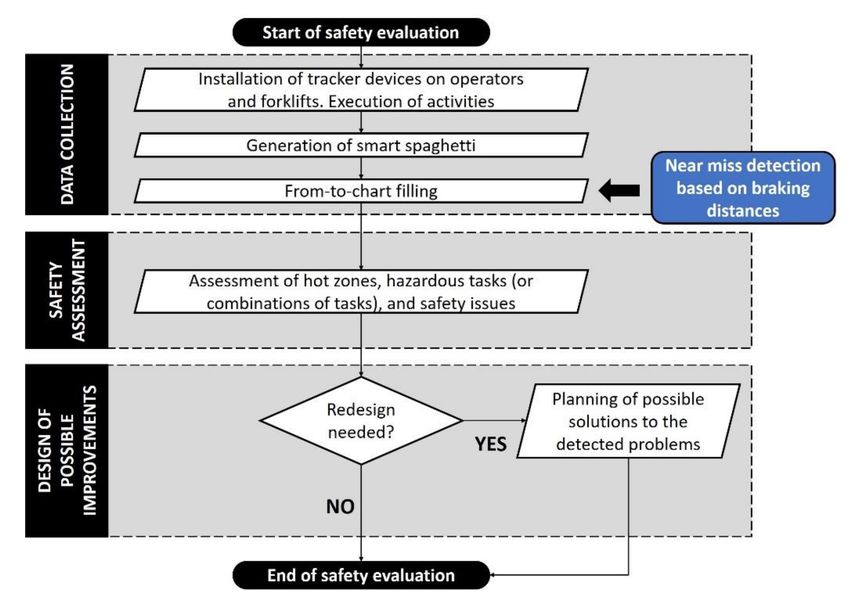
Sustainability 2020, 12, 8949                                                                         3 of 17

•     Make the company manager and staff aware of the internal flows of a system;
•     Highlight how much the behavior of individuals moving within a control volume can impact the
      well-being of the entire company;
•     Give information on the critical areas of a system and seek the causes of these issues and
      possible solutions.

     In this perspective, in the case of warehouses, the spaghetti chart can also be used to identify the
safety level of the facility and the risks associated with the movement of forklift drivers and pedestrians.
The following section shows how to achieve this goal and, therefore, how to plan possible solutions to
improve the sustainability of a plant according to the social dimension.

2.1. How to Evaluate Warehouse Safety Through Smart Spaghetti
      To assess the reliability of a warehouse by identifying the areas of the facility and the activities
that generate collision risks, smart spaghetti should be built and analyzed by applying the following
procedural steps.
      Conduct interviews with warehouse staff to understand what activities are carried out in the
facility, what products are contained in the inventory, how the shelves are loaded and unloaded,
how forklifts are used, and how working days are organized [11]. During the interviews,
the perceptions that staff members have of the advantages and disadvantages of the warehouse
in terms of layout, management, and reliability can be asked. Once the spaghetti chart has been built,
it will be possible to compare the visualization of real flows with the workers’ perceptions, to confirm
or not their impressions.
      Define the control volume to be analyzed. It is possible to consider the entire warehouse or to
focus only on the part of the facility that, according to the experience of the staff, is most critical [22].
The important thing is to make a choice so that the smart tracking devices and infrastructure needed
to record the movement of resources are able to operate in these areas. Once the control volume has
been defined, it is necessary to procure a planimetry that will be used to produce the spaghetti charts.
      Choose the resources to monitor. To assess the adequacy of the warehouse layout in terms of
safety and collision risks, it is necessary to map the movements of workers [25,28], whether they are
moving on foot or using logistical means of transport.
      Map staff movements using smart tracking devices. The mapping of movements must be carried
out several times, on different working days at different hours, choosing the appropriate number
of analyses to observe the performance of all warehouse activities (as if several inspections were
being carried out) and analyze a sample of significant flows. During each inspection, smart tracking
devices are used to localize forklifts and workers [29] and to trace on the planimetry the spaghetti
corresponding to the observed movements. Aiming at objectively representing the flows of entities, it is
preferable to use such devices rather than drawing diagrams manually. In fact, in this way, the staff is
not disturbed and its work is not interfered with [30], flows are drawn in scale with respect to the layout
planimetry, and the procedure for constructing reliability maps is automated. Moreover, to simplify the
reading of the diagrams, the spaghetti should be traced using various colors to identify the different
workers performing different types of tasks (palletizing, pallet labeling, loading onto the shelves,
unloading stocks, etc.) [2,7].
      Several devices can be used to automatically map resource movements in the system
(cameras, smartwatches, position sensors, smartphones, etc.) [16,29,31]. However, using smartphones
is particularly advantageous because it does not require large investments in IT technology to
obtain a smart spaghetti mapping (nowadays, many companies already have company phones
available) [7]. In the case of warehouses where workers can move either on foot or with forklifts,
each forklift and each employee is equipped with a smartphone. Then, the smartphone’s inertial sensors
(accelerometer, gyroscope, magnetic field sensor, and orientation sensor) are leveraged to generate
automatic spaghetti charts. When an operator is driving a forklift, the spaghetti related to the forklift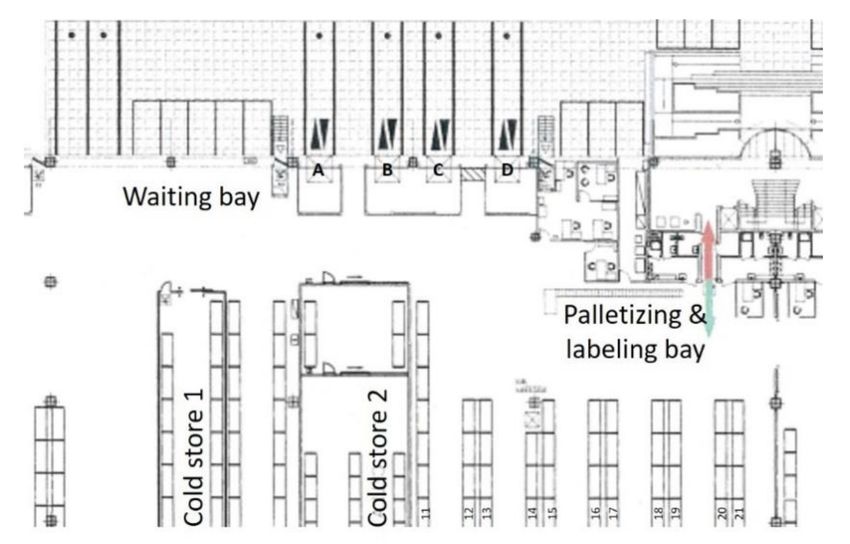
Sustainability 2020, 12, 8949                                                                          4 of 17

movements are mapped. Otherwise, the system plots the flow path related to the pedestrian worker.
Uddin et al., in [7,8], describe in detail how to use smartphones to plot automatic flow paths,
also explaining the system architecture, data acquisition, data fusion, accuracy, and functioning of
the methodology. To implement a similar approach, it is also possible to rely on commercially available
apps such as the one described in [32]. Again, readers are invited to consult [32] to obtain information
about the system architecture, the accuracy of the approach, and its functioning.
     Fill in a from-to-chart for each inspection carried out [33], recording for each flow which resource
has moved (worker ID), the number of movements, duration of movement, and means of transport
used (pedestrian or forklift driver). In the case of warehouses where the tasks performed are highly
repetitive, by comparing the results of the smart spaghetti with information on the daily activities
to be performed (known from the company’s management systems), it is possible to associate each
spaghetti with information on the type of task performed. Furthermore, it is possible to report in the
from-to-chart the occurrence of “near misses”, which are critical events not resulting in a crush but very
close to that [34]. Near misses can then be used as indicators to estimate the safety of the system [35].
     It is possible to detect near misses knowing that any tracking device records, for each instant
of time, the position occupied by a resource within the planimetry. A generic tracker ID at instant t
assumes coordinates:

                                              A = (xA,t , yA,t ),                                          (1)

     By analyzing the consecutive positions assumed by each resource over time (smart spaghetti),
the instantaneous speed (vA,t ) and the advancing direction (ϑ,tA ) of each worker can be
determined (Figure 1).                                             !
                                                    yA,t − yA,t−1
                                    ϑA,t = arctg                     ,                        (2)
                                                    xA,t − xA,t−1
                                     q
                                       (xA,t − xA,t−1 )2 + ( yA,t − yA,t−1 )2
                             vA,t =                                                           (3)
                                                       ∆t
where ∆t is empirically calibrated to be large enough to avoid the same near miss being detected
multiple times.

      Figure 1. Representation
                           of the risk spaces of two generic points (A and B) which, at the instant t,
      move with speed vA,t and (vB,t ) in direction (ϑA,t ) and (ϑB,t )

    A generic near miss occurs if two or more resources get so close that there is not enough
stopping distance. Although a near miss does not always result in a collision—one of the resources
may suddenly change direction to avoid the impact—it is still considered a risky event. Depending on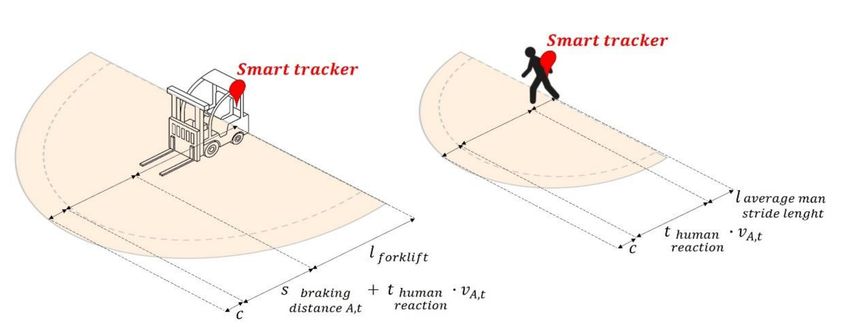
Sustainability 2020, 12, 8949 5 of 17
the type of resource mapped by the tracker (pedestrian or forklift), a risk zone is calculated as a flat
figure obtained from a closed semi-circle (red in Figure 1). In the case of resource A, this semi-circle
will have a center given by Equation (1) and radius (4). When the closed semi-circumference of A
intersects another closed semi-circumference (for example, that of B, Figure 1), the probability that A
and B will collide in the following instants of time increases.
(
l f orkli f t + sbraking distance A,t + thuman reaction ·vA,t + c i f ID f orkli f t
rA,t = , (4)
laverage man stride length + thuman reaction ·vA,t + c i f ID pedestrian
where l f orkli f t is shown in Figure 2, thuman reaction is conventionally taken equal to 0.2 s, sbraking distance A,t
is proportional to the square of the speed vA,t [36], laverage man stride length is conventionally taken equal
to 0.75 m, and, finally, c is a corrective term taking into account the accuracy of the trackers.
Figure 2. Calculation of the safety radius for forklifts (left) and pedestrians (right), based on the position
of the resources detected by the trackers.
Before searching for the intersections between semi-circumferences of resources at instant t,
it is useful to make an initial check to reduce the calculation power required by the methodology.
In this perspective, we only search for pairs of points (A and B) whose Euclidean distance at instant t is
less than or equal to the sum of the respective radii (rA and rB ).
q
dAB,t = (xA,t − xB,t )2 + ( yA,t − yB,t )2 ≤ rA,t + rB,t , (5)
For the couples of points verifying condition (5), the presence of an actual near miss is then
detected as follows. Given the equation of a semi-circumference centered in A (6a and 6b) and rotated
by an angle ϑA,t (6c and 6d),
(x0 − xA,t )2 + ( y0 − yA,t )2 = r2A,t
(6a)
0
x ≥ xA,t (6b)
,
x0 = x00 cosϑA,t + y00 senϑA,t − yA,t senϑA,t − xA.t (1 − cosϑA,t ) (6c)
y0 = y00 cosϑA,t − x00 senϑA,t + xA,t senϑA,t + yA.t (1 − cosϑA,t ) (6d)
and given the equation of a line segment whose amplitude is 2·rA,t (7a–7c), passing through point
A (7d and 7e), and rotated by an angle ϑA,t (7f and 7g),
x = 0 (7a)
y ≥ −rA,t (7b)
y ≤ rA,t (7c)
x = x0 − xA,t (7d) ,
y = y0 − yA,t
(7e)
x0 = x00 cosϑA,t + y00 senϑA,t − yA,t senϑA,t − xA.t (1 − cosϑA,t )
(7 f )
y0 = y00 cosϑA,t − x00 senϑA,t + xA,t senϑA,t + yA.t (1 − cosϑA,t )
(7g)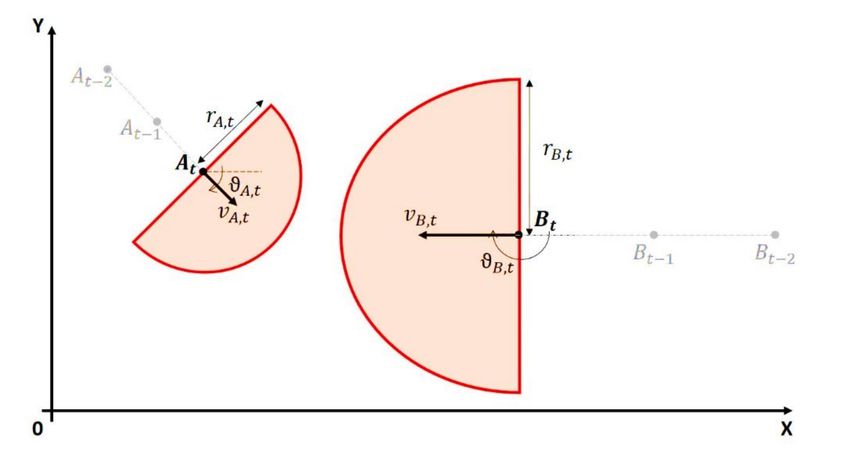
Sustainability 2020, 12, 8949 6 of 17
systems (6a–6d) and (7a–7g) characterize the closed semi-circumference relative to A.
Similarly, systems (8a–8d) and (9a–9g) identify the closed semi-circumference of B.
(x0 − xB,t )2 + ( y0 − yB,t )2 = r2B,t
(8a)
x0 ≥ xB,t
(8b)
,
x0 = x00 cosϑB,t + y00 senϑB,t − yB,t senϑB,t − xB,t (1 − cosϑB,t )
(8c)
y0 = y00 cosϑB,t − x00 senϑB,t + xB,t senϑB,t + yB.t (1 − cosϑB,t )
(8d)
x = 0 (9a)
y ≥ −rB,t (9b)
y ≤ rB,t (9c)
x = x0 − xB,t (9d) ,
y = y0 − yB,t
(9e)
x0 = x00 cosϑB,t + y00 senϑB,t − yB,t senϑB,t − xB.t (1 − cosϑB,t )
(9 f )
y0 = y00 cosϑB,t − x00 senϑB,t + xB,t senϑB,t + yB.t (1 − cosϑB,t )
(9g)
A near miss is obtained when the closed semi-circumferences of A and B intersect according to
one of the three scenarios shown in Figure 3, i.e., when at least one of the system pairs, (6a–6d)–(8a–8d),
(6a–6d)–(9a–9g), and (7a–7g) and (8a–8d), admits a solution.
Figure 3. Possible scenarios of intersection between risk zones of two generic resources A
and B. (a) Intersection between the semi-circumference of A and the semi-circumference of B.
(b) Intersection between the semi-circumference of A and the straight line of B. (c) Intersection between
the semi-circumference of B and the line of A. If at least one of these scenarios occurs, a near miss
is detected. The scenario of intersection between two lines is not considered because the orientation of
the closed semi-circumference always adapts to the advancing direction of the resources.
Analyze the spaghetti chart and from-to-chart results. At the end of this process, a smart
spaghetti and a from-to-chart are produced for each time interval in which the tracking devices
have recorded flows. The greater the number of analyses carried out, the more the diagrams will
faithfully represent the real situation in the warehouse. According to a qualitative approach, the areas
of the diagrams where there are more intersections between flows and near misses detected in the
from-to-chart correspond to the “hot areas” of the structure, i.e., those on which it is good to operate to
improve the reliability of the warehouse. In general, in fact, for the safety of a system, it is good toSustainability 2020, 12, 8949 7 of 17
avoid near misses and forklift trajectories at risk of an accident. Besides, the color of spaghetti gives
information on the least reliable employees, while information on the tasks performed indicates which
actions (or combinations of them) generate the greatest risk of collision.
Finally, where hot areas or risky tasks are detected, possible solutions can be devised to improve
warehouse reliability both in terms of layout and organization of work activities. Thus, the diagram
and the proposed methodology (Figure 4) correspond to a smart decision support system useful to
• Automatically obtain a visual and objective, although qualitative, mapping of the safety situation
of the structure;
• Identify critical areas and tasks;
• Plan possible improvements.
Moreover, once the critical areas and activities are known, this approach allows comparing
the results of the diagrams with the staff perceptions (emerged from the interviews) to verify the
correspondence between initial impressions of the staff and the real situation. In this perspective,
besides being useful as a design support tool (to identify possible solutions to reliability problems and
to pursue greater sustainability of the warehouse at a social level), the proposed approach can be used
as a description of the current situation of the warehouse, to make the staff and company manager
more aware of the current safety level.
Figure 4. Procedural steps of the proposed approach to evaluate the safety of a warehouse and devise
improvement solutions.
Below is a case study application of smart spaghetti to map the safety situation in a real warehouse
and identify problems related to collision risks.
3. Results
The case study investigated took place in a large pharmaceutical company that owns a warehouse
located 8.2 km away from the production plant. The warehouse is staffed by 30 warehousemen whoSustainability 2020, 12, 8949 8 of 17
alternate with 6-h shifts. Although the warehouse has undergone improvements, the facility supervisor
still detects issues related to reliability and the risk of collisions between forklifts. To increase the
safety level and social sustainability, cameras, mirrors, and soft protections have already been installed
at the aisle corners. Despite this, the supervisor reports that the staff is still at risk of accidents on a
daily basis, especially in a particular area of the building: the goods unloading area. His claims are
substantiated by camera footage, and scratches on the aisle walls and forklift corners. The supervisor
is therefore looking for a structured strategy to show his boss that, despite the interventions made,
the warehouse still has safety problems. Moreover, the supervisor seeks a way to detect which areas
and tasks of the warehouse are critical and to devise reasonable solutions.
Evaluation of Warehouse Safety Through the Proposed Approach
First, the supervisor and staff members were interviewed. The interviews showed that the
warehouse stores both drugs waiting to be sold and raw materials (syringes, bottles, needles, etc.)
to feed the production plant.
The following tasks are carried out in the warehouse.
• a. Unloading of goods (finished products) to be delivered by airplanes to external customers.
Due to the cost of air transport, only medicines that need to stay at a controlled temperature are
shipped by air. In fact, they must be delivered quickly and immediately stored in the refrigerator.
• b. Loading of goods (raw materials) from airplanes sent by suppliers (replenishment of
the warehouse). These goods are picked up at the airport by a truck, which then transports them
to the warehouse. They are distinguished from other goods because they are always placed in
cold stores and arrive in the form of large metal containers, each containing five pallets.
• c. Unloading of goods to be delivered by ship to external customers. The capacity of the trucks
is finite, so the number of trips needed to bring the materials from the warehouse to the port
changes according to the number of pallets to unload (customer orders).
• d. Loading of goods from ships sent by suppliers. These goods (some of which are destined for
cold storage) are recovered at the ports and transported to the warehouse by truck.
• e. Unloading of goods to be delivered by truck to external customers. The capacity of the trucks
is finite, so the number of trips needed to bring the materials from the warehouse to the customer
changes according to the number of pallets to unload.
• f. Loading of goods sent by suppliers by truck.
• g. Palletizing and labeling. Before each shipment, boxes of medicines are palletized and labeled
with descriptive stickers. These tasks take time to be completed because pallet formats and
product labeling standards vary depending on whether goods are shipped in or out of Europe.
• h. Unloading of goods to be delivered by truck to the internal customer (production plant).
Based on the production orders, the raw materials and semi-finished products needed to feed the
production lines are shipped from the warehouse to the factory. Since the production plant has a
small warehouse that can hold raw materials for only 4 h of work, this activity is repeated several
times a day.
• i. Preparation of pallets to be shipped to the internal customer. Pallets of this type, waiting to
be shipped, are stored in a waiting bay, where they remain until the trucks arrive.
• j. Loading of goods in trucks from the internal customer. The finished products are stored in
the warehouse waiting to be sold to external customers. Loads are made several times a day.
All the loading and unloading tasks and the palletization are carried out using forklifts. The loading
units to be transported are pallets and, since the trucks carrying out the distribution of goods have a
known and limited capacity, the number of pallets needed to fill or empty a truck is known. As a result,
knowing the number of pallets to be delivered to a certain customer (or the number of pallets arriving
from a supplier), the number of movements (back and forth) that the forklifts have to make to load theSustainability 2020, 12, 8949 9 of 17
truck is known. The tasks of loading and unloading goods, therefore, are highly repetitive. Unlike the
other tasks, the labeling activities are carried out by pedestrians who apply tags and labels directly on
the pallets before they are loaded onto the trucks.
The area of the warehouse used for unloading goods to be shipped to external or internal
customers has been set as the control volume (Figure 5). This area, as said, is where the supervisor
detects critical points. For this reason, all the loading activities mentioned above were excluded from
the analysis (b–d–f–j).
Figure 5. Planimetry of the control volume (warehouse area designated for unloading goods).
All operators and forklifts were equipped with smartphones. Then, their movements
were observed. With the help of company IT technicians who installed a commercial app on
their company phones [32] (see Section 2.1), following the suggestions by [7], smartphones worn by
workers or placed on forklifts and their magnetic sensors were used to map flows. Three analyses
were carried out—each lasting about 4 h—during which the devices recorded information on the flows.
Different colors were used in tracing the spaghetti to distinguish the tracker IDs. Based on the
flows recorded, a from-to-chart was created, of which an example is shown in Table 1. In order
to associate with each flow path information related to the task performed, the focal points of the
structure such as the labeling bay, the waiting bay, and the discharge doors (A, B, C, and D, Figure 5)
were enclosed within rectangles. Then, the company’s IT technicians took information from the
management systems regarding daily orders, scheduled activities, and the number of trips required to
fill each truck. Subsequently, observing how many times the trackers were positioned within each
focal rectangle and the duration of the movements, each route was associated with the task performed.Sustainability 2020, 12, 8949 10 of 17
Table 1. Extract of a from-to-chart. The following information was provided for each flow:
worker ID, working time, description of the task performed, number of movements, type of movement
(“O” one way only, “R” return only, or both “O + R”), means of transport used (“P” pedestrian, or “F”
forklift driver), and detection of criticalities (the symbol “x” is used to mark streams that generated a
near miss). In the last column, some comments were added by authors to clarify the table content.
N◦ of Type of Means of
Worker ID Start Time End Time Task Near Miss Comments
Repetitions Movement Transport
Pallet loading
9 10:50 11:10 on the truck 8 O+R F The first
(door C) three activities
of this table
Thermal
are simultaneous
blankets are
but do
taken to cover
not cause
medicines that
1 10:56 11:03 4 O+R P collision risks
need to be
shipped while
remaining at a
controlled temperature
Withdrawal of raw
1 10:57 11:04 materials for 4 O+R F
internal customer
Pallet preparation
5 11:41 11:09 3 O+R F x Workers 17
for internal customer and 3
Pallet preparation
3 11:42 11:06 2 O+R F x generated a
for internal customer near miss
By processing the content of the from-to-chart, it was checked that, during the inspections,
all warehouse activities were analyzed several times (Table 2) to ensure that enough inspections
were conducted.
Table 2. Through the from-to-chart, observing the dates and times of the flows, it was checked which
combinations of activities were observed, then it was verified that each activity was observed several
times. The symbol “X” marks the activities observed on a specific date and time. If there are two or
more Xon the same line, it means that activities were observed simultaneously.
Observed Scenarios
Transport to External Customer Transport to Internal Customer
i. Internal Order
a. Unloading of c. Unloading of e. Unloading of g. Palletizing h. Unloading of
Inspection Date Start Time End Time Preparation and
Air Cargo Ship’s Cargo Truck’s Cargo and Labeling Truck’s Cargo
Replenishment
Day 1 08:25 08:59 X
Day 1 09:37 10:23 X
Day 1 10:45 11:03 X X X
Day 1 11:37 11:54 X
Day 2 13:51 14:02 X X
Day 2 14:38 14:48 X
Day 2 14:54 15:00 X X
Day 2 15:02 15:53 X X X
Day 2 15:54 16:04 X X X
Day 2 16:12 15:19 X X
Day 2 16:21 16:24 X X
Day 2 16:24 16:34 X
Day 2 16:36 16:49 X X
Day 2 16:49 16:58 X
Day 2 16:57 17:18 X X
Day 3 08:14 08:25 X X
Day 3 08:26 08:35 X
Day 3 08:36 08:40 X
Day 3 08:40 08:53 X X
Day 3 08:55 09:02 X
Day 3 09:07 09:17 X
Day 3 09:19 10:08 X
Day 3 10:12 10:20 X
Day 3 11:23 11:26 X X
Day 3 11:31 12:00 X XSustainability 2020, 12, 8949 11 of 17
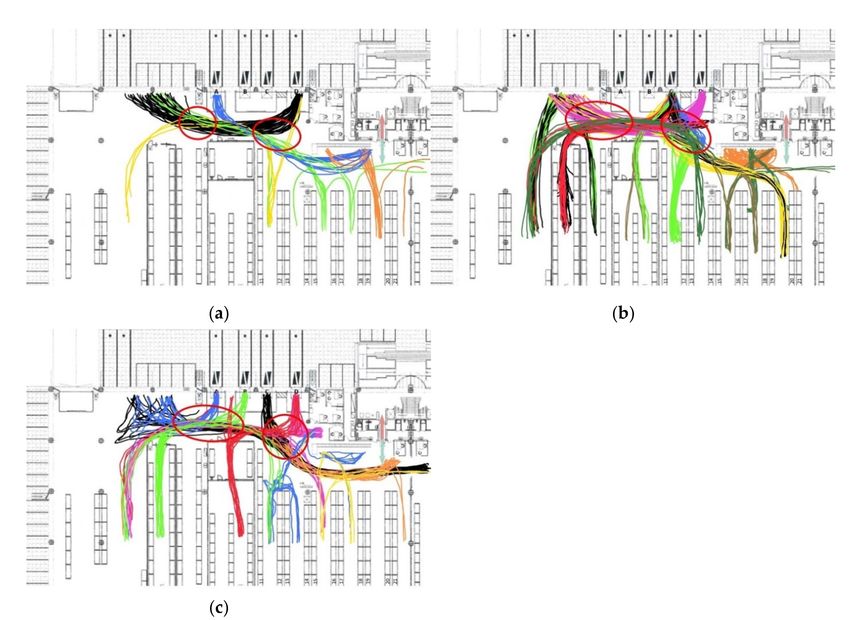
Figure 6 shows the smart spaghetti charts obtained (one for each inspection carried out).
Figure 6. The Figure shows the Smart Spaghetti charts obtained respectively after carrying out
the inspections on Day 1 (a), Day 2 (b), and Day 3 (c), whose information is detailed in Table 2.
In each mapping, colors were used to distinguish the workers (forklift drivers or pedestrians) moving
within the control volume. Red circles were added to highlight hot areas of the layout.
Red circles were added in the diagrams to highlight the “hot areas” of the layout, i.e., the areas
where near misses were detected and where intense flows were recorded. It should be noted that the
areas characterized by the most intense flows are those with reduced passage spaces and logistic surfaces.
In particular, there are two regions with the highest number of near misses.
1. The area between the waiting bay and cold room 1 (left circles, Figure 6a–c). Here, the raw
materials to be shipped to the internal customer accumulate, so they remain to occupy space and
increase the probability of having a near miss. As stated by [5], the high volume of material on
the ground is one of the causes of warehouse inefficiency and makes the processes unsafe and
very time-consuming.
2. The area in front of the discharge doors C and D (right circles, Figure 6a–c). This is where
palletizing and labeling operations and most truck transports are carried out. Even in this area,
forklifts and personnel remain to occupy space, increasing the probability of collisions.
Based on the outcome of 12 h of analysis and considering ∆t = 1s and c = 0.50 m (see Section 2,
Equations (3) and (4)), five near misses were detected in the from-to-chart. The first two near misses
occurred when several workers were carrying out internal order preparation and replenishment
activities simultaneously. In both cases, the palletizing and labeling bay (Figure 5) was occupied by
pallets, and an operator moving around reduced the passage section. This forced the other operators
directed to the waiting bay (Figure 5) to travel close or intersecting trajectories, leading them to risk
collision on two occasions. Figure 7 illustrates one of the two near misses just described.Sustainability 2020, 12, 8949 12 of 17
Figure 7. Near miss example. Each “spaghetto” corresponds to the trajectory of a different operator.
The orange worker was performing the labeling operation, while the green and blue workers were
performing internal order preparation and replenishment tasks. All the flows were detected at 10:45 a.m.
during Day 1. Due to the obstruction in the labeling and palletizing bay (orange flow), the green and
blue flows were forced to travel close trajectories and there was a near miss between forklifts.
In the case of the near miss shown in Figure 7, the intersection occurred when points A
(blue low, Figure 7) and B (green flow, Figure 7) met the conditions shown in Table 3.
Table 3. Numerical data characterizing the first near miss (graphically illustrated in Figure 7).
Resource A Resource B Measuring Unit
xt 44.1 42.9 [m]
yt 40.3 41.9 [m]
xt-1 43.0 42.5 [m]
yt-1 39.9 43.2 [m]
vt 1.17 1.36 [m/s]
ϑt 19.98 −72.90 [◦ ]
Means of Transport Forklift Forklift [-]
rt 2.36 2.68 [m]
Distance Between ABt 2.00 [m]
Sum of Radiit 5.03 [m]
Based on the data shown in Table 3, the circumference centered in A (6a–6d) and the straight line
perpendicular to the advancing direction of B (9a–9g) intersected at two points (two solutions). The first
solution is x1 = 42.19 and y1 = 41.68, while the second one is x2 = 44.91 and y2 = 42.52. Both solutions
had a Euclidean distance from B smaller than rB,t , therefore they belonged to the segment delimiting the
risk zone of B. Finally, the solution x2 = 44.91, y2 = 42.52 also respected condition (10), thus belonging
to the semi-plan where the semi-circumference delimiting the risk zone of A is situated.
!
xA,t−1 − xA,t
y2 − yA,t + (x2 − xA,t )
yA,t−1 − yA,t
(10)
43.0 − 44.10
= 42.52 − 40.30 + (44.91 − 44.10) = 4.45 ≥ 0,
39.9 − 40.30
The third and fourth near misses also occurred in close instants of time, when several workers
carrying out the internal order preparation and replenishment tasks almost collided. However, this time,
the reduction in the passage section was caused by the presence of other operators carrying out airSustainability 2020, 12, 8949 13 of 17
cargo unloading activities and occupying the area in front of doors C and D. Finally, the fifth near miss
occurred when some pallets containing refrigerated products, before being delivered by ship to the
external customer, were temporarily stored in the middle of a lane to be covered with thermal blankets.
In this situation, a forklift driver carrying out internal order preparation and replenishment, thinking he
could cross the (usually free) lane, risked an accident with the pedestrian applying the thermal blankets.
As a result, the analysis performed using smart spaghetti and from-to-chart confirmed the
initial impression of the supervisor: despite the presence of mirrors and guards, the reliability of the
warehouse can be improved. The smart spaghetti and from-to-chart enabled the warehouse supervisor
to describe the problems of the structure to his boss, highlighting graphically and through tabular
charts the hot areas and the less reliable scenarios. Since, in the initial situation of the warehouse,
several cameras had already been installed to observe the resource flows, watching the recorded footage,
a verification of the effectiveness of the proposed approach was obtained, confirming the presence of
the identified near misses and hot areas. Furthermore, confirmation was obtained of the near misses’
causes and the nature of the risky tasks.
The proposed approach constituted a valuable (although qualitative) decision support system.
Indeed, based on the information gathered, and by observing the flow and reliability maps,
some possible interventions to improve the safety and sustainability of the system were devised.
Below are listed, first, the problems encountered, then the possible solutions identified.
Hot areas and near misses occur in zones characterized by reduced passage spaces and
logistical surfaces. Sometimes the forklifts risk collisions and resource flows are slowed
down (or even blocked) by the presence of obstacles along their path. As shown in the
company’s database, currently, the static capacity of the warehouse is fully utilized, so a reduction
in pallet places in the analysis area seems not possible. Based on these considerations, to overcome
these problems, some ideas for improvement are as follows:
• To modify the warehouse layout by making more uniform use of the available surface, and gaining
space in critical areas by relocating or eliminating some shelves (in this case, better stock
management is necessary);
• To move the re-palletizing area to another area of the warehouse that is less frequented (not visible
in Figure 5 for privacy reasons);
• To open a new bay for loading air cargo into another area of the warehouse and/or to relocate the
bay for internal order preparation and replenishment;
• To establish one-way traffic directions (hypothesis to be evaluated by simulating the flows and
obtaining automatic mapping of the warehouse also in the goods reception area, not only in the
unloading area).
4. Discussion
The spaghetti chart, besides being a tool for implementing lean philosophy, can also be used to
build safety maps, qualitatively define the risk of collision between forklift drivers and pedestrians
in a warehouse, identify the less reliable tasks and areas of the layout, and, finally, devise potential
measures to increase the safety and sustainability of the system.
For this purpose, by exploiting proper smart tracking devices, it is possible to automate the
construction of spaghetti charts. Having performed a sufficient number of analyses (to obtain a
significant sample of flows), a visual representation of the system safety is obtained. By processing the
collected information, it is possible to fill in the from-to-chart, detecting near misses based on resource
braking distances and human reaction times. Then, observing the spaghetti maps, the color of spaghetti,
and the content of from-to-charts, the most critical warehouse areas and tasks (or combinations of them)
are highlighted. Based on the type and number of near misses and the reasons for their occurrence,
some possible improvements to the facility can be planned. In this perspective, the advantage of this
approach is that of being a structured design strategy suitable for devising only solutions related toSustainability 2020, 12, 8949 14 of 17
the effective problems of the warehouse. Changes may involve, for example, modifying the layout
of the system or work organization. The proposed approach allows remote examination of the near
miss dynamics and their causes, thus avoiding the need to personally inspect the system and reducing
analysis effort.
In the case study shown, the approach highlighted five near misses and two critical areas of
the layout, both corresponding to areas of the warehouse where raw materials and pallets accumulate.
In this sense, the results of the smart spaghetti and from-to-chart confirmed the statements by [5],
demonstrating that the areas of a structure where materials remain to occupy space are the most critical.
In the pharmaceutical warehouse, the accumulation of materials increases the probability of near
misses and accidents between forklifts.
The approach also showed that internal order and replenishment are the most problematic
activities (affecting four of the five near misses detected). The camera footage confirmed the presence
of all the near misses, validating the effectiveness of the criticality detection approach based on staff
speed and forklifts’ braking distance. In addition, the camera confirmed the near miss causes and
the presence of hot areas in the warehouse. The observation of critical events let us confirm that the
labeling bay, the bay for preparing the products to be shipped to the internal customer, and the bay
for loading the trucks (in front of the doors C and D) are the most hazardous areas of the warehouse.
Due to the layout and conformation of the system, when one of these three bays is filled with pallets
and forklifts moving inside it, the passage areas are restricted and, as a consequence, resource flows
are slowed down due to obstacles along their path and near misses occur.
The case study confirmed the applicability of the method in real-life contexts and made it possible
to hypothesize some improvements in the structure, including the elimination of some shelves,
the opening of a new loading bay for trucks, the establishment of one-way traffic directions, or the
shifting of the labeling and waiting bay.
Finally, the case study validated the claims by [26], showing that the spaghetti chart is a design
support tool appreciated by company staff, such that its results constitute an “impulse to look for
possibilities of implementing such improvements in other company areas”. Indeed, after seeing
the outcomes of the case study, and the speed and simplicity of the proposed qualitative approach,
the head of the pharmaceutical company asked to repeat the investigation in two other company areas.
The repetition of the analysis was facilitated by having automated the risk mapping procedure.
The proposed approach may be helpful as a support tool to assist companies in the design
phases of the warehouse, especially in the early stages of collecting ideas for planning/modifying
the layout and organization of the system. It allows representing the flows of a warehouse,
highlighting unreliability, and, therefore, hypothesizing improvements based on the identified hot areas,
critical tasks, and risky scenarios. Such an approach can be applied not only in warehouses but also
in other structures where dangerous means of transport are moved. It is particularly effective in
systems where work activities involve repetitive movements, as in the case study shown. In fact,
in this case, a limited number of inspections is sufficient to observe a significant sample of flows and
truly represent the reliability situation of the warehouse. However, it could also be applied in systems
where many activities are performed. In this case, the approach requires to study many scenarios
(many inspections) to obtain a faithful representation of the safety situation. However, this is not
a significant problem, indeed, using tracking devices to plot operators’ movements, the procedure
for mapping the diagrams is automated [8]. As a result, it is easy to repeat the analysis several
times and it is also possible, for example, to compare how the safety level changes before and after a
certain intervention. Moreover, the proposed approach may help to check whether the impressions of
the company staff in terms of structure reliability correspond to reality or not, making the operators
and the company manager more aware of the risks they are daily exposed to.
The method, however, has some disadvantages. First, it is not a real-time analysis approach but
rather is based on the study of offline information. Secondly, it is a qualitative approach, so it does not
give a numerical estimate of the reliability of the structure, nor does it make a quantitative predictionSustainability 2020, 12, 8949 15 of 17
regarding whether possible warehouse changes will lead to an improvement in safety performance.
Therefore, after having considered the possible corrective measures, it will be necessary to use other tools
such as logistic simulation [37,38] to test their real goodness before making the economic investment.
In addition to the logistic simulation, other traditional tools [39–42] allow the performance
of the layout to be quantitatively verified and, in this sense, are more accurate compared to the
proposed approach. However, these tools do not consider risks connected to forklift collisions to plan
possible improvements to the warehouse layout and organization. For this reason, aiming at increasing
the sustainability of the warehouse and the operators’ safety, the proposed approach may be preferable.
Possible future development of the present work could be as follows. First, to repeat the analysis in
other areas of the pharmaceutical company and to verify with other application case studies the accuracy
of the proposed approach. Secondly, to use the near miss detection model to prognosticate trajectories
and forecast risky situations, instead of identifying them afterward. In fact, up to now, the smart
spaghetti are traced and then the maps are analyzed offline, searching for the occurred near misses.
In the future, on the other hand, workers’ trajectories could be analyzed in real time, and possible near
misses could be predicted knowing the instantaneous position of workers. Eventually, these results
could be compared with those obtained through other forecasting methods [43]. Finally, to implement
changes to the warehouse selecting one or more ideas from those that emerged and to verify their
goodness with simulative or empirical methods [44,45]. The positive outcome of these scientific
investigations would give greater value to the proposed approach, confirming its effectiveness as a
smart design support tool. When using simulation or empirical models to confirm and refine the
results provided by the proposed approach, further development of the model could be as follows.
The data needed to feed the simulation or the empirical method could be collected automatically,
thus making automatic also the process of data acquisition and validation of the final solution, as well
as the process of designing ideas for improving the structure.
Author Contributions: Conceptualization, A.C., F.D.C. and M.T.; methodology, A.C. and F.D.C.; software, A.C.;
validation, F.D.C.; formal analysis, A.C. and M.T.; investigation, A.C.; resources, M.T.; data curation, A.C.;
writing—original draft preparation, A.C.; writing—review and editing, F.D.C.; visualization, A.C.; supervision,
F.D.C. and M.T.; project administration, F.D.C. All authors have read and agreed to the published version of
the manuscript.
Funding: This research received no external funding.
Conflicts of Interest: The authors declare no conflict of interest.
References
1. Bartholdi, J.J.; Hackman, S.T. Warehouse & Distribution Science. Release 0.94; The Supply Chain and Logistics
Institute School of Industrial and Systems Engineering, Georgia Institute of Technology: Atlanta, GA,
USA, 2011.
2. Rouwenhorst, B.; Reuter, B.; Stockrahm, V.; van Houtum, G.-J.; Mantel, R.J.; Zijm, W.H. Warehouse design
and control: Framework and literature review. Eur. J. Oper. Res. 2000, 122, 515–533. [CrossRef]
3. Bonilla-Ramirez, K.A.; Marcos-Palacios, P.; Quiroz-Flores, J.C.; Ramos-Palomino, E.D.; Alvarez-Merino, J.C.
Implementation of Lean Warehousing to Reduce the Level of Returns in a Distribution Company.
In Proceedings of the 2019 IEEE International Conference on Industrial Engineering and Engineering
Management (IEEM), Macao, China, 15–18 December 2019; pp. 886–890.
4. Van Der Aalst, W.M. Process mining: Discovering and improving Spaghetti and Lasagna processes.
In Proceedings of the 2011 IEEE Symposium on Computational Intelligence and Data Mining (CIDM),
Paris, France, 11–15 April 2011; pp. 1–7.
5. Ferreira, J.V.; Ramos, A.L.; Esteves, A.F. Continuous Improvement to Create Value: Warehouse Management
in a Telecommunications Company. In Proceedings of the International Conference on Industrial Engineering
and Operations Management, Bangkok, Thailand, 5–7 March 2019; pp. 1803–1810.
6. Nahavandi, S. Industry 5.0—A human-centric solution. Sustainability 2019, 11, 4371. [CrossRef]Sustainability 2020, 12, 8949 16 of 17
7. Uddin, M.; Gupta, A.; Maly, K.; Nadeem, T.; Godambe, S.; Zaritsky, A. SmartSpaghetti: Use of smart devices
to solve health care problems. In Proceedings of the 2013 IEEE International Conference on Bioinformatics
and Biomedicine, Shanghai, China, 18–21 December 2013; pp. 40–45. [CrossRef]
8. Uddin, M.; Gupta, A.; Maly, K.; Nadeem, T.; Godambe, S.; Zaritsky, A. SmartSpaghetti: Accurate and robust
tracking of Human’s location. In Proceedings of the IEEE-EMBS International Conference on Biomedical
and Health Informatics (BHI), Valencia, Spain, 28 July 2014; pp. 129–132. [CrossRef]
9. Costa, E.; Bragança, S.; Sousa, R.; Alves, A. Benefits from a SMED Application in a Punching Machine.
World Acad. Sci. Eng. Technol. 2013, 7, 379–385.
10. Falcone, D.; Silvestri, A.; Duraccio, V.; Bona, V.D. Material Flow Map and Layout Optimization: Action plan
and software validation. In Proceedings of the XV Summer School “Francesco Turco” Impianti Industriali
Meccanici, Porto Giardino, Monopoli, Italy, 14–18 September 2014.
11. Chiarini, A. Waste savings in patient transportation inside large hospitals using lean thinking tools and
logistic solutions. Leadersh. Health Serv. 2013, 26, 356–367. [CrossRef]
12. Toussaint, J.S.; Berry, L.L. The promise of Lean in health care. In Mayo Clinic Proceedings;
Elsevier: Amsterdam, The Netherlands, 2013; Volume 88, pp. 74–82. [CrossRef]
13. Yorukoglu, K.; Özer, E.; Alptekin, B.; Öcal, C. Improving histopathology laboratory productivity:
Process consultancy and A3 problem solving. Turk. Patoloji. Derg. Turk. J. Pathol. 2017, 33, 47–57.
[CrossRef] [PubMed]
14. Rauch, E.; Damian, A.; Holzner, P.; Matt, D.T. Lean Hospitality-Application of Lean Management methods in
the hotel sector. Procedia CIRP 2016, 41, 614–619. [CrossRef]
15. Abideen, A.Z.; Mohamad, F.B. Supply chain lead time reduction in a pharmaceutical production
warehouse—A case study. Int. J. Pharm. Healthc. Mark. 2019, 14, 61–88. [CrossRef]
16. Vivaldini, K.C.; Galdames, J.P.; Bueno, T.S.; Araújo, R.C.; Sobral, R.M.; Becker, M.; Caurin, G.A. Robotic forklifts
for intelligent warehouses: Routing, path planning, and auto-localization. In Proceedings of the
2010 IEEE International Conference on Industrial Technology, Vina del Mar, Chile, 14–17 March 2010;
pp. 1463–1468. [CrossRef]
17. Michalos, G.; Karvouniari, A.; Dimitropoulos, N.; Togias, T.; Makris, S. Workplace analysis and design using
virtual reality techniques. CIRP Ann. 2018, 67, 141–144. [CrossRef]
18. Ohno, T. Toyota Production System: Beyond Large-Scale Production; Productivity Press: Portland, OR, USA,
1988; Volume 1.
19. Womack, J.P.; Jones, D.T. Lean Thinking: Banish Waste and Create Wealth in Your Corporation; Free Press:
New York, NY, USA, 2003.
20. Goyal, G.; Verma, D.S. Optimization of plant layout in manufacturing industry. Int. J. Recent Technol. Eng. 2019,
8, 3115–3118. [CrossRef]
21. Nahmens, I.; Mullens, M. The impact of product choice on lean homebuilding. Constr. Innov. 2009,
9, 84–100. [CrossRef]
22. Pellegrini, S.; Shetty, D.; Manzione, L. Study and implementation of single minute exchange of die (SMED)
methodology in a setup reduction kaizen. In Proceedings of the 2012 International Conference on Industrial
Engineering and Operations Management, Istanbul, Turkey, 3–6 July 2012; pp. 1–11.
23. Collins, J.W.; Smith, G.S.; Baker, S.P.; Landsittel, D.P.; Warner, M. A case-control study of forklift and other
powered industrial vehicle incidents. Am. J. Ind. Med. 1999, 36, 522–531. [CrossRef]
24. Tan, K.-S.; Ahmed, M.D.; Sundaram, D. Sustainable warehouse management. In Proceedings of
the International Workshop on Enterprises & Organizational Modeling and Simulation, Amsterdam,
The Netherlands, 8–9 June 2009; pp. 1–15. [CrossRef]
25. Senderska, K.; Mareš, A.; Václav, Š. Spaghetti Diagram Application for Workers’movement Analysis.
UPB Sci. Bull. Ser. D 2017, 79, 139–150.
26. Hys, K.; Domagała, A. Application of spaghetti chart for production process streamlining. Case study.
Int. Sci. J. 2018, 89, 64–71. [CrossRef]
27. Dotoli, M.; Epicoco, N.; Falagario, M.; Costantino, N.; Turchiano, B. An integrated approach for warehouse
analysis and optimization: A case study. Comput. Ind. 2015, 70, 56–69. [CrossRef]
28. Ohu, I.P.; Cho, S.; Kim, D.H.; Lee, G.H. Ergonomic analysis of mobile cart–assisted stocking activities
using electromyography. Hum. Factors Ergon. Manuf. Serv. Ind. 2016, 26, 40–51. [CrossRef]Sustainability 2020, 12, 8949 17 of 17
29. Stylianou, G. Relative indoor spatial tracking and navigation. Int. J. Wirel. Mob. Comput. 2015,
9, 8–26. [CrossRef]
30. Savage, J. Ethnography and health care. BMJ 2000, 321, 1400–1402. [CrossRef]
31. Pitapurapu, R.; Gupta, A.; Maly, K.; Nadeem, T.; Govindarajulu, R.; Godambe, S.; Zaritsky, A. Dead Reckoning
with Smartphone Sensors for Emergency Rooms. In Proceedings of the International Conference on Smart
Homes and Health Telematics, Geneva, Switzerland, 10–12 June 2015; pp. 206–217. [CrossRef]
32. Hurtuk, J.; Červeňák, J.; Štancel, M.; Hulič, M.; Fecil’ak, P. Indoor navigation using IndoorAtlas library.
In Proceedings of the 2019 IEEE 17th International Symposium on Intelligent Systems and Informatics (SISY),
Subotica, Serbia, 12–14 September 2019; pp. 139–142. [CrossRef]
33. Womack, J.P.; Jones, D.T.; Roos, D. The Machine that Changed the World: The Story of Lean Production–Toyota’s
Secret Weapon in the Global Car Wars that is Now Revolutionizing World Industry; Harper Perennial: New York,
NY, USA, 1990; Volume 1.
34. Borsos, A.; Farah, H.; Laureshyn, A.; Hagenzieker, M. Are collision and crossing course surrogate safety
indicators transferable? A probability based approach using extreme value theory. Accid. Anal. Prev. 2020,
143. [CrossRef]
35. van der Schaaf, T.W.; Lucas, D.A.; Hale, A.R. Near Miss Reporting as a Safety Tool; Butterworth-Heinemann:
Oxford, UK, 2013; Volume 1.
36. Nagurnas, S.; Mitunevičius, V.; Unarski, J.; Wach, W. Evaluation of veracity of car braking parameters used
for the analysis of road accidents. Transport 2007, 22, 307–311. [CrossRef]
37. Falcone, D.; Silvestri, A.; Forcina, A.; Pacitto, A. Modeling and simulation of an assembly line: A new approach
for assignment and optimization of activities of operators. In Proceedings of the MAS (The International
Conference on Modeling and Applied Simulation), Rome, Italy, 12–14 September 2011; pp. 12–14.
38. Di Bona, G.; Duraccio, V.; Silvestri, A.; Forcina, A. Productive line reengineering through simulation
techniques. In Proceedings of the IASTED International Conference on Modelling, Identification and Control,
Innsbruck, Austria, 17–19 February 2014; pp. 291–296.
39. Muther, R. Systematic Layout Planning, 2nd ed.; Cahners Books: Boston, MA, USA, 1973; Volume 1.
40. Hillier, F.S. Quantitative tools for plant layout analysis. J. Ind. Eng. 1963, 14, 33–40.
41. Noy, P.C. Make the right plant layout-mathematically. Am. Mach. 1957, 101, 121–125.
42. Lee, R.C.; Moore, J.M. CORELAP–Computerized Relationship Layout Planning. J. Ind. Eng. 1967, 18, 195–200.
43. Agethen, P.; Gaisbauer, F.; Manns, M.; Link, M.; Rukzio, E. Towards realistic walk path simulation of single
subjects: Presenting a probabilistic motion planning algorithm. In Proceedings of the 11th Annual International
Conference on Motion, Interaction, and Games, Limassol, Cyprus, 8–10 November 2018; pp. 1–10.
44. Gagliardi, J.P.; Renaud, J.; Ruiz, A. A simulation model to improve warehouse operations. In Proceedings of
the 2007 Winter Simulation Conference, Washington, DC, USA, 9–12 December 2007; pp. 2012–2018. [CrossRef]
45. Patriarca, R.; Gravio, G.D.; Mancini, M.; Costantino, F. Change management in the ATM system:
Integrating information in the preliminary system safety assessment. Int. J. Appl. Decis. Sci. 2016,
9, 121–138. [CrossRef]
Publisher’s Note: MDPI stays neutral with regard to jurisdictional claims in published maps and institutional
affiliations.
© 2020 by the authors. Licensee MDPI, Basel, Switzerland. This article is an open access
article distributed under the terms and conditions of the Creative Commons Attribution
(CC BY) license (http://creativecommons.org/licenses/by/4.0/).You can also read