Transcriptome sequencing and multi-plex imaging of prostate cancer microenvironment reveals a dominant role for monocytic cells in progression ...
←
→
Page content transcription
If your browser does not render page correctly, please read the page content below
Mangiola et al. BMC Cancer      (2021) 21:846
https://doi.org/10.1186/s12885-021-08529-6

 RESEARCH ARTICLE                                                                                                                                     Open Access

Transcriptome sequencing and multi-plex
imaging of prostate cancer
microenvironment reveals a dominant role
for monocytic cells in progression
Stefano Mangiola1,2,3,4, Patrick McCoy2,3, Martin Modrak5, Fernando Souza-Fonseca-Guimaraes6, Daniel Blashki7,
Ryan Stuchbery3, Simon P. Keam8,9, Michael Kerger3, Ken Chow2,3, Chayanica Nasa10, Melanie Le Page10,
Natalie Lister11,12, Simon Monard10, Justin Peters13, Phil Dundee13, Scott G. Williams8,9, Anthony J. Costello2,3,
Paul J. Neeson8,9, Bhupinder Pal14, Nicholas D. Huntington11,12, Niall M. Corcoran2,3,15†,
Anthony T. Papenfuss1,4,8,9,16*† and Christopher M. Hovens2,3†

  Abstract
  Background: Prostate cancer is caused by genomic aberrations in normal epithelial cells, however clinical
  translation of findings from analyses of cancer cells alone has been very limited. A deeper understanding of the
  tumour microenvironment is needed to identify the key drivers of disease progression and reveal novel therapeutic
  opportunities.
  Results: In this study, the experimental enrichment of selected cell-types, the development of a Bayesian inference
  model for continuous differential transcript abundance, and multiplex immunohistochemistry permitted us to
  define the transcriptional landscape of the prostate cancer microenvironment along the disease progression axis.
  An important role of monocytes and macrophages in prostate cancer progression and disease recurrence was
  uncovered, supported by both transcriptional landscape findings and by differential tissue composition analyses.
  These findings were corroborated and validated by spatial analyses at the single-cell level using multiplex
  immunohistochemistry.
  Conclusions: This study advances our knowledge concerning the role of monocyte-derived recruitment in primary
  prostate cancer, and supports their key role in disease progression, patient survival and prostate microenvironment
  immune modulation.
  Keywords: Prostate cancer, Transcriptomics, FACS, Immunohistochemistry, Deconvolution, Bayes, Differential gene
  expression, CAPRA-S, Microenvironment, Epithelial, Myeloid, Macrophages, Cholesterol, PDL1

* Correspondence: papenfuss@wehi.edu.au
†
 Niall M. Corcoran, Anthony T. Papenfuss and Christopher M. Hovens
contributed equally to this work.
1
 Bioinformatics Division, The Walter and Eliza Hall Institute of Medical
Research, Parkville, Victoria, Australia
4
 Department of Medical Biology, University of Melbourne, Melbourne,
Victoria, Australia
Full list of author information is available at the end of the article

                                          © The Author(s). 2021 Open Access This article is licensed under a Creative Commons Attribution 4.0 International License,
                                          which permits use, sharing, adaptation, distribution and reproduction in any medium or format, as long as you give
                                          appropriate credit to the original author(s) and the source, provide a link to the Creative Commons licence, and indicate if
                                          changes were made. The images or other third party material in this article are included in the article's Creative Commons
                                          licence, unless indicated otherwise in a credit line to the material. If material is not included in the article's Creative Commons
                                          licence and your intended use is not permitted by statutory regulation or exceeds the permitted use, you will need to obtain
                                          permission directly from the copyright holder. To view a copy of this licence, visit http://creativecommons.org/licenses/by/4.0/.
                                          The Creative Commons Public Domain Dedication waiver (http://creativecommons.org/publicdomain/zero/1.0/) applies to the
                                          data made available in this article, unless otherwise stated in a credit line to the data.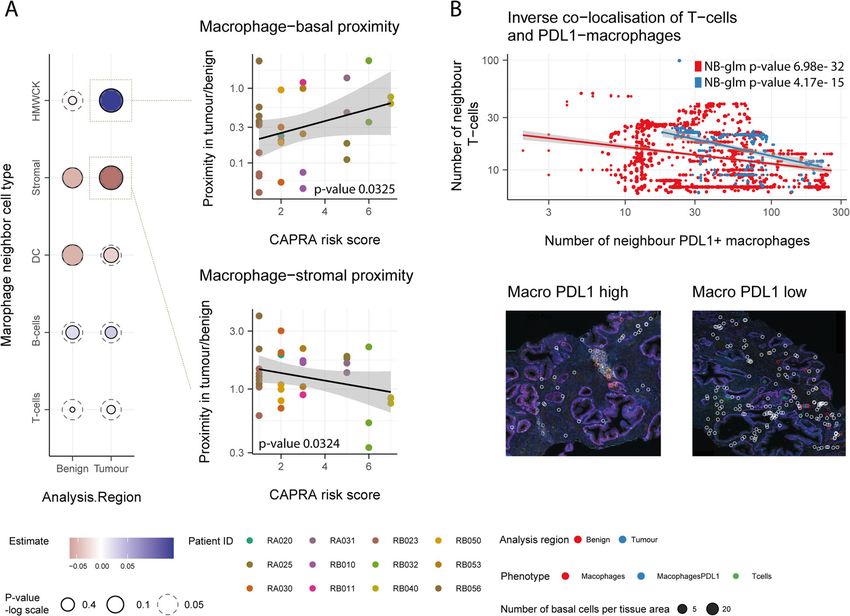
Mangiola et al. BMC Cancer   (2021) 21:846                                                                       Page 2 of 18

Background                                                      in transcription without a priori patient risk stratification
Prostate cancer is the second most commonly diagnosed           and robustly mapped transcriptional change events to
cancer in men globally [1]. Although most cancers fol-          cancer risk states. Among the list of significant genes for
low an indolent clinical course, an unpredictable 10–           the four cell types coding for cell-surface and secreted
15% of tumours progress to metastases and death. The            proteins, we identified several hallmarks of prostate can-
inability to discern progressive disease at an early stage      cer. These hallmarks included a dominant signal for
results in substantial overtreatment of localised disease,      monocyte-derived cell recruitment. We tested this with
leading to a significant clinical cost to the patient and       tissue deconvolution on the extensive Cancer Genome
economic cost to the healthcare system. Selecting pa-           Atlas (TCGA) cohort and multiplex immunohistochem-
tients for treatment is usually reliant on a small number       istry on an independent patient cohort. The latter
of well-established clinical and pathological factors, such     single-cell resolution spatial analysis revealed the rela-
as tumour grade, prostate serum antigen (PSA) level and         tionship between macrophages and epithelial and T cells
clinical stage [2], the development of metastases [3] and       with progression. For prostate cancer, prioritising targets
prostate cancer-specific death [4]. Although comprehen-         for immunotherapies is far from settled in the literature,
sive molecular analyses have linked clinical outcomes           with monocytic cells being an under-represented player
with rates of genomic alterations [5, 6], such as somatic       [15, 16]. In this scenario, the parallel lines of evidence
changes in copy number, nucleotide sequence and                 we provide from unbiased analyses contribute to shaping
methylation, it is yet to be demonstrated that such mea-        future research directions.
sures are able to consistently outperform standard
clinico-pathological risk scoring across a broad range of       Methods
grades and stages. Despite many years of tumour evolu-          Tissue sampling and processing
tion characterization, it still remains unclear what mech-      Following the prostatectomy of 13 patients, a four-
anisms drive prostate cancer progression in most                millimetre tissue core was collected from the prostate
patients [7]. It is believed that reciprocal interactions be-   tumour site, conditional to histopathological verification
tween malignant epithelium and surrounding non-                 [17, 18]. The patient cohort ranged from 52 to 78 years
cancerous cells within the tumour microenvironment              of age and from CAPRA-S risk score of 0 (attributed to
are responsible for driving disease progression [8, 9].         benign tissue samples, harvested from a site far from a
   Selected targets in the prostate tumour microenviron-        low grade, low volume cancer) to 7 (Supplementary file
ment have been extensively studied through in vitro and         4), If not otherwise specified, all procedures were carried
in vivo experiments, such as migration assays [10] and          out at 4 °C. Tissue blocks were washed in phosphate-
xenograft mouse models [11] respectively. More re-              buffered saline (PBS) solution for 2 min and minced for
cently, several studies that integrated fluorescence-           2 min with a scalpel. Homogenised tissue was added to a
activated cell sorting or laser microdissection with RNA        solution (total volume of 7 ml) composed by of 1 mg/ml
sequencing increased the gene and sample throughput             collagenase IV (Worthington Biochemical Corp, USA),
while maintaining a degree of resolution of the tissue          0.02 mg/ml DNase 1 (New England Biolabs, USA), 0.2
heterogeneity [8, 12, 13]. Additionally, the use of spatial     mg/ml dispase (Merck, USA). The homogenised tissue
transcriptomics has identified gradients of benign-cell         was serially digested in the shaker incubator at 37 °C at
gene transcription around tumour foci [14]. However,            180 rpm (4 g), through three steps of 5, 10 and 10 min of
these studies mainly focused on the process of epithelial       duration. The final 3 min were dedicated to sedimenta-
to mesenchymal transition [12, 13] or were limited to           tion at 0 rpm. After each digestion step, the supernatant
the overall stromal contribution to disease progression         was aspirated and filtered through a 70 μm strainer into
[8]. An integrative investigation of immune, stromal and        a pre-chilled tube, diluting the solution with 15 ml of
cancer cell transcriptional changes associated with clin-       Dulbecco’s PBS containing 2% Bovine serum (dPBS-
ical risk is still lacking.                                     serum) to quench the enzymatic reaction. The resulting
   In this study, we applied an optimised protocol for          cumulative solution was then centrifuged at 300gfor five
combined cell-type enrichment and ultra-low-input               minutes, with the supernatant collected and the cell pel-
RNA sequencing, which allowed the probing of four key           let resuspended into 1 ml 2% PBS-serum before labelling
cell types across 13 fresh prostate tissue spanning a           (Fig. S1).
broad clinical disease spectrum. Motivated by the
pseudo-continuous properties of the CAPRA-S risk                Antibody labelling, flow cytometry and cell storage
score, we developed a novel statistical inference model         The cell preparation was labelled with the following
for differential transcription analyses on continuous co-       antibodies: CD3-BV711 (Becton Dickinson San Jose Ca),
variates, TABI (Transcriptional Analysis through Bayes-         EpCAM-PE (BD Biosciences, USA), CD31-APC (BD
ian Inference). Our inference model estimated changes           Biosciences,   USA),    CD90-PerCP-Cy5.5     (Becton
Mangiola et al. BMC Cancer   (2021) 21:846                                                                       Page 3 of 18

Dickinson San Jose Ca), CD45 APC-CY7, and CD16 Pa-            Input RNA Kit (Clontech). The first-strand cDNA syn-
cific Blue (BD Biosciences, USA). All antibodies were         thesis utilised 3′ SMART-Seq CDS Primer II-A. The
used at concentrations according to manufacturers rec-        SMART-Seq v4 Oligonucleotide together with the
ommendations and incubated for 30 mins at 4 °C. Fol-          cDNA amplification was carried out on Thermocycler
lowing labelling, the cells were diluted to 5 ml and          using PCR Primer II-A and PCR conditions: 95 °C for 1
centrifuged at 300 g for 5 min. The supernatant was           min, 12 cycles of 98 °C 10 s, 65 °C 30 s and 68 °C 3 min;
removed, and the cell pellet was resuspended in dPBS-         72 °C for 10 min and 4 °C until completion. The PCR-
serum. The viability die (7AAD) was added to the sus-         amplified cDNA was purified using AMPure XP beads
pension to a final concentration of 5 μg/ml. Epithelial,      and processed with the Nextera XT DNA Library Prep-
fibroblasts, myeloid and T cells were sorted using a          aration Kits (Illumina, Cat. # FC-131-1024 and FC- 131-
fluorescence-activated cell sorting Aria III cell sorter      1096) as per the protocol provided by the manufacturer.
(Becton Dickinson San Jose, Ca). The cell sorting strat-         Sequencing library preparation (10–100 ng) was car-
egy utilised a robust 3 stage design: (i) a series of gates   ried out using Truseq RNA Sample Preparation Kit v2.
based on forward and side scatter to exclude debris, cell     The poly-A containing mRNA was purified using oligo-
clumps and doublets. (ii) a gate to exclude all dead cells    dT bound magnetic beads followed by fragmentation.
and (iii) a combination of the fluorescent antibodies to      The first-strand cDNA synthesis utilised random
allow purification of the above cell types. The four cell     primers, and second-strand cDNA synthesis was carried
types were identified as follows: T Cells: FSC and SSC        out using DNA Polymerase I. The cDNA fragments then
lo, PI negative, EpCAM and CD31 negative, CD3 and             underwent an end-repair process, adding a single ‘A’
CD45 positive. Epithelial cells: FSC and SSC high, PI         base and ligation of the RNA adapters. The adaptor-
negative, CD31 and CD90 negative and EpCAM positive.          ligated cDNA samples were bead-purified and enriched
Myeloid cells: FSC and SSC hi and medium, PI negative,        with PCR (15 cycles) to generate the final RNAseq
CD31 and EpCAM negative and CD16 positive. Fibro-             library.
blasts: FSC and SSC hi, PI negative, EpCAM and CD31              The SMART-Seq v4 RNA and Truseq RNA libraries
negative, CD90 positive. The four purified populations        were sequenced on an Illumina Nextseq 500 to generate
were sorted directly into 1.5 ml conical tubes and stored     15–20 million 75 base pairs paired-end reads for each
on dry ice immediately after collection before permanent      sample. The batch effect due to sequencing runs was
storage at − 80 °C.                                           minimised by pooling all 52 libraries and carrying out
                                                              three sequential runs on a Nextseq500 sequencer.
RNA extraction, library preparation and RNA sequencing
RNA extraction was performed in two batches (compris-         Sequencing data quality control, mapping and read
ing 6 and 7 patients, for a total of 24 and 28 samples, re-   counting
spectively) on consecutive days. In order to eliminate        The quality of the sequenced reads for each sample was
time-dependent methodological biases, the two patient         checked using the Fastqc [19]. Reads were trimmed for
batches included a balanced distribution of Gleason           custom Nextera Illumina adapters; low-quality fragments
score (means 2.00 and 2.71, standard deviations 2.50,         and short reads were filtered out from the pools using
1.86; Supplementary file 4) and days elapsed from tissue      BBDuk (jgi.doe.gov) according to default settings. All
processing (means 197 and 222, standard deviations 46.3       remaining reads were aligned to the reference genome
and 71.9; Supplementary file 4). The RNA extraction           hg38 using the STAR aligner [20] with default settings.
was performed using the miRNeasy Micro Kit (Qiagen;           The quality control on the alignment was performed
Cat #217084), according to the manufacturer’s protocol.       with RNA-SeQC [21]. For each sample, the gene tran-
Briefly, cell pellets were lysed with QIAzol lysis reagent,   scription abundance was quantified in terms of nucleo-
treated with chloroform, and centrifugation carried out       tide reads per gene (read-count) using FeatureCounts
to separate the aqueous phase. Total RNA was precipi-         [22] with the following settings: isPairedEnd = T, requir-
tated from the aqueous phase using absolute ethanol, fil-     eBothEndsMapped = T, checkFragLength = F, useMeta-
tered through the MinElute spin column and treated            Features = T. All sequenced reads that did not align to
with DNase I to remove genomic DNA. The RNA                   the reference human genome were assigned to bacterial
bound columns were washed with the buffers RWT and            and viral reference genomes using Kraken [23] with de-
RPE before eluting the total RNA with 14 μl of RNase-         fault settings.
free water. RNA estimation was carried out using Tapes-
tation (Agilent).                                             Statistical inference of differential gene transcript-
  According to the manufacturer’s protocol, transcrip-        abundance
tome sequencing on low input total RNA samples (up to         Changes of transcriptional levels along CAPRA-S risk
10 ng) was carried out using SMART-Seq v4 Ultra Low           score [24] were estimated independently for each cell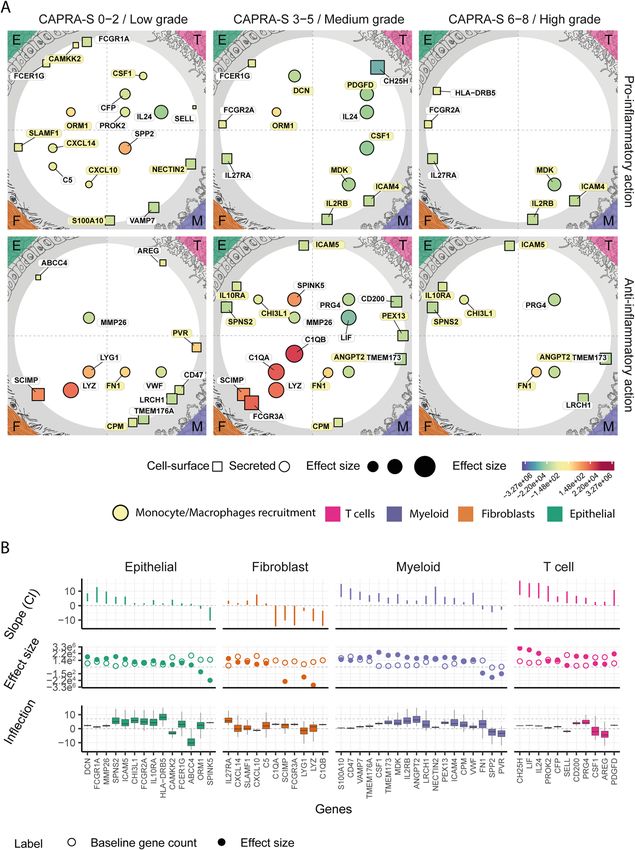
Mangiola et al. BMC Cancer     (2021) 21:846                                                                      Page 4 of 18

type (epithelial, fibroblast, myeloid and T cell). The             P ðγ ÞP ðδ ÞP ðσ! ÞP ðηÞPðξ ÞP ðβ̇jξ Þ     !
CAPRA-S risk score is a combination of (i) concentra-                Y R                 Y G    0
tion of blood prostate serum antigen (PSA); (ii) presence                 P ðβr jσ Þ
                                                                                             P yog γ ; γ  ″

of surgical margin (SM); (iii) Gleason score; (iv) presence           r¼2                g¼1
                                                                                                  !                       ð3Þ
of seminal vesicle invasion (SVI); (v) the extent of extra-          Y G Y S
                                                                                        ^
                                                                               P Y g;s Y ; δ; ω
capsular extension (ECE); and (vi) lymph node involve-               g¼1 s¼1
ment. The RNA extraction batch was used as a further

covariate. Due to the absence of publicly available               Y t;g ∼NB expðδ t ÞY^ t;g ; ω                           ð4Þ
models for non-linear monotonic regression along a
continuous covariate, a new Bayesian inference model              Y^ t;g ¼ GLA X t; y0g ; βg ; ηg                         ð5Þ
was implemented. This model is based on the simplified
Richard’s curve [25] (Eq.1) but re-parameterised to im-           βg;1 ∼ RegHorseshoeð…Þ                                  ð6Þ
prove numerical stability (Eq. 2). In particular, the stand-
ard parametrisation suffers from non-determinability               βg;k ∼N ð0; σ k Þ; k > 1
                                                                                                                          ð7Þ
issues if the slope is close to zero; furthermore, in the          σ k ∼HalfN ð0; 1Þ
case of an exponential-like trend, the upper plateau is
not supported by data and tends to infinity.                       y0g ∼Gammaðγ 1 þ 1; γ 2 Þ
                                                                   γ i ∼Exponentialð1Þ                                    ð8Þ
                                                                   ω∼Gammað1:02; 2Þ
                               k                                   ηg ∼N ð0; 1Þ
    GL ðX; α; β; κ Þ ¼                                  ð1Þ                       X                                       ð9Þ
                         1þ   e−ðαþXβÞ                             δ t ∼N ð0; 1Þ;   δ t ∼N ð0; 0:001T Þ

                         y0 1 þ eηβ1                             Y represents raw transcript abundance, Y^ represents
    GLA ðX; y0 ; β; ηÞ ¼                                ð2Þ
                          1 þ eηβ1 −Xβ                         the expected values of transcript abundance, and X rep-
                                                               resents the design matrix (with no intercept term and
  The new parameter y0 represents the intercept on             scaled covariates). The regression function also includes
the y axis, η represents the point of inflection on the        β, which represents the gene-wise matrix of factors (i.e.
x-axis, β represents the matrix of coefficients (i.e.          slopes excluding the intercept term), y and η, which rep-
slope coefficients, without the intercept term), β1 rep-       resent the gene-wise y-intercept and the inflection point
resents the coefficient of interest (i.e. main slope),         of the generalised reparameterised sigmoid function (Eq.
and k the upper plateau of the generalised sigmoid             2). γ represents the hyperparameters of y. Other parame-
function.                                                      ters of the negative binomial function are δ, which rep-
  Bayesian inference was used to infer the values of all       resents the normalisation factors, and ω, which
parameters of the model, with TABI (GitHub: steman-            represents overdispersion. The regularising prior (for
giola/TABI@v0.1.3). The probabilistic framework Stan           imposing the sparsity assumption) over the covariate of
[26] was used to encode the joint probability function of      interest β1 (first column of β) is defined by the hyper-
the model (Eq. 3). We partitioned the transcriptomic           parameter list ξ [27] (i.e. nu_local = 1; nu_global = 1;
dataset into blocks of 5000 genes to decrease the analysis     par_ratio = 0.8; slab_df = 4; slab_scale = 0.5), while σ
run-time. This Bayes model is based on a negative bino-        represents the standard deviations of the other factors
mial distribution (parameterised as mean and overdis-          (in our case only the batch). The algorithm multidimen-
persion). In order to account for various sequencing           sional scaling [28] was used to map the data in two-
depths across samples, a sample-wise normalisation par-        dimensional space.
ameter was added to the negative binomial expected
value. The slope parameter for the main covariate (β1)         Gene annotation
was subject to a regularised horseshoe prior [27] to in-       Each gene (g) was considered well fitted by the model if
crease the robustness of the inference of transcription        it had read counts outside the 95th percentile of the
changes and help anchor data from different samples for        generated quantities for three or fewer samples (accord-
normalisation. The role of this prior is to impose a           ing to posterior predictive checks standards [29]).
sparsity assumption on the gene-wise transcriptional           Among the well-fitted genes, those for which the 0.95
changes; that is, most genes are not Tdifferentially tran-     credible intervals of the posterior distribution of the fac-
scribed. The overall distribution of the gene intercepts       tor of interest β1g did not include the value 0 were la-
follows a gamma probability function. The following            belled as differentially transcribed. The credible interval
joint probability density defines the statistical model.       is a numerical range within which an unobserved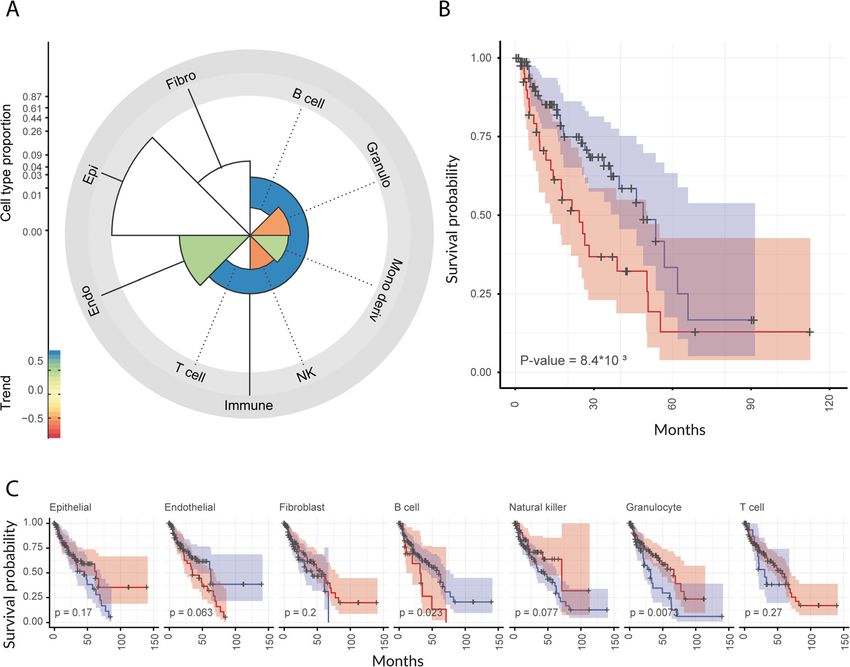
Mangiola et al. BMC Cancer   (2021) 21:846                                                                      Page 5 of 18

parameter value falls within a certain probability. As dis-    cell types and 18 cell phenotypes. Genes whose tran-
tinct from standard practices for frequentist models op-       scription varied across datasets (detected using Limma
erating on confidence intervals and p-values, for this         [28]) were used to identify highly correlated datasets.
study, the credible interval probability threshold was not     The Pearson correlation was calculated for all-versus-all
altered for multiple hypothesis testing, consistently with     samples. The samples with a Pearson correlation greater
standard practices in Bayesian statistics [30].                than 0.99 were discarded as redundant. Each cell-type
  In order to interpret the inflection points over the         category was classified as belonging to a node of the
CAPRA-S risk score (i.e. the point of the maximum              cell-differentiation tree, which includes epithelial, fibro-
slope; at what stage of the disease a transcriptional          blasts, endothelial and immune cells in the first level,
change happens) covariate in a biologically meaningful         and B-, T-, natural killer, monocyte-derived, and gran-
way, the inflection point was adjusted to the log-scale.       ulocyte cells. For each cell type in the differentiation
Considering that the lower plateau of our generalised          tree, the gene-transcript abundance was modelled using
sigmoid function was set to 0 (to limit the number of pa-      a negative binomial distribution (parameterised by mean
rameters needed to model it), the inflection point of the      and overdispersion). Differences in sequencing depth
logarithm-transformed function is not defined. There-          across biological replicates were modelled with a bio-
fore, we calculated the inflection point (X) of the log sig-   logical replicate-wise exposure rate term ϵ that multi-
moid forcing a plateau at 1 (i.e. log (0) = 1; Eq. 10; Fig.    plies the transcripts expected abundance (mean). For
S7). This new inflection point can now be calculated as        each cell-type pair of the same level, 40 genes (20 for
the value of the x-axis at half distance between zero and      each direction) were selected that (i) were abundant
the upper plateau of the generalised reparameterised sig-      (had a mean value higher than the median of all genes),
moid function (Eq. 10).                                        and (ii) segregated the two cell types (having the largest
                   y0 pffiffiffiffiffiffiffiffiffiffiffiffiffiffiffiffiffiffiffiffiffi                 gap between the upper quantile of one cell-type and the
         β1 η− log e 2 ey0η þ 1−1                              lower quantile of the other; 95% credible interval). The
    Ẋ ¼                                               ð10Þ    gene selection for each level was represented by the
                      y0
                                                               union of marker genes for all cell-type pairs. The infer-
  Genes were functionally annotated with gene ontology         ence was carried out along the two levels of the hier-
categories [31] using BiomaRt [32]. Furthermore, genes         archy structure, and the inference for each node (e.g. T-
were functionally annotated with the protein atlas data-       cells) was relative to its parent (e.g. immune cells).
base [33] for identifying those that interface with the
extracellular environment, encoding for cell-surface and       Analysis of tumour microenvironment using multiplex
secreted proteins. For a more in-depth analysis of pos-        immunohistochemistry
sible interactions between cell types, we compiled a cell-     Slides (3 μm) from formalin-fixed and paraffin-
type-specific annotation database for cell-surface and se-     embedded (FFPE) tissue were taken from a total of 63
creted protein-coding genes (Supplementary file 3).            core biopsies of localised prostate cancer across 17 pa-
                                                               tients. A pathological evaluation was done to define the
Differential tissue composition analyses                       tumour and surrounding benign tissue areas for each bi-
The differential tissue composition analysis is composed       opsy. The methodology for performing multiplex immu-
of two integrated modules. First, a module infers tissue       nohistochemistry, cell type classification and localisation
composition from whole-tissue gene transcript abun-            has been detailed by Keam et al. [39]. Briefly, slides were
dances based on reference transcriptional profiles of          deparaffinised and rehydrated with xylene and ethanol.
pure cell types (deconvolution). Second, a module for          The fluorochrome-coupled antibodies against human
beta regression on the inferred proportions along the          CD68 (macrophages and dendritic cells), high molecular
factor of interest (and additional covariates). Bayesian in-   weight cytokeratin (HMWCK; epithelial basal cells),
ference allows the transfer of the uncertainty between         CD3 (T cells), CD20 (B cells), CD11c (dendritic cells),
the two modules (GitHub: stemangiola/ARMET@v0.7.1).            and PDL1 were used. The dye DAPI was used for nuclei
The probabilistic framework Stan [26] was used to en-          staining. Vectra 3.0 Automated Quantitative Pathology
code the joint probability function of the model [34].         Imaging System (Perkin Elmer, MA) was used for im-
The 0.95 credible interval of the posterior distributions      aging, as Keam et al. [39] detailed. The software HALO
was used as a significance threshold.                          was used for cell segmentation and phenotyping. Stro-
  The supervised deconvolution was based on deconvo-           mal cells were defined with the negative selection of all
lution signatures created using a curated collection of        antibodies (DAPI positive) and with filtering by large
250 publicly available transcriptional profiles (included      size (cell area > 70) and highly elongated shape (ratio of
in BLUEPRINT [35], ENCODE [36], GSE89442 [37] and              largest dimension and smallest dimension > 2; 0.9 per-
GSE107011 [38]) encompassing of 8 broad categories of          centile; 0.9 percentile; Fig. S6).
Mangiola et al. BMC Cancer (2021) 21:846 Page 6 of 18
Cell type proximity was quantified as the number of by the dashed grey line; tested with linear regression, lm
cells within a radius of 20 cells sizes from a selected cell, function from R). A clear gradient in risk score was seen
averaged per tissue area (5 cell size units) for smoothing for epithelial and fibroblasts (Bonferroni adjusted p-
and avoiding information duplication due to tight cell value of 1.0 × 10− 2 and 9.7 × 10⁻³, respectively). A
clusters. Cell relative size was calculated at 15 units as weaker pattern was apparent for myeloid and T cells
the observed median length units in the coordinate sys- (Bonferroni adjusted p-value of 3.0 × 10− 2 and 0.37 re-
tem. The statistics were summarised at the biopsy level. spectively), possibly due to the greater heterogeneity of
When the distance between two cell types was mea- the two immune cell populations than epithelial and
sured, only the biopsies including both cell types were fibroblasts.
selected. The robust regression analyses were performed We performed a differential transcript abundance
using the R heavy package [40] on log-transformed prox- analysis (at the gene level) for each cell type inde-
imity measure. The co-proximity analysis between epi- pendently, seeking associations between transcript
thelial basal cells and PDL1+ macrophages and T cells abundance across subjects and CAPRA-S risk score,
was performed at the single cell level (averaged by tissue treated as pseudo-continuous variables. In order to
area of 5 cell size units). We calculated the proximity on perform differential analyses that would robustly
a radius of 50 relative cell sizes for ensuring good cover- model the pseudo-continuous properties of the
age of both T cells and PDL1+ macrophages and de- CAPRA-S risk score (Fig. 1a), we developed a Bayes-
crease sparsity. Only the epithelial basal cells in immune ian inference model (TABI) that implements a robust
rich areas (with > 5 neighbour T cells) were considered. generalised sigmoid regression (i.e. sigmoid function
extending from zero to any positive value). TABI was
Result used to model the gene transcript abundance as a
Data generation and quality continuous function of CAPRA-S risk score (from 0
To investigate the role of the tumour microenvironment representing benign to 7 representing high risk); this
in patient outcome, we enriched for four cell popula- avoids the loss of information caused by patients’ a
tions (epithelial: EpCAM+; fibroblasts CD90+/CD31−; T priori stratification in low−/high-risk groups based on
cells: CD45+/CD3+; and myeloid: CD45+/CD16+) from an arbitrary threshold. In principle, using a general-
fresh prostatectomies of 13 prostate cancers, ranging ised sigmoid function permits modelling linear, expo-
from benign tissue (labelled as CAPRA-S score 0) to nential and sigmoid-like trends of transcriptional
high-risk tumours (CAPRA-S risk score 7). The choice alterations (Fig. 1b and c). However, to provide robust
of those cell populations was guided by their predomin- modelling for RNA sequencing data, we reparame-
ant role in the progression of prostate and other cancers terised the generalised sigmoid function to suit better
[41–45]. Technical and practical experimental limita- the numerical properties of transcript abundance (Fig.
tions prevented considering other key cell types such as 1b; Materials and Methods). In addition to robust-
luminal and basal epithelial compartments, endothelial, ness, the sigmoid function allows mapping each dif-
smooth muscle and other lymphocytes such as B and ferential transcriptional event with a clinical risk
natural killer cells. RNA extracted from the four cell state, effectively providing a new developmental di-
populations was then sequenced, generating a median of mension to the analyses. This mapping is possible be-
22 million reads per library (Fig. S1 and S2). Overall for cause the inflection point represents the CAPRA-S
the four cell type categories, a conservative cell-type pur- risk score at which the transcriptional alteration is
ity inference (using Cibersort and a Bayesian estimator; most pronounced. The location of the most rapid
Material and Methods) estimated high enrichment: 99% change can be highly localised in the case of a dra-
for epithelial samples; 99% for fibroblasts; 97% for mye- matic change in transcription at a specific risk score
loid (83% for neutrophils; 14% for monocyte-derived or can be diffused in the case of a gradual change of
cells); and 95% for T cells (Fig. S3). On average, across transcription along the risk score range (Fig. 1c).
the four cell types, 40% of genes had 0 sequenced reads Following the statistical inference of transcriptional al-
in more than half of the samples and were removed terations, an average of 10% of genes was removed based
from further analysis. on the posterior predictive check across all samples [29],
as not satisfying the assumptions of our model (Table 1;
Differential transcription and model fitting Materials and Methods). A total of 1626 genes were
Dimensionality reduction (multidimensional scaling; in identified as differentially transcribed across the four cell
Materials and Methods) of the filtered transcript abun- type categories (i.e. 95% credible interval excluding zero;
dance revealed an association of CAPRA-S risk score with no need for multiple test adaptation, consistent
with either the first and the second principal compo- with standard practices in Bayesian statistics [30]; Table
nents (Fig. 1a; with an indicative direction represented 1; Supplementary file 1). The distributions of differentialMangiola et al. BMC Cancer (2021) 21:846 Page 7 of 18 Fig. 1 (See legend on next page.)
Mangiola et al. BMC Cancer             (2021) 21:846                                                                                                      Page 8 of 18

  (See figure on previous page.)
  Fig. 1 The continuous relationship between the CAPRA-S risk score and gene transcript abundance. A Multidimensional scaling plots of transcript
  abundance grouped by cell type. The colour coding represents the CAPRA-S risk score. The risk-score is correlated with the first and second
  dimension, particularly in epithelial and fibroblast cells (linear regression performed using lm in R; Bonferroni adjusted p-value of 0.0187, 0.00971,
  0.0306 and 0.367, respectively). Alphanumeric codes refer to patient identifiers (Supplementary Table S1). The dashed lines indicate the correlation
  between the first and the second dimension with the CAPRA-S risk score. B Re-parameterisation of the generalised sigmoid function and
  probabilistic model (Material and Methods). Left-panel: The three reference parameters for the standard parameterisation (blue). Alternative robust
  parameterisation (red). Right-panel: a graphic representation of the probabilistic model TABI. C Examples of continuous relationships between
  transcript abundance of four representative genes and CAPRA-S risk score (for epithelial cell population), from more discrete-like to more linear-
  like. The bottom panel displays the inferred distribution of possible values (as posterior distribution) of the inflection point for each gene
  sigmoid trend

transcription events along the CAPRA-S risk score range                               directly influence other cell types. On average, across the
are concentrated on low-risk scores (Fig. S4) for the four                            four cell types, 35% of differentially transcribed genes
cell types, indicating that most transcriptional changes                              encode for cellular-interface proteins; of those, 148
occur early in cancer developmental stages (including                                 genes have been previously described as cancer-related
benign prostate tissue).                                                              genes. For all cell types, most cancer genes have a direc-
                                                                                      tion of change for all cell types consistent with the direc-
Differentially transcribed cell-surface and secreted                                  tion reported in the literature (35 vs 13 for epithelial; 17
protein-coding genes are linked with recurring cancer                                 vs 8 for fibroblasts; 32 vs 6 for myeloid cells; and 26 vs
hallmarks                                                                             11 for T cells; Supplementary file 3).
In order to provide an initial biological evaluation of the                              In order to allow an in-depth interpretation of the
resultant differentially transcribed genes, we sought the                             concurrent transcriptional differences for cell-surface
overlap with cancer-related gene datasets and calculated                              and secreted protein-coding genes across cell-types, we
the enrichment of gene sets against functional and clin-                              produced a cell-type and disease-specific annotation
ical gene annotation databases. On average, across the                                database integrating curated cell-specific Gene Ontology
four cell types, 14% of all the differentially transcribed                            information [31] with more than 1500 scientific articles
genes have been previously identified as cancer-related;                              (Supplementary file 3). This database allowed us to iden-
of these, 24% have been previously described as prostate                              tify six recurring hallmarks of cancer (Fig. 2): (i) immune
cancer-related genes [46] (Table 1). For differentially                               modulation; (ii) cancer cell migration; (iii) angiogenesis;
transcribed cell-surface and secreted protein-coding                                  (iv) hormonal homeostasis; (v) epithelial/cancer cell
genes, an average of 33 and 51% have been previously                                  growth; and (vi) osteogenesis. Among the immune
described as cancer and prostate cancer-related genes,                                modulation related genes, a balance exists between pro
respectively [46] (Table 1). In order to investigate pos-                             and anti-inflammatory. This balance appears to be dy-
sible cell-cell interactions within the primary prostate                              namic along the disease progression course. The epithe-
tumour microenvironment, we focused on genes encod-                                   lial cell migration hallmark includes three main
ing for cell-surface and secreted proteins, which may                                 functional clusters: tissue remodelling, tissue fibrosis and

Table 1 Summary statistics of the differential transcription analysis, including 52 samples from 13 patients and 4 enriched cell types
Cell type Total Genes            Genes       Differentially transcribed                           Differentially transcribed in the interface (curated
          genes filtered         filtered                                                         annotation)
                (zeros)          (PPC)
                                             Total (up/     Of which             Of which PC Total (up/           Of which cancer              Of which PC genes,
                                             down)          cancer genes         genes       down)                genes, consistent            consistent
Epithelial   21,618 5408         189         171 (139/      45 (26%)             29 (64%)         80 (67/13)      35 (44%)                     23 (67%)
                                             32)
Fibroblast 21,510 7141           651         267 (156/      27 (10%)             9 (33%)          97 (58/39)      17 (18%)                     7 (41%)
                                             111)
Myeloid      22,507 13,836       2695        900 (827/      56 (6%)              11 (20%)         261 (238/       32 (12%)                     10 (31%)
                                             73)                                                  23)
T cell       21,716 8807         540         288 (195/      42 (15%)             18 (42%)         83 (55/28)      26 (31%)                     15 (58%)
                                             93)
PPC posterior predictive check, PC prostate cancer. “Of which” refers to the gene selection relative to the category adjacent on the left. “Interface” refers to cell-
surface and secreted protein-coding genes. “Curated” refers to the curated database for cellular-interface genes produced in our study (Supplementary file 2).
“Consistent” refers to a consistent direction of transcriptional change according to the curated database. Genes were labelled as “cancer genes” if present in the
tier1 COSMIC databasehttps://paperpile.com/c/BQQ95X/zLPNs [46] or labelled as such in our manually curated cell-type-specific database (Supplementary file 2).
Genes were labelled as “prostate cancer genes” if present in the tier1 COSMIC prostate cancer database datasethttps://paperpile.com/c/BQQ95X/zLPNs [46] or
labelled as such in our manually curated cell-type-specific database (Supplementary file 2)
Mangiola et al. BMC Cancer (2021) 21:846 Page 9 of 18 Fig. 2 Recurrent functional categories identified in differentially transcribed secreted and transmembrane genes. The estimated inflection point for each gene shows the CAPRA-S risk score at which the transcriptional change was fastest; values < 0 or > 7 indicate an early or late change, respectively
Mangiola et al. BMC Cancer (2021) 21:846 Page 10 of 18
direct epithelial-to-mesenchymal transition. The differ- CAPRA-S 6–8) altered in myeloid cells known to
ential transcription events of those three classes do not function as a co-stimulatory loop. A smaller cluster of
appear to be concentrated on any particular stage of dis- genes was linked with T cell recruitment and inflam-
ease progression. mation, including CFP [69], IL24 [70], PROK2 [71],
Similarly, angiogenesis signalling appears to be sus- SELL [72]. Interestingly, epithelial cells upregulate a
tained along the whole disease progression. A cluster of cluster of receptor genes normally involved in antigen
genes linked to platelet recruitment and endothelial cell recognition and presentation in immune cells [73], in-
migration is differentially expressed in synergy by both cluding an MHC class II cell surface receptor (i.e.
myeloid and T cells. Several transcriptional alterations HLA-DRB5) and three Fc receptors (i.e. FCER1G,
from both epithelial and immune cells were linked with FCGR1A and FCGR2A).
hormonal and lipid homeostasis, a key molecular hall- Overall, the significant genes associated with anti-
mark in prostate cancer [47]. Within this set, the most inflammation across the four cell types targets a more
recurring metabolite that is linked with differentially heterogeneous set of cell types than the pro-
transcribed genes is cholesterol. While all four cell types inflammatory ones. Monocyte-derived cells are mainly
contributed similarly for most hallmarks, a clear bias is targeted by genes that are differentially transcribed in
present for cancer cell growth, osteogenesis and hor- epithelial and myeloid cells. These include the receptor
mone modulation, which genes are differentially tran- genes SPNS2 [74, 75], IL10RA [76] and ICAM5 by epi-
scribed in epithelial and immune cells types, thelial cells; and the receptor genes CPM [77] and
respectively. As the most compelling signal, immune PEX13 [78] and the secreted protein genes FN1 [79] and
modulation was selected for further investigation. ANGPT2 [80] by myeloid cells. Another cluster of genes
targets predominantly T cells, including AREG [81, 82],
Immune modulation is associated with cancer grade and CD200 [83], LRCH1 [84], CD47 [85]. Fibroblasts mainly
targets predominantly monocyte-derived cells downregulate pro-inflammatory cell-surface and se-
In order to elucidate the role of the four cell types in the creted protein genes, such as FCGR3A and C1QA/B.
immune response to primary prostate cancer and their
potential interactions, we focused on genes that encode Increased monocyte-derived cell infiltration in tumours is
for cell-surface and secretory proteins involved in im- associated with lowered disease-free survival
mune modulation. In doing so, we again used the fitted In order to test the relevance of recruitment of
inflection point of the sigmoid model to distinguish be- monocyte-derived cells suggested by our integrated tran-
tween early (i.e. low CAPRA-S risk score) and late (i.e. scriptional analysis, we performed a differential tissue
high) transcriptional changes. The balance between pro composition analysis (i.e. a test for difference in cell-type
and anti-inflammatory signalling from the four cell types abundance between conditions) based on an independ-
tracks the risk score covariate (Fig. 3). The number of ent methodology and independent patient cohort. We
differentially abundant gene-transcripts encoding for used a higher-order Bayesian inference model [34] that
pro-inflammatory proteins remains roughly constant integrates deconvolution and downstream regression
through the risk range, with 18 genes for CAPRA-S risk modules in a joint model (that showed superiority com-
score ≤ 2 and 14 for CAPRA-S risk score > 2. On the pared with the serial use of deconvolution and regres-
contrary, the number of altered anti-inflammatory- sion; Fig. S8) on an independent cohort of 134 patients
related genes significantly expands (p-value 0.015; t-test) from the primary prostate cancer.
for more advanced stages of the disease, with 12 genes The Cancer Genome Atlas (TCGA) dataset [7] in-
against 20 for the two risk score categories, respectively. cluded both disease-free survival and CAPRA-S score in-
Overall, a large proportion (14 genes of 27) of the formation. The deconvolution module of this algorithm
inflammatory-related transcriptional alterations across bases its supervised inference of cell-type proportions on
all four cell types is involved in the recruitment of a collection of 250 curated publicly available transcrip-
monocytes and macrophages [48–55] (highlighted in tional profiles (including BLUEPRINT [35], ENCODE
yellow in Fig. 3a). These include CAMKK2 [56], [36], GSE89442 [37] and GSE107011 [38]), encompass-
ORM1 [57] and DCN [58, 59] in epithelial; IL2RB ing 8 broad cell categories and 18 phenotypes. The de-
[60, 61], ICAM4 [62, 63], DCN [58, 59] and MDK convolution model uses those reference deconvolution
[64, 65] in myeloid cells; and CSF1 [48] and PDGFD signatures to estimate the contribution of each cell type
[66] in T cells. In addition, we identified a known to the observed mixed transcriptional signal (i.e. TCGA
fibroblast-macrophage chemotactic interaction includ- tissue RNA sequencing data). This analysis provides tis-
ing the regulation of the cytokines CXCL10 [51], sue composition estimates as well as their association
CXCL14 [50] and the receptor SLAMF1 [52, 53] for with risk score [34]. Overall, we estimated a median of
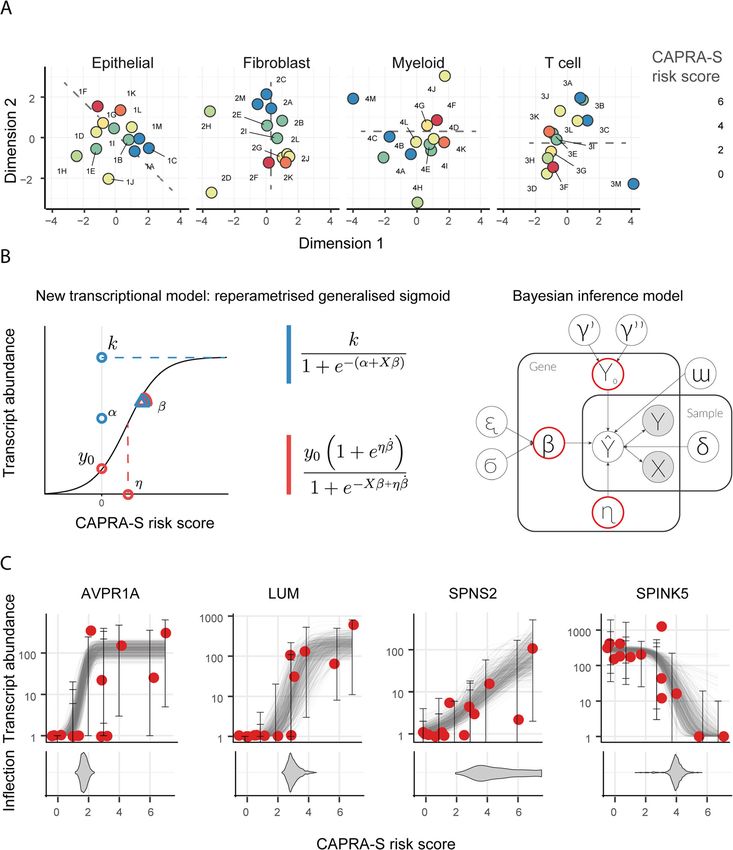
fibroblasts; with COL1A2 [67] and CYR61 [68] (for 88% for epithelial cellular fraction across samplesMangiola et al. BMC Cancer (2021) 21:846 Page 11 of 18 Fig. 3 Multi cell-type immune-modulation changes with risk progression and is mainly targeted at monocyte-derived cells. The landscape of the immune-modulation related genes encoding cellular interface-proteins (i.e. cell-surface or secreted) inferred to be differentially transcribed across CAPRA-S risk scores, grouped by cell type. A Map of the secretory (represented as circles) and cell-surface (represented as squares) protein-coding genes that are differentially transcribed across the four cell types. The data point size is proportional to the baseline transcript abundance. The colour coding represents the effect size. Genes with a similar inflection point (i.e. at what stage of the disease a transcriptional change happens) are clustered vertically (CAPRA-S risk score < =2, > 2 and < =5 and > 5). Genes are split horizontally according to their pro- or anti-inflammatory role. Genes encoding for proteins that target monocyte-derived cells are highlighted in yellow. B Statistics of the differentially transcribed genes displayed in panel (A). Top: credible interval of the association between transcript abundance and CAPRA-S risk score. Middle: inferred effect size (full dots) and baseline transcription (empty dots). Bottom: credible interval of the CAPRA-S value for the transcriptomic change (i.e. inflection point; e.g., the gene HLA − DRB5 is upregulated in late stages of the disease) (consistent with public literature [86], Fig. S5), 4.8% for of the natural killer and granulocyte cells (95% credible endothelial, 4.8% for fibroblasts, and 1.6% for immune interval excluding 0; Fig. 4a). cells. The differential tissue composition analysis showed In order to test whether the enrichment in a significant positive association with the CAPRA-S risk monocyte-derived cells is clinically relevant, we gener- score of the monocyte-derived and a negative association ated Kaplan–Meier curves using the estimated cell-
Mangiola et al. BMC Cancer       (2021) 21:846                                                                                           Page 12 of 18

 Fig. 4 The abundance of monocyte-derived cells relative to total immune cells is positively associated with the CAPRA-S risk score and negatively
 associated with disease-free survival. Association of monocyte-derived cell abundance (see Materials and Methods) with disease-free survival in
 the independent primary prostate cancer TCGA dataset (n = 134). A Polar plot of differential tissue composition of primary prostate cancer TCGA
 samples for which CAPRA-S risk score information is available, with the factor of interest being CAPRA-S risk score. The y-axis (scaled by the fourth
 root) represents the overall cell type abundance; the colour coding reflects the association between cell type abundance and disease-free survival
 (coloured = significant association). B Kaplan–Meier plot of patients (n = 134) with low (blue) or high (red) monocyte-derived cell infiltration in
 the tumour specimen (proportion cut-off = 0.0048; see Materials and Methods section, Survival analyses subsection). C Kaplan–Meier plot for the
 other cell types included in the analysis

type abundances. The stratification of patients based                        the epithelial deconvolution-signature derived from
on the extent of monocyte-derived cells infiltration                         public data.
revealed a significant separation of the survival prob-
abilities (Fig. 4b). For comparative purposes, we tested                     Macrophage proximity to epithelial glandular clusters
patient stratification for the other cell types included                     increases with tumour progression
in the model. As a result, only granulocytes and B                           In order to validate our findings and gather more in-
cells (with the poor outcome cohort including only a                         depth knowledge about the role of macrophages in dis-
few patients) showed a significant negative associ-                          ease progression, we performed a spatial analysis at the
ation. In contrast, no other significant associations                        single-cell level of 63 prostate biopsies from the inde-
were detected for other cell types, including epithelial,                    pendent RadBank cohort of 17 patients with localised
endothelial, fibroblasts, and immune cell types, in-                         prostate cancer, spanning a wide range of CAPRA risk
cluding T cells and natural killers (Fig. 4c). The nega-                     scores (Table S1). Using 7 immuno-fluorescent dyes (in-
tive association for the epithelial component might be                       cluding DAPI) with 6 others linked to antibodies (CD3,
due to the absence of the mesenchymal component in                           CD20, CD68, CD11c and HMWCK), cell size and shape,
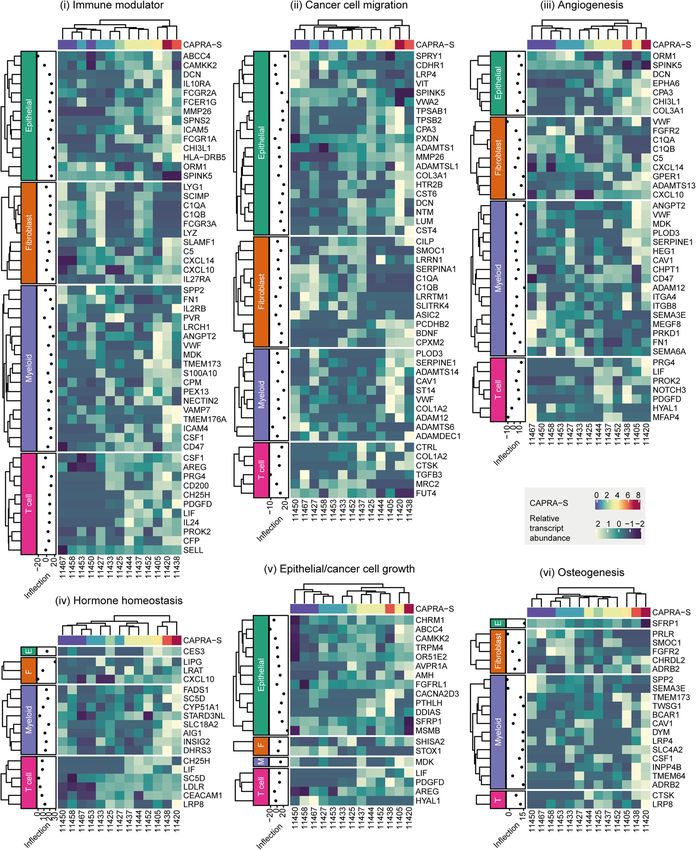
Mangiola et al. BMC Cancer      (2021) 21:846                                                                                        Page 13 of 18

we were able to identify 6 major cell types: T cells, B                    (p-value 0.0325; Fig. 5a-top-right), while the strongest
cells, macrophages, dendritic myeloid, epithelial basal                    negative association was for stromal cells in tumour
and stromal cells. Epithelial basal cells define prostate                  areas (p-value 0.0324; Fig. 5a-bottom). Overall, the aver-
glands, where cancer cells originate and co-localise (con-                 age proximity between macrophages and other cells, ag-
firmed by pathological evaluation). PDL1 expressing cells                  gregated by biopsy, did not strongly associate with the
were also categorised using a PDL1-linked dye. Overall,                    CAPRA risk score. In order to gather evidence that the
we sampled an average of 41 × 103 cells per biopsy                         increased proximity of macrophages to the prostatic
(standard deviation 2.7 × 10⁴). The most abundant of                       gland structures in advanced cancer stages had some
the categorised cell types was epithelial basal (8.06% on                  direct effect on the local immune microenvironment, we
average), followed by T cells (5.03% on average).                          tested the hypothesis that macrophages in proximity to
   We estimated the association between macrophage                         gland structures would displace T cells. We observed an
proximity to five other cell types and CAPRA risk score                    inverse association between the number of neighbour
(Fig. 5a). Across the five cell types, the average number                  macrophage expressing PDL1 to epithelial basal cells
of neighbour cells to macrophages ranges from 1.4 to                       and the number of T-cell neighbours (Fig. 5b). Epithelial
23.0. The strongest positive association was between                       basal cells that are close to clusters of PDL1 expressing
macrophage and epithelial basal cells in tumour areas                      macrophages tend to be further away from T cells.

 Fig. 5 The analysis of multiplex-immunohistochemistry (n = 17) reveals proximity patterns of macrophages along disease progression. A
 Association between macrophage proximity and CAPRA risk score for five cell types identified from the multiplex immunohistochemistry.
 Proximity is calculated as the number of neighbour cells per tissue area and summarised using the median for each tumour biopsy. (left)
 Association between macrophages and epithelial basal cells (top) or stromal cells (bottom) and CAPRA risk score shown in panel (A). Only the 12
 patients with both tumour and surrounding benign tissue are displayed (right). B Decreased proximity of T cells with epithelial basal in the
 presence of PDL1 expressing macrophages. The bottom section shows the multiplex immunohistochemistry tissue from patient RB010, with two
 examples of the presence (left) or absence (right) of PDL1 macrophages close to prostate glandulae. White circles surround the labelled T cells,
 blue and red circles surround macrophages which are PDL1 low and high, respectively
Mangiola et al. BMC Cancer   (2021) 21:846                                                                  Page 14 of 18

Discussion                                                   monocyte-derived cell recruitment and modulation. The
To date, in-depth analyses of genomic features of pros-      association of monocyte-derived cell recruitment with
tate cancer alone, including single nucleotide variants      increased risk score was reflected in an orthogonal dif-
and small and large structural rearrangements, have not      ferential tissue composition analysis on the extensive
been sufficient to provide transformative prognostic         Cancer Genome Atlas (TCGA) independent patient co-
tools or unveil the full complexity of this disease. Non-    hort against CAPRA-S risk score through a differential
malignant cells within the tumour microenvironment           tissue composition analysis. This analysis was enabled by
make an integral contribution to the mechanisms that         a robust Bayesian inference model, able to transfer the
cause cancer progression. They are often modulated by        uncertainty of the estimation of tissue composition for
cancer cells toward pro-tumorigenic behaviours. In this      each sample to the linear model linking cell-type propor-
study, we significantly improved the knowledge of the        tion (across samples) to clinical variables. This aspect is
molecular landscape of the primary prostate tumour           particularly relevant considering the substantial noise as-
microenvironment, revealing concurrent transcriptional       sociated with the inference of tissue composition (i.e. de-
changes in epithelial, fibroblast, myeloid and T cells       convolution). To test the clinical significance of
along the CAPRA-S risk score range.                          quantifying monocyte-derived cell numbers within the
  We optimised a combined fluorescence-activated             tumour mass besides the CAPRA-S risk score, we pro-
cell sorting and ultra-low-input RNA sequencing              duced Kaplan-Meier estimates using the inferred cell-
protocol, allowing us to obtain high-quality sequen-         type proportions along progression-free survival on the
cing data from inputs down to 1000 cells. Such a             TCGA cohort. For both analyses, we identified the
strategy is of general utility as it enables studies of      strongest association with clinical variables being
rare cell types from both fresh tissue cores and biop-       monocyte-derived cells. The infiltration of cell types
sies. In order to optimally detect changes in transcrip-     such as monocyte-derived cell populations has previ-
tion along the CAPRA-S risk score, we developed a            ously been shown to be linked to the extent of prolifera-
novel statistical inference method, TABI. This model         tive inflammatory atrophy lesions, chronic prostatic
permitted modelling transcript abundance natively on         inflammation and cancer gradehttps://paperpile.com/c/
continuous factors of interest with a minimal number         BQQ95X/GLf0R [88]. In prostate cancer, specific and
of parameters (n = 4), avoiding loss of information          overall survival analyses have identified an elevated
due to the dichotomisation of the risk score into low        monocyte count as an independent prognostic factor for
−/high-risk patient groups. As suggested by                  poor outcomehttps://paperpile.com/c/BQQ95X/vyBlX+
multidimensional-scaling plots and supported by our          pxdwu+xaA8T+2mcuI [89–92]. Furthermore, the infil-
inference, transcriptional change events are indeed          tration of tumour-associated macrophages in prostate
continuously distributed along the whole risk score          needle biopsy specimens has been shown to have poten-
range. This method is of broad utility in all cases          tial as a predictive factor for PSA failure or disease pro-
where a continuous (or pseudo-continuous) factor of          gression after hormonal therapyhttps://paperpile.com/c/
interest is present (e.g., risk score, time and chemical     BQQ95X/eaIrr [93].
concentration) and a monotonic change in transcript             In order to validate further our hypothesis and enrich
abundance is of interest. Furthermore, the novel par-        our knowledge about the relation of macrophages with
ametrisation of the generalised sigmoid function that        epithelial and a range of immune cells along disease pro-
TABI is based on can be extrapolated for a wide              gression, we used multiplex immune-histochemistry to
range of applications. On the contrary, publicly avail-      determine the immune context at the single-cell level in
able statistical models for continuous regression of         an independent cohort. This data supports the hypoth-
transcript abundance, such as for temporal RNA dy-           esis of a weakened relation of macrophages with stromal
namics [87], cannot be used in the context of risk           compartments and a strengthened association with epi-
score. This is because they require a large biological       thelial glandular clusters along the disease progression
replication, specific experimental design and are not        spectrum; glandular clusters being generally colocalised
constrained to monotonic trends, affecting practical         with cancer cells in tumour tissues. This aspect becomes
interpretability.                                            highly relevant as the glandular areas in both tumour
  The compilation of a curated cell-type-specific data-      and adjacent benign compartments rich in PDL1 macro-
base of gene functions for cell-surface and secreted         phages are poorer in T cells. PDL1 expressing macro-
protein-coding transcripts enabled the detection of sev-     phages have been associated with their M2 wound-
eral recurrent hallmarks of prostate cancer, characterised   healing phenotypehttps://paperpile.com/c/BQQ95X/
by the involvement of multiple cell types. The most          VvaW8 [94]. The relationship between PD-L1 expression
striking aspect to emerge was the large number of            in intratumoral macrophages and prognosis in cancer
differentially abundant gene-transcripts linked to           patients is still controversial. The two competing
Mangiola et al. BMC Cancer          (2021) 21:846                                                                                               Page 15 of 18

hypotheses are (i) PDL1 intratumoral macrophages lead                           Additional file 5.
to dysfunctional T cellshttps://paperpile.com/c/BQQ95
X/2mglb [95] or (ii) not having significant effectshttps://                    Acknowledgements
paperpile.com/c/BQQ95X/BJESQ [96].                                             We wish to thank Dr. Stephen Wilcox for his technical assistance. We are
  Nonetheless, the expression of PDL1 in macrophages                           grateful to the staff of the Flow cytometry facility and Clinical Translational
                                                                               Centre (Walter and Eliza Hall Institute of Medical Research). We thank
has been shown to induce anti-inflammatory cytokines                           Professor Risbridger (Monash University) for the tremendous support with
such as IL-10https://paperpile.com/c/BQQ95X/VvaW8                              the initial phase of the study. We thank Dr. Damiano Spina (RMIT) for
[94]. Although PDL1 in macrophages may primarily                               introducing us to the Stan language. We thank Dr. Bob Carpenter and Prof.
                                                                               Andrew Gelman (Columbia University) for an incredible mentorship in
function as protection against induced cell death, our                         Bayesian inference and all the Stan community at discourse.mc-stan.org for
study supports the hypothesis that it may have the effect                      technical support. Most importantly, we thank all the patients who
of inducing an anti-inflammatory, immune cold local                            participated in the study. We thank the anonymous reviewers whose
                                                                               comments have greatly improved this manuscript.
microenvironment, with adverse effects on disease pro-
gression. Although the role of several immune cell types                       Authors’ contributions
has been widely investigated in prostate cancer, the driv-                     SM1 conceived and designed the study, performed part of the cellular
                                                                               biology procedures, implemented the statistical methods and performed
ing forces of immune modulation, clinically relevant for                       data analysis and visualisation under the supervision of AJC, NH, NMC, ATP,
immunotherapy resilience, are still under investigation.                       SM2 and CMH. MK, JP, SGW, KC and PD contributed to sample harvesting.
From the myeloid compartment, the main focus has                               PM, SM1, FSFG, DB, NL, CN, MLP and SIM contributed to the cellular biology
                                                                               procedures, and PM and BP contributed to the molecular procedures. MM
been myeloid-derived suppressor cellshttps://paperpile.                        contributed to statistical model implementation. SPK led the multiplex
com/c/BQQ95X/i6jgh [15], that have been investigated                           histochemistry experiments supervised by PJN and SGW. All authors
mainly through blood and in-vitro analyses [97, 98].                           contributed to manuscript writing. The authors read and approved the final
                                                                               manuscript.

Conclusion                                                                     Funding
                                                                               SM was supported by the David Mayor PhD Scholarship from the Prostate
There has been limited benefit observed in prostate can-
                                                                               Cancer Research Foundation. SM and ATP were supported by the Lorenzo
cer through the unselected use of novel immune check-                          and Pamela Galli Charitable Trust. ATP was supported by an Australian
point inhibitors based on T cell receptor blockade (e.g.,                      National Health and Medical Research Council (NHMRC) Program Grant
                                                                               (1054618) and NHMRC Senior Research Fellowship (1116955). ATP, CH and
PD-1, PD-L1 and CTLA-4) https://paperpile.com/c/
                                                                               NC were supported by Movember. KC was supported by a Postgraduate
BQQ95X/i6jgh [15]. Such failure may, in part, be driven                        Medical Research Scholarship from the Prostate Cancer Research Fund and
by our limited understanding of the dynamic interplay                          the Australian Government Research Training Program Scholarship provided
                                                                               by the Australian Commonwealth Government and the University of
between immune components of the microenvironment
                                                                               Melbourne. NDH was a recipient of a Melanoma Research Grant from the
and tumour cells. This study provides a clear direction                        Harry J Lloyd Charitable Trust. FSFG was supported by grant #1158085,
for further investigation into mechanisms of the immune                        awarded through the Priority-driven Collaborative Cancer Research Scheme
                                                                               and funded by Cure Cancer Australia with the assistance of Cancer Australia.
system, monocyte-derived cells in particular, that con-
                                                                               MM was supported by the ELIXIR CZ research infrastructure project (MEYS
tribute to disease progression; for example, through                           Grant No: LM2015047), including access to computing and storage facilities.
changing the hormonal and growth-factor homeostasis                            NMC was supported by a David Bickart Clinician Research Fellowship from
                                                                               the Faculty of Medicine, Dentistry and Health Sciences at the University of
through a sustained inflammatory state. Furthermore,
                                                                               Melbourne and the Movember Distinguished Gentleman’s Ride Clinician Sci-
this study provides a novel and robust method for de-                          entist Award through the Prostate Cancer Foundation of Australia’s Research
tecting monotonic changes in transcript abundance over                         Programme. The research benefitted from support from the Victorian State
                                                                               Government Operational Infrastructure Support and Australian Government
a continuous factor of interest such as risk and time that
                                                                               NHMRC Independent Research Institute Infrastructure Support. The funding
has broad applicability to other research areas. The                           body has no role in the design of the study and collection, analysis, and in-
methodological advances and the novel findings pre-                            terpretation of data nor in writing the manuscript.
sented in this study provide a research framework for
                                                                               Availability of data and materials
improved immune interventions.                                                 The code used to conduct the analyses is available at github.com/
                                                                               stemangiola under the following repositories: prostate-TME-N52–2019;
Abbreviations                                                                  TABI@v0.1.3; ARMET@v0.7.1. Sequence data was deposited at the European
TCGA: The Cancer Genome Atlas; PBS: Phosphate-buffered saline                  Genome-phenome Archive (EGA), hosted by the EBI and the CRG, under ac-
                                                                               cession number EGAD00001004948.

Supplementary Information                                                      Declarations
The online version contains supplementary material available at https://doi.
org/10.1186/s12885-021-08529-6.                                                Ethics approval and consent to participate
                                                                               The collection and use of tissue for this study had Melbourne Health
                                                                               institutional review board approval. Patients provided written informed
 Additional file 1.
                                                                               consent (Melbourne Health Local Project Number: 2016.087; and PMCC;
 Additional file 2.                                                            HREC approvals 10/68, 13/167, 18/204).
 Additional file 3.
 Additional file 4.                                                            Consent for publication
                                                                               Not applicable.
You can also read