UNMASC: tumor-only variant calling with unmatched normal controls
←
→
Page content transcription
If your browser does not render page correctly, please read the page content below
Published online 6 October 2021                                                                              NAR Cancer, 2021, Vol. 3, No. 4 1
                                                                                                          https://doi.org/10.1093/narcan/zcab040

UNMASC: tumor-only variant calling with unmatched
normal controls
Paul Little 1,3,* , Heejoon Jo2 , Alan Hoyle3 , Angela Mazul5 , Xiaobei Zhao2,3 ,
Ashley H. Salazar3 , Douglas Farquhar3,6 , Siddharth Sheth3,7 , Maheer Masood8 ,
Michele C. Hayward3 , Joel S. Parker3,4 , Katherine A. Hoadley3,4 , Jose Zevallos5 and
D. Neil Hayes2,3,9,*

                                                                                                                                                              Downloaded from https://academic.oup.com/narcancer/article/3/4/zcab040/6382329 by guest on 02 November 2021
1
  Public Health Sciences, Fred Hutchinson Cancer Research Center, 1100 Fairview Ave N, Seattle, WA 98109, USA,
2
  Center for Cancer Research, University of Tennessee Health Science Center, 19 South Manassas, Memphis, TN
38163, USA, 3 Lineberger Comprehensive Cancer Center, University of North Carolina at Chapel Hill, 101 Manning
Drive Chapel Hill, NC 27514, USA, 4 Genetics, University of North Carolina at Chapel Hill School of Medicine, 101
Manning Drive Chapel Hill, NC 27514, USA, 5 Otolaryngology Head and Neck Surgery, Washington University School
of Medicine, 660 South Euclid Avenue, Campus Box 8115, St. Louis, MO 63110, USA, 6 Otolaryngology, University of
North Carolina at Chapel Hill School of Medicine, 101 Manning Drive Chapel Hill, NC 27514, USA, 7 Oncology,
University of North Carolina at Chapel Hill School of Medicine, 101 Manning Drive Chapel Hill, NC 27514, USA,
8
  Otolaryngology, University of Kansas Medical Center, 3901 Rainbow Blvd, Kansas City, KS 66160, USA and
9
  Internal Medicine, Division of Hematology-Oncology, University of Tennessee Health Science Center, 19 South
Manassas, Memphis, TN 38103, USA

Received March 08, 2021; Revised September 07, 2021; Editorial Decision September 08, 2021; Accepted October 04, 2021

ABSTRACT                                                                        matched normals. With our benchmarked samples,
                                                                                approximately ten normal controls were needed to
Despite years of progress, mutation detection in can-
                                                                                maintain 94% sensitivity, 99% specificity and 76%
cer samples continues to require significant man-
                                                                                positive predictive value, far outperforming compa-
ual review as a final step. Expert review is partic-
                                                                                rable methods. Our approach, called UNMASC, also
ularly challenging in cases where tumors are se-
                                                                                serves as a supplement to traditional tumor with
quenced without matched normal control DNA. At-
                                                                                matched normal variant calling workflows and can
tempts have been made to call somatic point muta-
                                                                                potentially extend to other concerns arising from an-
tions without a matched normal sample by removing
                                                                                alyzing next generation sequencing data.
well-known germline variants, utilizing unmatched
normal controls, and constructing decision rules to
classify sequencing errors and private germline vari-                           INTRODUCTION
ants. With budgetary constraints related to compu-                              Although variant detection and mutation calling within
tational and sequencing costs, finding the appropri-                            next-generation sequencing (NGS) data have been the
ate number of controls is a crucial step to identi-                             source of much investigation, gaps and shortcomings re-
fying somatic variants. Our approach utilizes pub-                              main. Most methodological development has been in the
lic databases for canonical somatic variants as well                            areas of detection of population variants or somatic muta-
as germline variants and leverages information gath-                            tions in the setting of matched tumor-normal (MTN) sam-
ered about nearby positions in the normal controls.                             ples. Importantly, neither of these two approaches represent
                                                                                the most common clinical application in which clinicians at-
Drawing from our cohort of targeted capture panel
                                                                                tempt to characterize disease variants, often from an abnor-
sequencing of tumor and normal samples with vary-                               mal cancer genome without a matched reference sample.
ing tumortypes and demographics, these served as a                                 While common germline variants (GVs) can be identi-
benchmark for our tumor-only variant calling pipeline                           fied with germline databases (GDs) such as dbSNP (1), 1000
to observe the relationship between our ability to                              Genomes (2) and ExAC (3), rare GVs require more sophis-
correctly classify variants against a number of un-                             ticated methods to identify. The fundamental approach in-

* To
   whom correspondence should be addressed. Tel: +1 901 448 3191; Fax: +1 901 448 1784; Email: neil.hayes@uthsc.edu
Correspondence may also be addressed to Paul Little. Email: plittle@fredhutch.org


C The Author(s) 2021. Published by Oxford University Press on behalf of NAR Cancer.
This is an Open Access article distributed under the terms of the Creative Commons Attribution License (http://creativecommons.org/licenses/by/4.0/), which
permits unrestricted reuse, distribution, and reproduction in any medium, provided the original work is properly cited.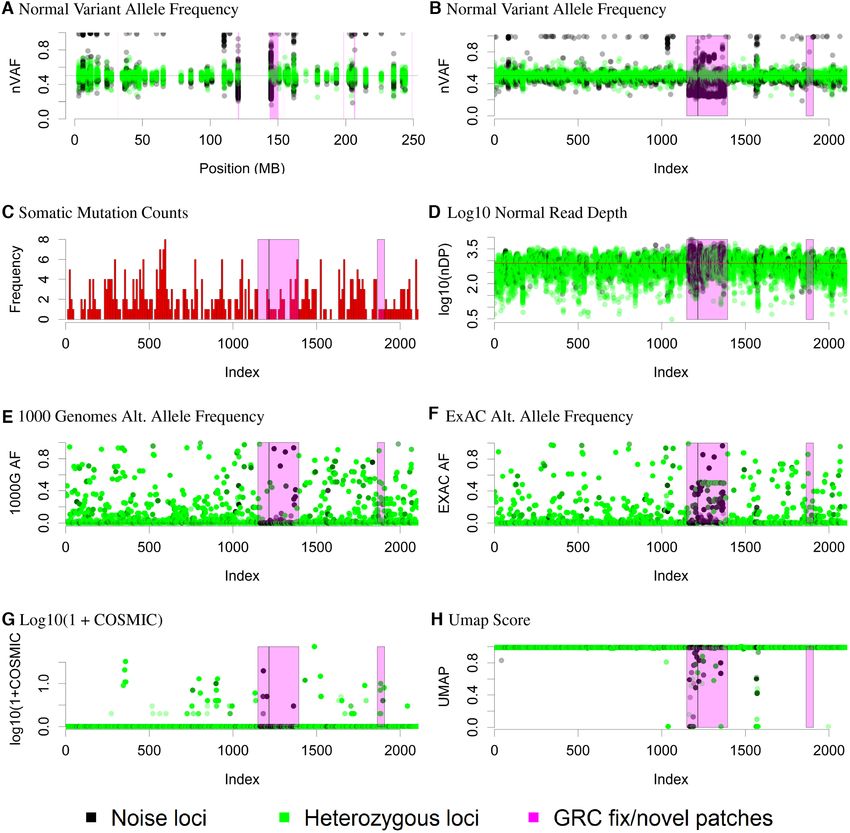
2 NAR Cancer, 2021, Vol. 3, No. 4

volves identifying genomic intervals of GV calls at similar B    UNMASC overview
allele frequencies (BAF) and then inferring the germline sta-
                                                                 UNMASC improves on concepts proposed by Hiltemann
tus of a variant, using their variant allele frequency (VAF),
                                                                 et al. (18), MuTect (19) and LumosVar (6) in which pools
through some notion of ‘distance’ or posterior probability.
                                                                 of unmatched normals (UMNs) improve or replace a MN
A subset of existing methods (4–6) follow this basic proce-
                                                                 for the purpose of variant detection. We document the role
dure to identify subject-specific or rare GVs. One unavoid-
                                                                 of pooled normal in quantification of a variety of sequenc-
able limitation of all methods is distinguishing GVs from
                                                                 ing and alignment AVs and apply a series of locus and
somatic for highly purified samples or cell lines since the
                                                                 sample-specific filters and annotations. A major drawback
BAF and VAF are likely to overlap for variants that initiate
                                                                 of current variant filtering methods (4–6,18,20–24) is the
oncogenesis (founder mutations) and present on all copies
                                                                 pre-filtering of variants that can provide crucial genomic
of a haplotype (within cancer cells, thus appearing germline
                                                                 context for understanding the remaining prioritized vari-
for a purified sample). LumosVar (6) demonstrated this lim-

                                                                                                                                  Downloaded from https://academic.oup.com/narcancer/article/3/4/zcab040/6382329 by guest on 02 November 2021
                                                                 ants. With this in mind, UNMASC purposely utilizes the
itation through simulation.
                                                                 nature of subsets of variants that reveal local or genome-
   In this setting, the vast majority of patients do not sub-
                                                                 wide germline and multiple forms of AV clusters. Most steps
mit material for MTN sequencing, and published methods
                                                                 of UNMASC’s variant annotation involves applying a cri-
in this area are generally lacking. In this report we describe
                                                                 teria to subset variants, summarizing the subsetted vari-
a workflow and software, Unmatched Normals and Mu-
                                                                 ants by proposed parametric distributions and then quan-
tant Allele Status Characterization (UNMASC) that ap-
                                                                 tifying the relationship between each variant and the over-
plies and adapts a series of best-practices techniques for the
                                                                 all distribution of subsetted variants. To further strengthen
purpose of highly sensitive, specific, and precise variant de-
                                                                 our approach and provide novelty, utilizing UMNs provides
tection.
                                                                 fundamental locus-specific and regional genomic context in
   In its simplest form, somatic mutation detection is sim-
                                                                 terms of variant calling with respect to the reference genome
ilar to genotyping, or the detection of non-reference bases
                                                                 and bioinformatic workflow. These steps provide the user
within NGS data. Unlike genotyping, mutation calling gen-
                                                                 with data-driven annotations.
erally considers as uninformative (i.e. not disease-causing)
                                                                    UNMASC integrates public database annotations, se-
the vast majority of variants that are present in the germline
                                                                 quencing metrics and data-driven annotations to retain
of the individual. Improved classification of variants as
                                                                 variants meeting variant quality score, germline population
germline versus somatic in diseased tissue without matched
                                                                 allele frequency, read depth, strand bias P-value, predicted
normal (MN) samples, while at the same time excluding
                                                                 AV frequencies, Cosmic count, variant prediction and non-
other variants as likely sequencing errors or alignment er-
                                                                 germline posterior probability thresholds. Details associ-
rors is an area of unmet need. GVs can be identified by sev-
                                                                 ated with UNMASC’s filtering criteria are presented in Sup-
eral methods including the use of a MN control, GDs, or
                                                                 plemental Materials Section S4.9. Depending on the user’s
inferred by the sequencing process or through modeling. In
                                                                 intentions, strict or liberal variant filtering can be applied
the current manuscript, we will consider the strengths and
                                                                 for which we offer empiric guidance based on a large bench-
weaknesses of each of these approaches while considering
                                                                 marking cohort.
other sources of artifactual variants in NGS data.
   Classification is the main objective of tumor-only (TO)
variant calling. Models designed to perform classification       MATERIALS AND METHODS
require a sufficient sample size (pooling both samples and
                                                                 Data background
variants) and reliable labels (e.g. somatic, germline, other).
The presence of artificial variants (AVs) in general can hin-    For the purpose of assessing our ability to detect and char-
der classification performance. Studies have demonstrated        acterize somatic variants in cancer, we assembled a cohort
that AVs arise from various steps in a sample’s process-         of patients with clinically validated mutations from a clin-
ing (7–15). Therefore at the very least, when constructing a     ical trial of next-generation sequencing in cancer using a
training dataset for variant classification, the labels should   target panel called UNCseq™ (LCCC1108: NCT01457196).
include germline, somatic and various classes of AVs. With-      From a total cohort of 1500+ patients, we selected a rep-
out accounting for AVs, methods that train models to clas-       resentative subset at random of 100 patients with a spec-
sify variants as only germline or somatic will be at a disad-    trum of clinical and genomic parameters relevant to a ro-
vantage. In addition, constructing a training dataset com-       bust method. All patients had paired tumor and normal
posed of MTN variant calls assumes that all underlying           samples to benchmark as well as clinical confirmation of
somatic variants (SVs) were captured and that each tu-           relevant clinically actionable mutations (25,26).
mor’s MN served as a reliable control. AVs, such as oxoG            To assess the performance of our pipeline in the setting
(10), strand bias (9), and paraffin-induced (15–17), present     of UMNs, a set of 20 UMN samples independent of the tu-
among MTN variants led us to avoid comparisons with su-          mor set was selected from the larger UNCseq™ cohort. The
pervised methods that trained models on only germline or         determination that 20 samples would be sufficient was em-
somatic variant classifications. Also, existing unsupervised     piric but ultimately proved to be a greater number than was
methods that perform tumor copy number segmentation              necessary for our purposes. A summary of tumor and nor-
based only on variants reported in GDs run the risk of being     mal benchmark sample demographics is provided in Table
negatively impacted by clusters of AVs presenting in GDs.        1.
This can be seen with low VAF calls in GDs that do not              Benchmark tumor samples consisted of brain/central
present in the underlying MN.                                    nervous system, breast, gastrointestinal, genitourinary, gy-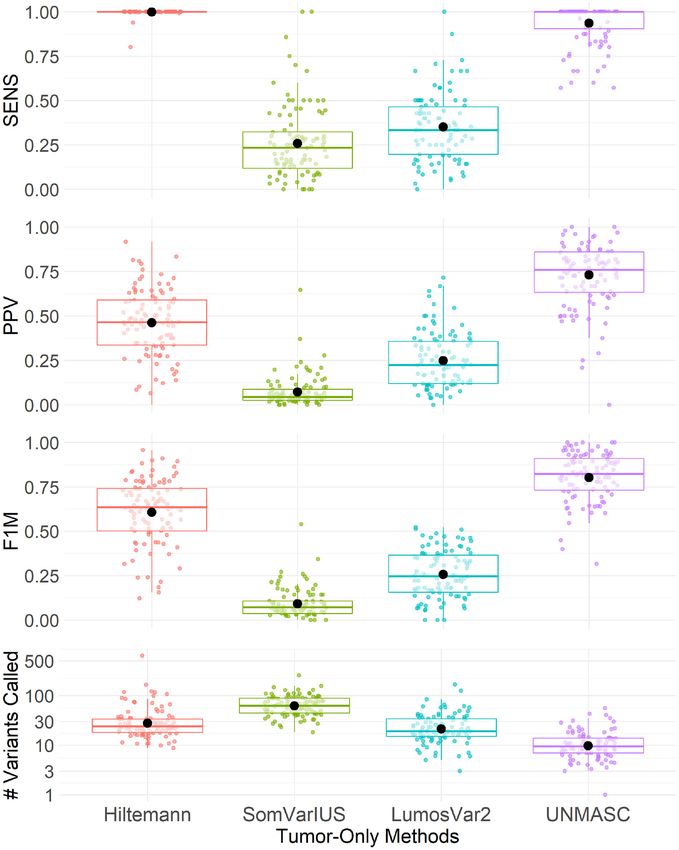
NAR Cancer, 2021, Vol. 3, No. 4 3

Table 1. Summary demographics of the 100 tumor and 20 LCCC1108            Table 2. The cross tabulation of counts between variables defined by ge-
UMNs. Sequencing metrics include median and range statistics on per-      nomic annotations and the outcome are presented
cent bases with ≥100× coverage, average number of reads covering target
                                                                                                          Univariate             Multivariate
regions and pathologist-derived tumor percent
                                                                          Variable Label                 OR 95% CI (P)          OR 95% CI (P)
Variable                               Normal                   Tumor
                                                                                     Het.    Noise
                                         N(%)                    N(%)
                                                                          Umap                        0.68–0.85 (1.85e-06)    0.69–0.87 (1.33e-05)
Gender                                                                     NO        1034    10840
   Female                            16(80.0%)               75(75.0%)     YES        539    4320
   Male                               4(20.0%)               25(25.0%)    GRC                         3.22–4.11 (8.60e-107)   3.04–3.90 (1.21e-84)
Race                                                                       NO        11377     497
   Black                              6(30.0%)               16(16.0%)     YES       4193      666
   Other                               1(5.0%)                 7(7.0%)    GS                          1.43–1.82 (2.46e-15)    1.17–1.51 (9.18e-06)

                                                                                                                                                       Downloaded from https://academic.oup.com/narcancer/article/3/4/zcab040/6382329 by guest on 02 November 2021
   White                             13(65.0%)               77(77.0%)     NO        11115     759
Age at diagnosis                                                           YES       4376      483
   20 to 52                           4(20.0%)               36(36.0%)    SV                          3.87–4.92 (5.53e-148) 3.65–4.66 (5.62e-115)
   53 to 62                           7(35.0%)               33(33.0%)     NO        11388     486
   63 to 82                           9(45.0%)               31(31.0%)     YES       4096      763
# Confirmed mutations
   1                                  6(30.0%)               36(36.0%)    Umap = base uniqueness score is ≥0.99. GRC = base is contained within
   2                                  8(40.0%)               26(26.0%)    a fix/novel patch. GS = base is present in a GDs (ExAC or 1000 Genomes)
   3                                  3(15.0%)               20(20.0%)    and COSMIC database. SV = a somatic variant was called within 10 bases
   4+                                 3(15.0%)               18(18.0%)    of the base considered. Univariate and multivariate analyses are presented
                                                                          in terms of odds ratios (OR), 95% confidence intervals (95% CI), and P-
                                Median(range)           Median(range)     values (P).
Target bases with              97.6 (71.7–98.6)        97.5 (76.9–99.2)
100× (%)
Mean target coverage       818.9 (155.8–1190.2)    831.6 (175.7–2048.1)      As expected, the bulk of all remaining positions centered
Percent tumor*                       65 (30–90)              70 (20-90)   around nVAF of 0.5. Clustering then provided an objective
* Percent
                                                                          means of assigning a variant to the heterozygous state plus
         tumor in benchmark tumor samples and corresponding tumor         or minus measurement error versus the alternative (neither
samples for UMNs.
                                                                          0, 0.5 or 1) (Figure 1). Samples in the alternative state were
                                                                          considered as non-Mendelian or simply ‘noise’. Difficult to
necologic, head and neck, hematologic, lung, lymphoma                     genotype regions have been characterized previously by ef-
and musculo-skeletal tumor types for the UNCseq™ cohort.                  forts such as Umap (8) (Figure 1) and often noted in re-
                                                                          gions of lower genome complexity such as near centromeres.
                                                                          The challenge posed by these regions might initially ap-
                                                                          pear trivial since the genomic territory involved covers a
Position filtering
                                                                          small fraction of the genome. However, the scale becomes
While our work is aimed at somatic mutations in tumors,                   more daunting when the results are indexed by variant order
we wanted to begin by observing how alternate and refer-                  rather than position (Figure 1B), demonstrating that these
ence bases present in normal samples. All samples were pro-               narrow regions generate large numbers of variants. Closer
cessed with a hybrid capture method however this analysis                 examination reveals that in genomic intervals of unexpected
can be applied to whole genome and whole exome sequenc-                   nVAF deviations (such as the chr1 centromere), only exclud-
ing too. Since one of the most useful characteristics of vari-            ing loci with decreases in Umap score was too conserva-
ants is their allele frequency (AF), we looked at AFs in the              tive. Several loci classified as Mendelian corresponded to
normal samples without regard to tumor, focusing on posi-                 decreases in Umap and other loci with Umap scores near
tions that were not called homozygous. The hypothesis was                 1.0 were classified as non-Mendelian suggesting that Umap
that at least some non-reference variants in MN from tumor                alone is insufficient for identification of these challenging
samples would demonstrate AFs other than a Mendelian                      genome positions.
distribution of 50% or 100%. Such positions would be prob-                   We then considered if these non-Mendelian germline po-
lematic since they could be falsely interpreted as somatic al-            sitions were associated with somatic mutation calls in can-
terations in regions of copy number gains or losses when                  cer databases. Such variants would likely be false positives
detected in tumor cases. We further interrogated the vari-                since they violate the assumptions of many variant detec-
ant position in association with existing public database an-             tion algorithms. We confirmed that many variants were re-
notations. For the 100 tumors, Isaac (27) was run on each                 ported in these challenging regions (Figure 1C). We fur-
of their corresponding normal BAM files to generate nor-                  ther excluded sequencing depth as a meaningful contribu-
mal genome VCFs. For each sample, loci located within tar-                tion to variant allele imbalance (Figure 1D). Given that we
geted gene panel capture regions were retained and vari-                  were unaware of existing methods to consider allele imbal-
ants were clustered based on VAF (Supplementary Mate-                     ance in this manner, we interrogated the AFs in our sam-
rials Section S4.2). Loci with nVAF classified near to zero               ple set of variants previously reported in public datasets in-
(primarily sequencing errors) and one (homozygous) were                   cluding 1000 Genomes (2), ExAC (3) and COSMIC (28).
excluded based on clustering assignment. Remaining loci                   Importantly, for normal sample non-Mendelian variants in
from the 100 normal samples were pooled together for vi-                  the UNCseq™ cohort and also reported in 1000 Genomes,
sualization in Figure 1 and hypothesis testing in Table 2.                these loci had low population AF suggesting underlying
4 NAR Cancer, 2021, Vol. 3, No. 4
Downloaded from https://academic.oup.com/narcancer/article/3/4/zcab040/6382329 by guest on 02 November 2021
Figure 1. Chromosome 1 visualization. Normal sample loci classified as either noise or heterozygous. Figures (A) and (B) plot the normal nVAF on the y-
axes. While the x-axis denotes the genomic position in megabases for Figure (A), the x-axes for Figures (B–H) denote the ordered genomic loci of positions.
Figure (C) illustrates the distribution of loci where somatic variants were called. In Figure (D), the y-axis denotes the log10 of total read depth of clustered
normal read counts with the line indicating the median. In Figures (E–H), the y-axes denote the 1000 Genomes population allele frequencies (AF), ExAC
population AF, log10 of 1 + COSMIC counts, and Umap scores, respectively.
AVs rather than rare population variants (Figure 1E). Vari- and all samples, we modeled the probability that a locus was
ants overlapping with ExAC were more likely to have ExAC ever classified as non-Mendelian as a function of being lo-
AFs of 0.5 but still with many ExAC AFs divergent from cated within a GRC patch, Umap score ≥ 0.99, presenting
0.5 (Figure 1F). Finally we observed that many of these in both germline and somatic databases, and finally if a so-
difficult positions were present in the COSMIC database matic variant was called within 10 bases of the locus (Table
as somatic variants, concerning for false positives. We also 2). Our analyses revealed strong associations between each
overlay genomic interval novel/fix patch information with of the four covariates and non-Mendelian status, suggesting
version GRCh37.p13 provided by the Genome Reference our initial classification procedure aligned with existing ge-
Consortium (GRC) (12) as a possible cause of the non- nomic annotations. While direct interpretation of such po-
Mendelian AF distributions. In order to formally quantify sitions might be complex, this locus classification provides
the patterns seen in Figure 1 across all genome positions the user additional insight into a variant that might other-NAR Cancer, 2021, Vol. 3, No. 4 5
wise be considered clinically meaningful when it is anno- show that UNMASC is able to identify H2M regions within
tated as non-Mendelian among normal controls. In other HLA-A, HLA-B, CYP2D6 and others without resorting to
words, variants called in this position have higher proba- exclude all variants along each gene (Supplementary Table
bility of being false positives. We then considered the mul- S3).
tivariate model. For model predictiveness, the AUC of the
multivariate model is 0.610 with a McFadden R-squared of RESULTS
0.051. These results suggested that existing variant annota-
tion such as Umap for challenging regions alone was highly Benchmark variant samples and somatic mutations
statistically associated with non-Mendelian status but fails Samples were sequenced using hybrid capture technology
to account for most false positive variant calls. The limited and Illumina paired-end sequencing technology on the
prediction can be attributed to how the outcome variable HiSeq2000/2500 and NextSeq500 machines as has been re-
was naively characterized. For example, within a given GRC
Downloaded from https://academic.oup.com/narcancer/article/3/4/zcab040/6382329 by guest on 02 November 2021
ported elsewhere (25). For the purposes of developing a gold
patch, there was a mixture of variants near normal VAF of standard set of variants, we compared those variants ob-
0.5 as well as variants deviating from 0.5. Our analyses sug- tained when a matched tumor normal pipeline was utilized
gested GRC patches were more associated with increased versus the results obtained when the same samples where
deviations but would have difficulty inferring the status of assessed compared to a tumor-only pipeline utilizing non-
variants as likely true versus likely false within a GRC patch. matched reference controls. Briefly, variants were called and
The other three covariates appeared informative of nVAF combined using Strelka (29), UNCeqR (30) and Cadabra
deviations from 0.5 in a subset of regions but did not capture (31) and annotated with Oncotator (32). As documented
overall regions of deviation. Chromosomes 1 and 6 (Sup- above, variants in H2M regions are problematic even when
plementary Figure S1) have regions in which GRC regions MNs are available. As such, variants present in MTN calls
correlated with our observation of abnormal VAF. In other were excluded from the gold standard set if they were lo-
cases, however, there were regions in which we detected ab- cated in H2M intervals unless they presented in COSMIC
normal VAF not in association with a GRC region, and we with at least 10 counts.
observed this along chromosomes 7, 14, 16 and 19 (Supple- To generate the experimental set of variants, the pipeline
mentary Figures S2–S5, Supplementary Section S2). Moti- was run for each tumor against each of 20 normal controls.
vated by these results, we developed an empiric measure of The variants from all 20 runs were collected and passed
baseline allelic fraction noise across the genome referred to into UNMASC’s workflow described below. The outcome
as hard to map (H2M) regions (Supplementary Materials of interest in the study was whether or not a variant de-
Section S4.3). A simulated example of H2M regions is also tected by the paired MTN analysis was also detected by
provided (Supplementary Figure S7). the UNMASC tumor only pipeline. A variant was assessed
to be present at a position if it was detected by consen-
H2M application to tumor only variant detection. Having sus across the iterated control runs. We confirmed exper-
shown that H2M positions have unfavorable properties for imentally that 100% detection of a variant across all nor-
variant detection in normal samples, we conclude that these mal controls was suboptimal because variable coverage and
positions are even more unfavorable for tumor variant de- other factors were responsible for occasional false negative
tection. To address this challenge, we considered different variant detection in any individual normal control at a spe-
approaches to identify and penalize such positions. Impor- cific location. At thresholds of 25%, 50%, 75%, 90% and
tantly, we demonstrated that such positions can be empir- 100% across all 100 samples led us to select 90% as an ap-
ically determined from non-cancer controls characterized propriate threshold for the proportion of UMNs a variant
by the sequencing platform configuration (such as capture was called in. This threshold provided a variant call with
bait set, sequencing strategy such as depth or read length) as robustness since 100% was too stringent for some samples
opposed to being inherent properties of the genome itself. when at least one UMN failed to call a variant. On the other
Accordingly, rather than creating a catalog of all H2M re- hand, a threshold6 NAR Cancer, 2021, Vol. 3, No. 4
Downloaded from https://academic.oup.com/narcancer/article/3/4/zcab040/6382329 by guest on 02 November 2021
Figure 2. Overall performance across the 100 benchmark tumor samples. Box plots were generated by averaging within each subject’s performance met-
rics for the 90% frequency threshold required to call a variant somatic. Columns correspond to the six cumulative filtering criterion (BASE includes
depth, Qscore, targeted capture, low/moderate/high impact, ExAC, 1000 Genomes filtering, UMNQC includes BASE and excluding low quality UMNs,
H2MGERM includes UMNQC along with H2M and GVs filtering, OXOG includes H2MGERM and removing oxoG variants, STRAND includes OXOG
along with removing strand bias AVs, and FFPE not only includes STRAND but also excludes paraffin AVs). Rows correspond to sensitivity (SENS),
positive predictive value (PPV), F1 measure (F1M) and number of filtered variant calls (#fVCs). The x-axis denotes the number of randomly selected
UMNs to perform the variant calling. SENS, PPV, F1M, #fVCs were averaged among the 10 instances of UMN draws at the 90% UMN call threshold
within a sample and summarized by boxplots.
(≥10), Qscore (≥10), targeted capture region, retaining positions as likely due to the oxoG artifact (loci clustered to
low/moderate/high impact exonic variants and present be- the tumor VAF cluster characterized by base substitutions
low a specific population allele frequency in ExAC and 1000 C>A/G>T, Supplementary Materials Section S4.5). The
Genomes (excluding common SNPs) (Supplementary Sec- fifth criteria ‘STRAND’ penalizes and excludes strand bias
tion S4.7). We defined a second criteria ‘UMNQC’ (UMNs variants (Fisher test P-value T/G>A and indels). In the current implementation the
in germline equilibrium (VIGE). VIGE variants are those strand bias does not consider context of the trinucleotide
variants which appear to have the same allele fraction as sequence but future implementations might. Details of UN-
known SNPs in their shared clustered region but are not MASC’s overview workflow are provided in the Supplemen-
present in a SNP database above a prespecified population tary Materials Section S4.8 and 4.9 and depicted in Supple-
threshold. Such variants are most likely private germline mentary Figure S8 along with a table summary in Supple-
SNPs but could represent at least two important alternative mentary Table S2.
classes: founder driver gene mutations which occur early in We evaluated UNMASC’s performance across the bench-
tumorigenesis and somatic mutations in samples with very mark samples and the filtering criteria (Figure 2). Consid-
high tumor purity. VIGE variants with posterior probabil- ering only quality filtering approaches (BASE criteria) gen-
ity >0.5 are excluded but the user might wish to interro- erated overall very high sensitivity, which was reassuring,
gate these specifically for the possibility of highly pure tu- but disappointingly low PPV and an overall large num-
mors or founder mutations (Supplementary Materials Sec- ber of variants per samples. By considering optimal num-
tion S4.6). A fourth criteria ‘OXOG’ penalizes and excludes ber and nature of normal controls (UMNQC criteria) weNAR Cancer, 2021, Vol. 3, No. 4 7
observed that the sensitivity approached 100%, no matter with paraffin artifact base substitution. Removal of these
which normal was used and no matter how many were em- variants had no impact on sensitivity and modest improve-
ployed. However, we clearly demonstrated that a subset (n ment in PPV and reduction in the total number of variants
= 3) of UMNs demonstrated unfavorable properties and called (Figure 3, column FFPE).
their exclusion improved the results overall (Figure 2, col- It should be noted that the order of filtering was empiri-
umn BASE). The impact of each filtering criteria can also cally developed. Several criteria are highly correlated, such
be observed for one selected sample (Supplementary Sec- as paraffin artifact, oxoG and strand bias. Filtering per-
tion S5 and Supplementary Figure S10). We determined formed in alternative orders would change the marginal im-
that compared to other controls, the unfavorable controls pact of each step but would arrive at the same final set of
demonstrated clustering in sequencing quality metrics to- variants. Extending this logic, and in consideration of spe-
ward the lower end although they remained in the accept- cific tumor examples we observed that across samples indi-
able range (Supplementary Figure S6 and Supplementary vidual filtering criteria had widely different impacts on the
Downloaded from https://academic.oup.com/narcancer/article/3/4/zcab040/6382329 by guest on 02 November 2021
Section S3). total number of variants and the concordance of those vari-
As part of the selection of normal controls, we consid- ants with the gold standard set.
ered the impact of race as a measure of genetic diversity Selected samples are highlighted in instances where a spe-
in the selection of controls. Racially diverse controls re- cific AV had a disproportionate and profound impact (Fig-
sulted in higher numbers of variants detected and they did ure 3). These examples document that the factors associ-
not decrease the sensitivity. Additionally, although racially ated with quality variant filtering are not uniform across
mismatched controls generated higher numbers of variants, clinical samples. Sample S1 is highlighted for its initial low
these did not generally inflate false positives because they PPV of 20% in column BASE and UMNQC but once H2M
were filtered out of the combined variant set which required and tumor VAF segmentation filters were applied, PPV
a variant to occur in 90% of all tumor-normal pairs. Re- reached 70% with 10 UMNs while maintaining 100% sen-
moving the three under-performing UMNs from the dataset sitivity. Samples S2 and S3, with approximate tumor puri-
increased the average sensitivity by a small amount, by re- ties of 90% suffer from low sensitivity once H2MGERM
moving outlier cases of lower sensitivity (Figure 2, column filters were applied. Gold-standard somatic variants were
UMNQC). Although sensitivity was high overall after con- excluded because their allele frequencies were inferred as
sidering the BASE and UMNQC criteria, the total number similar to the local BAF. Sample S4, a hematologic sam-
of variants per assay remained high (n = 50 on average for 3 ple had no gold standard variants after applying our filter-
mb of genome interrogated) and the PPV was modest over- ing criteria while five filtered TO variants remained. While
all (50%). sample S5 maintained 100% sensitivity, after applying filters
We observed that increasing numbers of normal controls BASE through FFPE, the PPV plateaued at about 25% be-
per sample decreased the false positive calls as expected by cause only one gold standard variant remained with an ad-
increasing the chances that any single normal control would ditional three TO variants. Sample S6, under filters BASE
contain a rare SNP that might otherwise be called a mu- through H2MGERM, had over 500 variant calls present in
tation. Somewhat unexpectedly, this benefit was marginal both the gold standard and TO. After applying oxoG fil-
and plateaued at around 10 normal controls. We then con- ters, the vast majority of both MTN and TO calls were ex-
sidered the impact of removing both variants in H2M re- cluded as AVs due to the genome-wide consistent AF rang-
gions (variants within a genomic segment where the major- ing between 1% and 3%. Moreover, with only 29 TO calls,
ity of nVAFs harboring a mixture of reference and non- 25 of which are refined MTN gold standard calls, sample
reference reads deviate from 0.5) and VIGE. The H2M S6 had a PPV increase from 50% to 86%. At last, sample
critera produced a significant decrease in the total num- S7 maintained 100% sensitivity across filtering criteria. The
ber of variants called and a significant increase in the PPV sample harbored about a dozen private GVs, about a dozen
(Figure 2, column H2MGERM) with overall little impact hard-to-map variants, 40 oxoG AVs, and 23 strand bias AVs
on sensitivity. Examples of wide and narrow regions con- where the noticeable increase in PPV came from the strand
sistently identified as H2M are presented in Supplemental bias filtering.
Figure S9. Looking across individual samples, the unfiltered variant
At this point we turned our attention away from over- calls have varying proportions of private GVs and varying
all trends towards individual samples demonstrating large sources of NGS AVs. These factors, along with tumor pu-
number of variants relative to other cases. We recognized rity and tumor type, individually impacted each sample’s
that these were overwhelmingly oxoG. Removal of oxoG metrics. But overall, applying the six levels of filtering crite-
AVs at this stage normalized the variant count of the out- ria achieved 94% SENS on average (median of 100%) and
lier samples with no measurable negative impact on other 76% PPV on average (median of 78%). It is important to
quality parameters (Figure 2, column OXOG). We then ob- note that if a higher level of sensitivity is desirable, it is pos-
served that there remained at least one sample with very sible to reduce the level of filtering. It is also important to
low PPV and considered the role of strand bias (Figure 3, note that to achieve these levels of test performance, we did
column STRAND). Filtering remaining variants for strand not require annotation filtering such as Polyphen-2 (33) or a
bias dramatically improved the PPV in a single case and im- similar approach. We reduced the total numbers of variants
proved the overall average PPV modestly with no measur- to a very manageable number with little loss of sensitivity.
able impact on sensitivity and slight decreases in the overall Further applications, such as the elimination of low impact
decrease in the number of called variants per sample. In a fi- mutations would allow even more focused review of driver
nal step, we observed a pattern of variants most consistent mutations in clinical and other cohorts.8 NAR Cancer, 2021, Vol. 3, No. 4
Downloaded from https://academic.oup.com/narcancer/article/3/4/zcab040/6382329 by guest on 02 November 2021
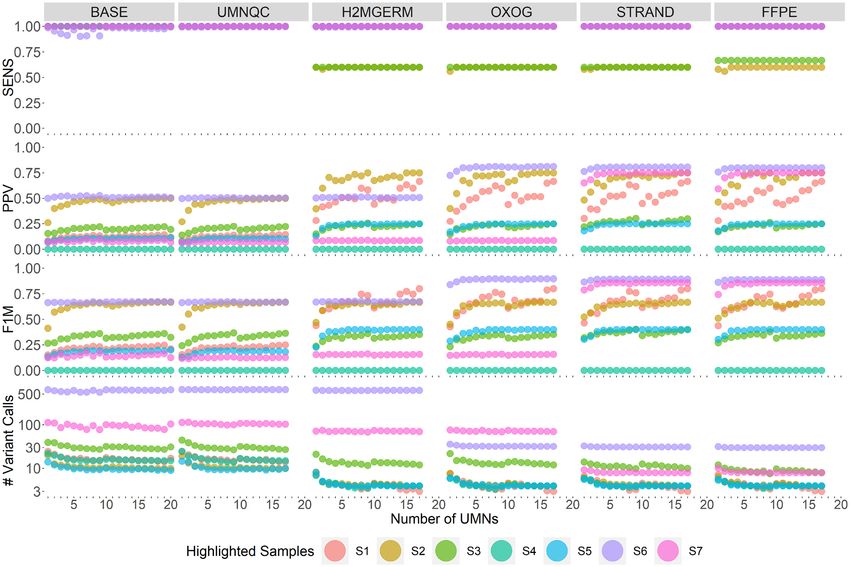
Figure 3. Performance of seven highlighted tumor samples. Columns correspond to the six cumulative filtering criterion (BASE includes depth, Qscore,
targeted capture, low/moderate/high impact, ExAC, 1000 Genomes filtering, UMNQC includes BASE and excluding low quality UMNs, H2MGERM
includes UMNQC along with H2M and germline variant filtering, OXOG includes H2MGERM and removing oxoG variants, STRAND includes OXOG
along with removing strand bias artifacts, and FFPE includes STRAND but also excludes paraffin artifacts). Rows correspond to sensitivity (SENS),
positive predictive value (PPV), F1 measure (F1M) and number of variant calls. The x-axis denotes the number of randomly selected unmatched normals
to perform the variant calling.
False positive calls. Using the filtering strategies described COSMIC with at least 10 counts regardless of other crite-
in Figure 2, we observed a plateauing in PPV approaching ria. However a subset of these calls also presented as vari-
80% with 10 UMNs after applying filtering criteria BASE ous AVs by UNMASC or were germline based on their MN
through FFPE due to false positive variants. We then pur- VAF. Among the 14 underlying GVs reported in COSMIC
sued a descriptive evaluation of the remaining 261 false- (≥25), ten of them could have been characterized as VIGE
positive variants in the cohort of 100 samples (Table 3). using UNMASC’s annotation if COSMIC’s annotation was
In UNMASC filtering, we offer strong prejudice to vari- ignored.
ants that have been reported recurrently in the COSMIC Among the 73 GVs, all but four have non-missing VIGE
database even though that Figure 1 and other reports sug- values. Thus the remaining GVs resulted in VIGE probabil-
gest that public databases may contain GVs and AVs. About itiesNAR Cancer, 2021, Vol. 3, No. 4 9
Table 3. Summary of false positive variants by reason and variant type. Numbers in the columns are the numbers of false positive variants. Shown in
parenthesis are the numbers of patients contributing to the false positive variant number in any class. For example, In row 1 column 2 there were 5 multi-
base deletions. Those 5 deletions occurred in 4 subjects, such that 3 subjects had 1 multi-base deletion and 1 subject had 2 multi-base deletions. The total
for the row was 8 variants occurring in 6 patients. False-positive variants are divided into base substitutions (Base Sub.), one and multi-base deletions
(One-base Del, Multi-base Del), and one and multi-base insertions (One-base Ins, Multi-base Ins). Rows labeled ‘COSMIC, ...’ indicate variants reported
in COSMIC at least 10 times and the reason they are false-positive. H2M genes correspond to variants located along genes with identified H2M regions.
Non-conforming control AF refers to variants’ matched nVAF appearing non-Mendelian and undetected by H2M. ‘Novel, ...’ rows refer to variants
determined to not be GV or AV (oxoG, FFPE, strand bias, H2M), with no variant present in the MN
Reason BS DEL (MB, 1B) INS (MB, 1B) Total
COSMIC, FFPE 5(4), 2(2) 0(0), 1(1) 8(6)
COSMIC, germline 13(12) 0(0), 1(1) 14(13)
COSMIC, oxoG 2(2) 2(2)
Downloaded from https://academic.oup.com/narcancer/article/3/4/zcab040/6382329 by guest on 02 November 2021
COSMIC, SB 5(5) 2(1), 0(0) 7(6)
Germline 61(38) 6(6), 6(6) 73(44)
H2M Genes 6(5) 2(2), 0(0) 0(0), 1(1) 9(8)
Non-conforming 46(30) 3(3), 2(2) 12(8), 6(6) 69(39)
control AF
Novel, chr1-chr22 3(3) 2(2), 2(2) 1(1), 0(0) 8(7)
Novel, chrX 5(3) 0(0), 1(1) 6(4)
Novel, in COSMIC 0(0), 3(3) 0(0), 2(2) 5(5)
Other 13(9) 12(11), 21(14) 8(4), 6(6) 60(29)
SB = strand bias, BS = base substitution. MB = multi-base. 1B = one base
and appeared to occur almost uniformly across autosomes GVs, 1 appeared to be H2M, and 3 were intronic or syn-
suggesting possible unaccounted source of artifact. onymous in terms of highest impact. Whether confirmed or
non-confirmed mutations, an underlying trade-off exists be-
The role of tumor purity. We looked exclusively at the re- tween detection and classification of mutations.
tained variants that underwent all six filtering criteria and
after using at least 15 UMNs. Recalling that as tumor purity Alternative approaches. For the purposes of indexing our
approaches one, a somatic founder variant (variant found effort to prior efforts, we reviewed a number of approaches
on all copies of a haplotype) and a heterozygous GV be- (Supplementary Table S1). Among the presented methods,
comes indistinguishable. This led us to explore the relation- we aimed for self-contained workflows with published and
ship between tumor purity, derived from the pathologist, open-source software that did not require supplying a pre-
and sensitivity as well as number of remaining variants and labeled variant set handled similar to the tumor samples
PPV (Supplementary Figure S11). Of the benchmark sam- of interest, which may not be available to the user, thereby
ples, two samples, one lymphoma and one hematologic, had excluding methods SGZ, ISOWN, GATKcan, TOBI and
missing purity estimates. The remaining samples had puri- Teer et al.’s method. The remaining methods included Hilte-
ties ranging from 20% to 90%. The figure supported the ex- mann et al.’s approach, SomVarIUS and LumosVar 2.0.
pected notion that purer samples would result in drops in The BASE and UMNQC steps of UNMASC’s filtering cri-
sensitivity because mutations with VAF close to germline teria align closely with Hiltemann’s general pipeline by uti-
BAFs generally suggests variants to be VIGE rather than lizing UMNs. Methods SomVarIUS and LumosVar were
somatic, just as in most algorithms. From the second plot, run with default arguments, targeted variants were retained,
we see the PPV converging toward 85% and with less vari- and then annotated with SnpEff for variant effect predic-
ability as the number of variants increase. The degree to tion to retain protein altering impact variants. The Hilte-
which variants were incorrectly classified is captured in Sup- mann workflow calls tumor variants against a set of UMNs
plementary Figure S12, which summarizes the number of and reports the intersection as somatic variants. SomVar-
false negative variants per sample as well as plots the fre- IUS runs without UMNs and annotates variants with cal-
quency of tumor purity of samples. Seventy false negative culated probabilities of being germline and/or artifact. On
variants across 30 benchmark samples contributed to the the other hand, LumosVar utilizes multiple UMNs to an-
drop in sensitivity. Thus across the 100 samples, approxi- notate positions in terms of coverage, quality, and depth
mately one variant per sample could be incorrectly classified and models the underlying biology in terms of tumor pu-
as germline when in fact it was somatic. These false negative rity, intra-tumor heterogeneity and copy number states.
variants composed of 58 base changes and 12 indels span- We summarized performances in terms of SENS, PPV,
ning 20 high, 42 moderate and 8 low or lesser worst case F1M and number of variants called (Figure 4). UNMASC
impacts where 16 of them originated from a single sample and Hiltemann achieve near 100% median sensitivity. Hilte-
with a pathologist reported purity of 90%. mann attained the second highest mean PPV and F1M met-
In addition to MTN variant calls, we analyzed the subset rics. SomVarIUS resulted in an average of 90 variants per
of clinically confirmed variants. Out of 215 confirmed vari- case compared to approximately 80 from SomVarIUS, 30
ants, all were present in the unfiltered variant calls. How- from LumosVar 2.0 and 10 from UNMASC. SomVarIUS’s
ever, 29 of them would have been excluded/flagged by UN- median sensitivity and PPV were approximately 25% and
MASC. Of the 29, one appeared to be a strand bias AV, 20 7%, respectively, while LumosVar’s median sensitivity and
appeared to be FFPE or oxoG AVs, 4 were heterozygous PPV were approximately 35% and 20%, respectively. Hilte-10 NAR Cancer, 2021, Vol. 3, No. 4
Downloaded from https://academic.oup.com/narcancer/article/3/4/zcab040/6382329 by guest on 02 November 2021
Figure 4. A summary comparison of Hiltemann, SomVarIUS, LumosVar 2.0 and UNMASC performances. Performance metrics include sensitivity
(SENS), positive predictive value (PPV), F1-measure (F1M) and number of variant calls after applying filters. The bold lines and points within boxplots
correspond to median and mean statistics per method and metric.
mann’s PPV was driven by the presence of unfiltered GVs facets in this field. First, our characterization is systematic
and AVs. Similarly for SomVarIUS, AVs including strand with a catalog of expected and unexpected challenges while
bias, FFPE, and oxoG composed the majority of false pos- estimating the relative impact of each on the outcome of
itives. The proportion of GVs was higher in SomVarIUS accurate variant detection. We demonstrate the empirical
than in Hiltemann due to misidentified BAF clusters. Lu- challenge that samples have varying numbers of underlying
mosVar 2.0 made some modest improvements over Som- ‘gold-standard’ variant calls and harbor undetected focal
VarIUS, but purity and copy number modeling posed a copy number alterations, artifacts and private GVs.
challenge with the prevalence of low AFs driven by AVs that A credible set of gold standard variants are required to
negatively impact the detection of underlying BAF clusters. assess the performance of any methodology in this space.
Finally, variants called within UNMASC’s identified H2M As such we provide an elegant public resource of a large
regions consistently emerged among Hiltemann, SomVar- set of tumors with MNs and UMNs. This set contains a
IUS, and LumosVar methods also resulting in lower PPV. wide distribution of sample and tumor types and includes
Therefore, SomVarIUS and LumosVar 2.0 appear relatively a range of high and lower quality samples representative of
unfavorable for our samples in terms of identifying GVs and clinical cohorts [dbGap phs001713.v1.p1]. Additionally, we
AVs. offer some of the most conclusive evidence that automated
variant calling in tumor with UMNs can be highly sensi-
tive (approaching 100%), highly specific and with very fa-
DISCUSSION
vorable PPV overall. Our approach of scoring variants by
Despite the importance of variant calling in research and various penalties allows the user to consider specific situa-
clinical care, as our work has shown, current methodology tions where excluded variants might warrant additional re-
still lacks precision when applied in an automated fashion. view. For example, in a sample suspected of being highly
UNMASC provides a new set of tools to address several pure for tumor in which somatic variants and contaminat-NAR Cancer, 2021, Vol. 3, No. 4 11
ing private GVs are difficult to distinguish, the user might itive when the concept of VIGE is incorporated in variant
decide to retain VIGE variants which are otherwise gener- filtering.
ally excluded.
While we integrate with public databases which are vital Limitations
to interpreting variants whether from MNs or UMNs cases,
TO variant calling suffers from several limitations. First, the
we also provide evidence as to the shortcomings of such
VAF is assumed to follow an underlying distribution that
database. Variants present in public databases such as COS-
allows us to model genotypes, germline/somatic status or
MIC or dbSNP that have unfavorable penalties by the H2M
subclonality. For this to work, however, the algorithms re-
criteria can be considered with added scrutiny, again ei-
quire the underlying signal across variants to largely out-
ther in paired MTN or unmatched cases. This tool does not
weigh the noise. This is not always true, especially among
require elimination of large regions of the genome, entire
indels and in the case of very pure tumors where separation
genes or cataloging of variants. UNMASC’s H2M pipeline
Downloaded from https://academic.oup.com/narcancer/article/3/4/zcab040/6382329 by guest on 02 November 2021
of somatic variants from germline allele frequencies is chal-
can be calculated on the fly and is tuned to the specific se-
lenging. As demonstrated by H2M regions, the AF is also a
quencing platform and parameters as long as UMNs from
function of the underlying mappability to genomic intervals
the same protocol are available. Although not the primary
from a reference genome, whether it is near regions of low
focus of this manuscript, we suspect that all samples, tumor
complexity or highly polymorphic.
and normal, can equally suffer in quality from low coverage
In normal and tumor read count modeling, we chose the
regions, misaligned reads, and AVs introduced from sam-
binomial over beta-binomial distribution when paired with
ple processing. Our work suggests that many normal sam-
a discrete uniform (noise) distribution. Through the noise
ples can serve as multiple controls against a tumor and that
and binomial mixture, highly variable VAFs would be con-
the nature of variant calling can be dynamically annotated
sidered noise whereas using a noise and beta-binomial mix-
by pooling normal samples. We also demonstrate that each
ture risks classifying them as over-dispersed beta-binomial
sample may present a unique set of challenges in the num-
variants depending on the distribution of noisy variants. In
ber and nature of variants as well as the protocol specific
terms of variant classification performance, we aim to main-
AVs.
tain high SENS for somatic variants while making small
sacrifices to PPV for AVs and GVs.
Identifying segments of copy number aberration using
H2M regions and other artifacts tumor read counts alone relies on a sufficient number of
sample-specific germline heterozygous variants. While UN-
One of the frustrations of reliable variant detection is that
MASC does not rely on detecting changes in total copy
many regions of the genome are more challenging than oth-
number from log R ratios (LRR), derived from matched or
ers for mutation calling, yet efficient identification of those
UMNs for LRR/BAF joint segmentation, segments can be
regions is elusive. Some users have developed catalogs of
misidentified due to a lack of GVs. In these regions, UN-
such challenging positions whereas a limited number of
MASC may misclassify variants, not provide VIGE infor-
techniques has proposed computational identification in-
mation, or characterize a segment as noisy (Supplementary
cluding BlackOps (7) and Umap (8). In the current ap-
Materials Section S4.6). This issue can be overcome when
proach, we develop an efficient method which is platform-
trading read depth for coverage going from targeted cap-
specific for high resolution scoring of regions for the un-
ture panel sequencing to whole exome or whole genome se-
favorable properties of being H2M, emphasizing that many
quencing.
such regions occur in small neighborhoods that can be iden-
A common issue that emerged from previous works is
tified stochastically by clustering their nVAF. The success
the fact that the ‘denominator’, or number of true-positive
of this genome regional clustering approach was extended
variants within a sample impacts the benchmark metric in-
to define the VIGE variants which share similar properties
terpretations. A larger number of true-positive variants will
in a regional manner. The VIGE variants cluster in regions
provide less spread in PPV and potentially reveals the con-
of shared copy number changes in a manner first identified
vergence of PPV. The right plot in Supplementary Figure
through the B allele frequency techniques of copy number
S11 captures the relationship between PPV and the number
analysis (4,6,22), and we integrate the presence of H2M into
of filtered MTN variants which appears to converge toward
this for the first time to our knowledge in the service of
80% or more given the scope of the UNCseq™’s targeted
variant filtering. Having identified variants with properties
capture region.
of H2M and VIGE allowed us to focus on other variants
whose allele frequencies and composition documented use-
Future directions
ful properties, usually pointing to NGS AVs such as oxoG
or paraffin sequencing artifact. Remaining variants, in most While the UNMASC benchmark was developed for tar-
cases, are those that were our true positives. The UNMASC geted capture human samples aligned to hg19, we may ex-
autopsy of remaining false positives and negatives docu- plore alternate capture versions (whole genome/exome),
mented the need for added concern for indels in the setting species and bioinformatic workflows (reference genomes,
of UMN variant detection, as well as raising caution for alignments and variant callers) to assess UNMASC’s
cases where annotated databases point the user astray. COS- protocol-specific features. UNMASC may integrate TO de-
MIC, for example contains many false positive variants in rived copy number calling methods such as SynthEx (34)
H2M locations. Additionally, we dismiss in most cases the to refine tumor read count segmentation and improve vari-
concern that private GVs are a major source of false pos- ant classification, especially in noisy genomic regions where12 NAR Cancer, 2021, Vol. 3, No. 4
identifying local germline allele frequency remains a chal- Conflict of interest statement. None declared.
lenge. From the benchmark, UMN screening is key to main-
taining high sensitivity and further work can be done to REFERENCES
identify low quality tumor and normal samples. Using UN-
1. Sherry,S.T., Ward,M.H., Kholodov,M., Baker,J., Phan,L.,
MASC, another aspect for future study may look to see if Smigielski,E.M. and Sirotkin,K. (2001) dbSNP: the NCBI database
H2M regions are associated with abnormalities from other of genetic variation. Nucleic Acids Res., 29, 308–311.
NGS-based platforms and analyses. Additional biologic 2. 1000 Genomes Project Consortium2015) A global reference for
constructs could also be incorporated into the work to aug- human genetic variation. Nature, 526, 68–74.
ment the variant distributions. For example, we could con- 3. Lek,M., Karczewski,K.J., Minikel,E.V., Samocha,K.E., Banks,E.,
Fennell,T., O’Donnell-Luria,A.H., Ware,J.S., Hill,A.J.,
sider the tri-nucleotide context for variant annotation to Cummings,B.B. et al. (2016) Analysis of protein-coding genetic
augment signals associated with linear DNA structure such variation in 60,706 humans. Nature, 536, 285–291.
as certain oxidation artifacts or mutations signals that occur 4. Smith,K.S., Yadav,V.K., Pei,S., Pollyea,D.A., Jordan,C.T. and De,S.
Downloaded from https://academic.oup.com/narcancer/article/3/4/zcab040/6382329 by guest on 02 November 2021
in the context of adjoining bases (35). (2016) SomVarIUS: somatic variant identification from unpaired
tissue samples. Bioinformatics, 32, 808–813.
The sample set constructed in the current report was in- 5. Sun,J.X., He,Y., Sanford,E., Montesion,M., Frampton,G.M.,
tended to include a diverse set of samples with the hypothe- Vignot,S., Soria,J., Ross,J.S., Miller,V.A., Stephens,P.J. et al. (2018) A
sis that important differences might be observed as a func- computational approach to distinguish somatic vs. germline origin of
tion of tumor type, gender or other clinical feature. Such genomic alterations from deep sequencing of cancer specimens
patterns were not systematically detected in the current re- without a matched normal. PLoS Comput. Biol., 14, e1005965.
6. Halperin,R.F., Carpten,J.D., Manojlovic,Z., Aldrich,J., Keats,J.,
port, although rare outlier samples were observed due to Byron,S., Liang,W.S., Russell,M., Enriquez,D., Claasen,A. et al.
unknown factors. Future cohort design might explore the (2017) A method to reduce ancestry related germline false positives in
etiology of such rare outliers for the sources of bias or arti- tumor only somatic variant calling. BMC Med. Genomics, 10, 1–17.
fact in the detection of variants such as experimental plat- 7. Cabanski,C.R., Wilkerson,M.D., Soloway,M., Parker,J.S., Liu,J.,
Prins,J.F., Marron,J., Perou,C.M. and Hayes,D.N. (2013) BlackOPs:
form (i.e. sequencing machine or chemistry), sample prepa- increasing confidence in variant detection through mappability
ration or other experimental conditions. filtering. Nucleic Acids Res., 41, e178.
8. Karimzadeh,M., Ernst,C., Kundaje,A. and Hoffman,M.M. (2018)
SUPPLEMENTARY DATA Umap and Bismap: quantifying genome and methylome mappability.
Nucleic Acids Res., 46, e120.
Supplementary Data are available at NAR Cancer online. 9. Guo,Y., Li,J., Li,C., Long,J., Samuels,D.C. and Shyr,Y. (2012) The
effect of strand bias in Illumina short-read sequencing data. BMC
Genomics, 13, 1–11.
ACKNOWLEDGEMENTS 10. Costello,M., Pugh,T.J., Fennell,T.J., Stewart,C., Lichtenstein,L.,
Meldrim,J.C., Fostel,J.L., Friedrich,D.C., Perrin,D., Dionne,D. et al.
Research reported in this publication was supported by (2013) Discovery and characterization of artifactual mutations in
the National Cancer Institute Cancer under award num- deep coverage targeted capture sequencing data due to oxidative
ber U10CA181009, CA211939, CA210988, UG1CA233333 DNA damage during sample preparation. Nucleic Acids Res., 41,
(D.H.). The UNCseq™ /LCCC1108 dataset request for ac- e67–e67.
11. Li,H. (2014) Toward better understanding of artifacts in variant
cess can be found at https://www.ncbi.nlm.nih.gov/projects/ calling from high-coverage samples. Bioinformatics, 30, 2843–2851.
gap/cgi-bin/study.cgi?study id=phs001713.v1.p1. The UN- 12. Church,D.M., Schneider,V.A., Graves,T., Auger,K., Cunningham,F.,
MASC R package is available at https://github.com/pllittle/ Bouk,N., Chen,H., Agarwala,R., McLaren,W.M., Ritchie,G.R. et al.
UNMASC. (2011) Modernizing reference genome assemblies. PLoS Biol., 9,
e1001091.
Author contributions: P.L. and D.N.H. conceived of the pre- 13. Church,D.M., Schneider,V.A., Steinberg,K.M., Schatz,M.C.,
sented idea which was initially motivated by a dataset pro- Quinlan,A.R., Chin,C., Kitts,P.A., Aken,B., Marth,G.T.,
vided by J.Z. and A.M. D.N.H., A.H. and H.J. assisted Hoffman,M.M. et al. (2015) Extending reference assembly models.
with developing the bioinformatic workflows. P.L. wrote the Genome Biol., 16, 1–5.
R package software, generated the tables and figures and 14. Ng,S.B., Buckingham,K.J., Lee,C., Bigham,A.W., Tabor,H.K.,
Dent,K.M., Huff,C.D., Shannon,P.T., Jabs,E.W., Nickerson,D.A.
analyzed variants generated by each tumor-only cohort. et al. (2010) Exome sequencing identifies the cause of a mendelian
J.Z., A.M., X.B., J.P., D.F., S.S., M.M., M.H. and A.S. pre- disorder. Nat. Genet., 42, 30–35.
pared multiple cohort datasets for analysis to complement 15. Ivanov,M., Laktionov,K., Breder,V., Chernenko,P., Novikova,E.,
the manuscript’s benchmark samples. D.N.H., H.J., A.M., Telysheva,E., Musienko,S., Baranova,A. and Mileyko,V. (2017)
Towards standardization of next-generation sequencing of FFPE
X.B., J.P., D.F., S.S. and K.H. encouraged P.L. to investi- samples for clinical oncology: intrinsic obstacles and possible
gate gene-specific mutations and provided critical feedback solutions. J. Transl. Med., 15, 1–13.
that motivated the development of various automated steps 16. Wong,S.Q., Li,J., Tan,A.Y., Vedururu,R., Pang,J.B., Do,H., Ellul,J.,
integrated into the workflow. DNH supervised the project. Doig,K., Bell,A., McArthur,G.A. et al. (2014) Sequence artefacts in a
prospective series of formalin-fixed tumours tested for mutations in
hotspot regions by massively parallel sequencing. BMC Med.
FUNDING Genomics, 7, 1–10.
17. Do,H. and Dobrovic,A. (2015) Sequence artifacts in DNA from
National Cancer Institute [CA210988, CA211939, formalin-fixed tissues: causes and strategies for minimization. Clin.
U10CA181009, UG1CA233333]. National Cancer In- Chem., 61, 64–71.
stitute [CA233333 Hayes, CA264021 Hayes and Hoadley, 18. Hiltemann,S., Jenster,G., Trapman,J., van der Spek,P. and Stubbs,A.
CA211939 Hayes and Zevallos, P30CA016086]. National (2015) Discriminating somatic and germline mutations in tumor
DNA samples without matching normals. Genome Res., 25,
Institute of Dental and Craniofacial Research [DE025712 1382–1390.
Hayes]. Lineberger Comprehensive Cancer Center Univer- 19. Cibulskis,K., Lawrence,M.S., Carter,S.L., Sivachenko,A., Jaffe,D.,
sity Cancer Research Fund. Sougnez,C., Gabriel,S., Meyerson,M., Lander,E.S. and Getz,G.You can also read