UPDATING THE EMISSION MODEL FOR RESIDENTIAL WOOD COMBUSTION - AU AARHUS UNIVERSITY
←
→
Page content transcription
If your browser does not render page correctly, please read the page content below
UPDATING THE EMISSION MODEL FOR
RESIDENTIAL WOOD COMBUSTION
Scientific Report from DCE – Danish Centre for Environment and Energy No. 442 2021

AU
 AARHUS
 UNIVERSITY
 DCE – DANISH CENTRE FOR ENVIRONMENT AND ENERGY
UPDATING THE EMISSION MODEL FOR
 RESIDENTIAL WOOD COMBUSTION
 Scientific Report from DCE – Danish Centre for Environment and Energy No. 442 2021

 Ole-Kenneth Nielsen
 Malene Nielsen
 Marlene S. Plejdrup

 Aarhus University; Department of Environmental Science

AU
 AARHUS
 UNIVERSITY
 DCE – DANISH CENTRE FOR ENVIRONMENT AND ENERGY
Data sheet

 Series title and no.: Scientific Report from DCE – Danish Centre for Environment and Energy No. 442

 Category: Scientific advisory report

 Title: Updating the emission model for residential wood combustion

 Authors: Ole-Kenneth Nielsen, Malene Nielsen, Marlene S. Plejdrup
 Institution: Aarhus University; Department of Environmental Science

 Publisher: Aarhus University, DCE – Danish Centre for Environment and Energy ©
 URL: http://dce.au.dk/en

 Year of publication: May 2021
 Editing completed: April 2021

 Referees: Katja Hossy Hjelgaard (internal), Jytte Boll Illerup (external)
Quality assurance, DCE: Vibeke Vestergaard Nielsen

 External comments: The comments can be found here: http://dce2.au.dk/pub/komm/SR442_komm.pdf

 Financial support: Ministry of Environment

 Please cite as: Nielsen, O.-K., Nielsen, M. & Plejdrup, M.S., 2021. Updating the emission model for
 residential wood combustion. Aarhus University, DCE – Danish Centre for Environment
 and Energy, 85 pp. Scientific Report No. 442. http://dce2.au.dk/pub/SR442.pdf

 Reproduction permitted provided the source is explicitly acknowledged

 Abstract: The report documents the updates made to the emission estimation model for
 residential wood combustion. The revisions included new estimates for the total
 number of wood stoves through the time series, new replacement rates for stoves and
 update to a number of emission factors taking the most recent measurement studies
 into account. The report also documents some of the uncertainties involved with
 estimating emissions from residential wood combustion and highlights potential
 future improvements.

 Keywords: Emission inventory, residential wood combustion, wood stoves, PM2.5 emissions.

 Layout: Ann-Katrine Holme Christoffersen, Department of Environmental Science
 Front page photo: Ann-Katrine Holme Christoffersen, Department of Environmental Science

 ISBN: 978-87-7156-592-8
 ISSN (electronic): 2245-0203

 Number of pages: 85

 Internet version: The report is available in electronic format (pdf) at
 http://dce2.au.dk/pub/SR442.pdf
Contents

Preface 5

Summary 6

Sammenfatning 8

1 Introduction 10

2 Emission model 11
 2.1 Overview 11
 2.2 Wood burning appliances 11
 2.3 Annual sales 12
 2.4 Replacement curves 12
 2.5 Unit consumption 13
 2.6 Comparison to energy statistics 13

3 Number of wood burning appliances 16
 3.1 Literature study 16
 3.2 Data analysis 19
 3.3 Data selection 23

4 Emission factors 37
 4.1 Former emission factors 37
 4.2 Primary new Danish references and priority criteria 37
 4.3 Revised emission factors 39
 4.4 Overview of revised emission factors 61
 4.5 Recalculations caused by revised emission factors 64

5 Results of the updated model 66

6 Uncertainties 68
 6.1 Wood consumption 68
 6.2 Emission factors 69
 6.3 Number of appliances per technology 69
 6.4 Expected lifetime and replacement rates 70

7 Future work 71

References 72

Annex 1 - Former emission factors for residential wood stoves
 and boilers 79
Preface

This report documents the changes made to the residential wood combustion
model in 2019 that was reported to the EU National Emission Ceilings Di-
rective and the Convention on Long-Range Transboundary Air Pollution.

The authors would like to thank the following for valuable discussions and
input during the revision of the model:

• Brian Kristensen, Heidi Ravnborg and Christian Lange Fogh, Ministry of
 Environment and Food
• Ole Moeslund and Ditte Kristensen, Danish Environmental Protection
 Agency
• Kjeld Vang, Foreningen af Danske Leverandører af Pejse og Brændeovne
 (DAPO)
• Danish association of Chimneysweepers.

 5
Summary

 Residential wood combustion is an important source of air pollution in Den-
 mark and therefore attracts great attention. The share of residential wood
 combustion to several pollutants such as carbon monoxide, volatile organic
 compounds, fine particulate matter (PM2.5) and polycyclic aromatic hydrocar-
 bons (PAHs) are very high, and especially for the pollutants most associated
 with adverse impacts on human health such as particulate matter.

 In 2019 and 2020, work was done to update and document the model used to
 estimate emissions from residential wood combustion. The results of this
 work is presented in this report.

 The model has been described in Chapter 2 of this report including a descrip-
 tion of the most important model parameters.

 There is however, large uncertainties associated with the emission inventory,
 as there are many parameters in the emission calculation model, all of which
 have varying levels of uncertainty. The parameters include the number of ap-
 pliances per technology, the age distribution, the wood consumption and the
 emission factors. To estimate the age distribution it is necessary to make as-
 sumptions on the expected lifetime and replacement rates of stoves and boil-
 ers.

 The assumptions behind the total number of wood burning appliances and
 the replacement rates of various stove technologies were revisited and
 changes were made using the best available knowledge. The model improve-
 ment is based on a review of available literature and analysis of data from
 surveys, relevant projects and from the chimneysweeper association.

 Time series for the number of wood burning appliances have been updated.
 The methodology has been updated so that time series is being based on re-
 placement rates and sales numbers.

 Unit consumptions per technology is used for bottom-up estimation of wood
 consumption. In accordance with the international guidelines for emission in-
 ventories submitted to the UN and the EU, the emissions from residential
 wood combustion must be based on the fuel consumption as given in the na-
 tional energy statistics published by the Danish Energy Agency. To comply
 with the guidelines, the bottom-up estimated wood consumption is scaled to
 the fuel consumption as given in the national energy statistics.

 For the emission factors, recent literature was analysed to update emission
 factors. The update focussed on the pollutants with the highest impact on na-
 tional emissions, and categories (technologies) where the existing emission
 factors had been identified as being in need of updating. Revised emission
 factors were established for particulate matter (PM), black carbon (BC), poly-
 cyclic aromatic hydrocarbons (PAH), polychlorinated dibenzo-p-dioxins and
 dibenzofurans (PCDD/F), nitrogen oxides (NOx), carbon monoxide (CO) and
 sulphur dioxide SO2.

6
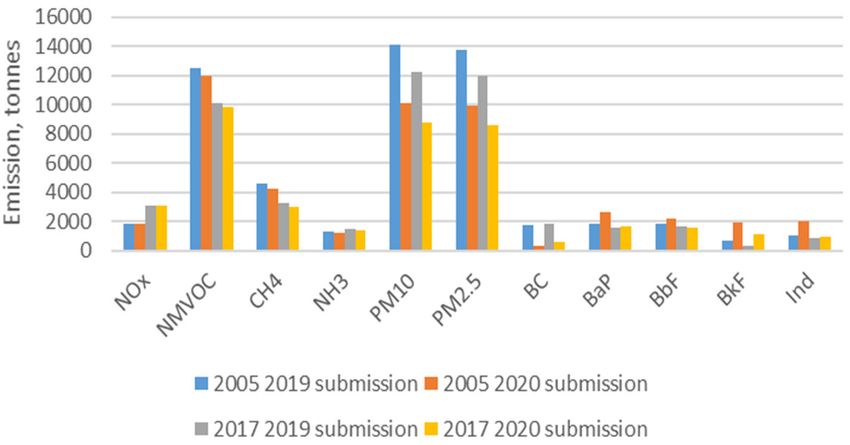
The updated model caused significant changes in emissions of several pollu-
 tants. The largest changes were related to particulate matter, carbon monox-
 ide, black carbon, dioxins (PCDD/F) and PAHs. For the other pollutants,
 changes were smaller. The main recalculations are shown in the table below.

 2005 2005 2017 2017
Pollutant 2019 submission 2020 submission 2019 submission 2020 submission
NMVOC 12461 11960 10063 9866
CO 86782 91573 72489 76001
PM2.5 13742 9922 11923 8584
BC 1750 355 1831 554
PCDD/F (g) 12.3 14.6 11.3 24.3
Benzo(a)pyrene 1842 2624 1599 1688
Benzo(b)fluoranthene 1784 2160 1673 1567
Benzo(k)fluoranthene 661 1900 301 1071
Indeno(1,2,3-cd)pyrene 1055 2024 882 925

 While the updated model and data are improved compared to the old model,
 there are still significant uncertainties associated with the estimation of emis-
 sions from residential wood burning. There are uncertainties associated with
 all parameters included in the model and while uncertainties can be lowered,
 emissions from residential wood combustion will continue to have a high un-
 certainty.

 Future improvements to the model and input data will primarily depend on
 new and improved data becoming available. Emission measurement pro-
 grammes producing emission factors are periodically carried out and the re-
 sults of these measurements will continue to be of interest and may cause up-
 dates to the emission factors.

 New data on the use of wood burning appliances are produced as part of the
 survey conducted for the energy statistics. While data historically have been
 very fluctuating making it difficult to draw firm conclusions, the results of
 these surveys will continue to be monitored.

 For future improvement to the model and emission estimation, data on the
 number, type and age of the appliances could be an important element to up-
 date. The chimneysweepers inspect all appliances frequently at least once a
 year and it would be beneficial if further details was included in the registra-
 tion and made available. This includes information about appliance age, fur-
 ther details about technology, and indication of the extent to which the appli-
 ances are used, e.g. primary heating, supplementary heating or occasionally.
 Such information can contribute to update the total appliance numbers, to im-
 prove the age and technology distribution and in the longer term to verify or
 improve the replacement rates.

 7
Sammenfatning

 Træfyring i husholdninger er en væsentlig kilde til luftforurening i Danmark,
 og tiltrækker sig derfor stor opmærksomhed. Træfyring i husholdningers an-
 del af den samlede nationale emission er meget høj for flere forureningskom-
 ponenter, f.eks. kulmonooxid, kulbrinter, fine partikler (PM2.5) og polycykli-
 ske aromatiske kulbrinter (PAH’er), og især for de forureningskomponenter,
 der har størst negativ indflydelse på sundhed, som f.eks. partikler.

 I 2019 og 2020 er der blevet udført et arbejde med henblik på at opdatere og
 dokumentere modellen, der anvendes til at beregne emissioner fra træfyring
 i husholdninger. Resultatet af dette arbejde præsenteres i denne rapport.

 Der er store usikkerheder forbundet med emissionsopgørelsen for træfyring i
 husholdninger, da mange parametre indgår i beregningen af emissionen, som
 alle har større eller mindre usikkerheder tilknyttet. Dette gælder antallet af
 anlæg per teknologi, aldersfordelingen, træforbruget og emissionsfaktorerne.
 For at skabe en tidsserie over aldersfordelingen er det derudover nødvendigt
 at gøre antagelser om gennemsnitlig levetid og udskiftningsrater for ovne og
 kedler.

 Antagelserne bag det totale antal af træfyrede anlæg og udskiftningsrater for
 forskellige teknologier er blevet opdateret på baggrund af den bedst tilgæn-
 gelige viden. Forbedringerne i modellen er baseret på en gennemgang af til-
 gængelig litteratur og analyse af data fra spørgeskemaundersøgelser, samt
 data fra Skorstensfejerlauget og dialog med branchen.

 Tidsserien for antallet af træfyrede anlæg er blevet opdateret. Metoden base-
 res nu på udskiftningskurver og salgstal, mens antallet af ovne i historiske år
 er blevet genvurderet på baggrund af tilgængelige data.

 Enhedsforbrug per teknologitype anvendes til bottom-up beregning af
 træforbruget. I overensstemmelse med internationale retningslinjer for emis-
 sionsopgørelser rapporteret til EU og FN, så skal emissionsopgørelsen baseres
 på den officielle energistatistik publiceret af Energistyrelsen. For at følge disse
 retningslinjer bliver det bottom-up beregnede træforbrug skaleret, så det
 stemmer overens med det opgivne træforbrug i energistatistikken.

 For emissionsfaktorerne er der foretaget et litteraturstudie med henblik på at
 vurdere, hvor der var basis for at opdatere værdierne. Opdateringen fokuse-
 rede på forureningskomponenter med den højeste betydning for de samlede
 nationale emissioner og specifikke teknologier, som var blevet identificeret
 som havende brug for en opdatering. Opdaterede emissionsfaktorer er imple-
 menteret for partikler, sod (black carbon), polycykliske aromatiske forbindel-
 ser (PAH), dioxiner og furaner (PCDD/F), kvælstofoxider (NOx), kulmonoxid
 (CO) og svovldioxid (SO2).

 Den opdaterede model medførte væsentlige ændringer i emissionerne af flere
 forureningskomponenter. De største ændringer var for partikler, kulmo-
 noxid, black carbon, dioxin og PAH. For de resterende forureningskompo-
 nenter var ændringer mindre. De væsentligste genberegninger i vist i neden-
 stående tabel.

8
2005 2005 2017 2017
Forureningskomponent 2019-aflevering 2020-aflevering 2019-aflevering 2020-aflevering
NMVOC 12461 11960 10063 9866
CO 86782 91573 72489 76001
PM2.5 13742 9922 11923 8584
BC 1750 355 1831 554
PCDD/F (g) 12,3 14,6 11,3 24,3
Benzo(a)pyren 1842 2624 1599 1688
Benzo(b)fluoranthen 1784 2160 1673 1567
Benzo(k)fluoranthen 661 1900 301 1071
Indeno(1,2,3-cd)pyren 1055 2024 882 925

 Selvom den opdaterede model er væsentlig forbedret i forhold til den tidli-
 gere model, så er det nødvendigt at understrege, at der fortsat er store usik-
 kerhede forbundet med emissionsopgørelsen for træfyring i husholdninger.
 Der er usikkerheder forbundet med alle parametre i modellen og selvom, der
 fortsat vil blive arbejdet på at nedbringe usikkerhederne, så vil træfyring i
 husholdninger fortsat være forbundet med væsentlige usikkerheder.

 Fremtidige forbedringer af modellen og inputdata vil primært afhænge af til-
 gængeligheden af nye og bedre data. Der udføres med mellemrum projekter
 som måler emissioner fra træfyringsanlæg, og resultaterne af disse målepro-
 jekter vil fortsat være interessante og kan føre til opdateringer af emissions-
 faktorerne.

 Nye data for anvendelsen af træfyringsanlæg fremkommer som en del af den
 undersøgelse, som udføres hvert andet år som en del af arbejdet med energi-
 statistikken. Selvom data i de tidligere undersøgelser har vist store fluktuati-
 oner mellem undersøgelser, hvilket gør det svært at lave konklusioner, vil re-
 sultaterne af disse undersøgelser fortsat blive analyseret.

 I forhold til fremtidige forbedringer af modellen vil data for antal, type og
 alder af træfyringsanlæg være vigtige elementer at få opdateret. Skorstensfe-
 jerne inspicerer alle ildsteder jævnligt og mindst en gang om året, og det vil
 være af stor værdi, hvis yderligere detaljer blev registreret i forbindelse med
 disse inspektioner. Disse detaljer er f.eks. oplysninger omkring anlæggets al-
 der, type og oplysninger om hvorvidt anlægget anvendes til primær opvarm-
 ning, sekundær opvarmning eller kun bruges lejlighedsvist. Oplysninger om-
 kring dette vil direkte kunne bruges til at opdatere det totale antal, aldersfor-
 deling, teknologifordeling og på længere sigt medvirke til at verificere eller
 forbedre antagelserne omkring udskiftningsrater.

 9
1 Introduction

 DCE (Danish Centre for Environment and Energy), Aarhus University is con-
 tracted by the Ministry of the Environment and Food and the Ministry of En-
 ergy, Utilities and Climate to complete emission inventories for Denmark. De-
 partment of Environmental Science, Aarhus University is responsible for cal-
 culation and reporting of the Danish national emission inventory to the EU
 (Monitoring Mechanism Regulation & Directive on reduction of national
 emissions of certain atmospheric pollutants) and the UNFCCC (United Na-
 tions Framework Convention on Climate Change) and UNECE CLRTAP
 (Convention on Long Range Transboundary Air Pollution) conventions.

 Residential wood combustion is an important source of air pollution in Den-
 mark and therefore attracts great attention. There is however, large uncertain-
 ties associated with the emission inventory, as there are many parameters in
 the emission calculation, all of which have varying levels of uncertainty. This
 consists of both the number of appliances per technology, the age distribution,
 the wood consumption and the emission factors. To create a time series, it is
 also necessary to have assumptions on the expected lifetime (to calculate the
 age distribution) and replacement rates of stoves and boilers.

 The previous model is documented in the Informative Inventory Report (IIR)
 for 2019 (Nielsen at al., 2019).

 The contribution from residential wood combustion to several pollutants is
 very high, and especially for some of the pollutants most associated with ad-
 verse impacts on human health such as particulate matter. For example, in
 2018 residential wood combustion accounts for more than half of the emission
 of PM2.5, more than 60 % of PAH emissions and more than 30 % of CO emis-
 sion.

 As residential wood combustion is also an important source in many other
 countries there is constantly being generated new knowledge, which should
 be reflected in the inventory to ensure that the emission estimate is as accurate
 as possible. Several Danish/Nordic studies have been carried out in recent
 years, which fed in to the update of the emission factors. Also, a general liter-
 ature survey was carried out to further inform the update of the emission fac-
 tors.

 The following Chapters are documenting the various aspects of the model
 that were revised in this update. It includes the model itself, e.g. assumption
 on replacement curves, annual sales etc., the overall number of appliances and
 the emission factors. Finally, the results of the updated model is presented
 and compared to the previous model and the uncertainties are discussed.

10
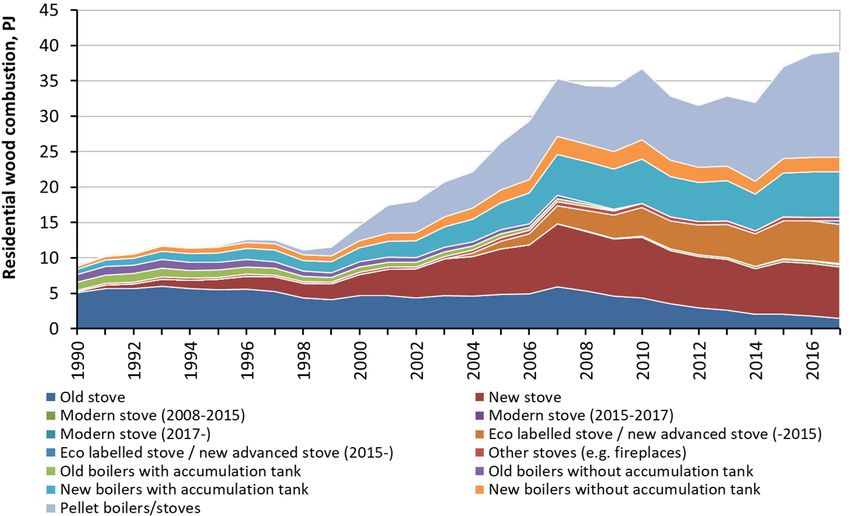
2 Emission model

2.1 Overview
The model calculating emissions from residential wood combustion is using
many parameters. The most important parameters are: number of wood burn-
ing appliances divided on technologies, replacement rates of appliances, unit
wood consumption and emission factors for each pollutant and appliance.
The emission is calculated using the equation:

∑ × ,

Where, ADs is the scaled activity data, EF is the emission factor, and i is the
appliance type. ADs is calculated using the following equation:

 = × × ∑ ,
 ×

Where, ADstst is the statistical wood consumption from the energy statistics,
N is the number of appliances, UC is the unit consumption and i is the appli-
ance type.

A description of most of the parameters related to the activity data are de-
scribed in this chapter, while the total number of wood burning appliances is
described in Chapter 3. The emission factors are described in Chapter 4.

2.2 Wood burning appliances
The wood burning appliances included in the model are shown in table 2.1.
For most pollutants, the newer technologies have significantly lower emis-
sions compared to the older technologies. However, this is not true for all pol-
lutants, e.g. black carbon and NOx, for more information see Chapter 4 on
emission factors. In terms of number, the largest category is stoves and the
older stoves are continuously replaced by newer stoves, more information on
the split is provided in Chapter 5. In the updated model, the category ‘other
stoves’ has been split into two categories for low-emitting (e.g. masonry
stoves) and high-emitting (e.g. fireplaces) stoves. In addition, the category for
eco-labelled stoves have been subdivided and now include three subcatego-
ries instead of two.

 11
Table 2.1 Type of wood burning appliances considered.
 Appliance type Further information
 Stove (-1989)
 Stove (1990-2007) Stove with Danish Standard mark
 Stove (2008-2014) Stove conforming with Danish legislation (2008)
 Stove (2015-2016) Stove conforming with Danish legislation (2015)
 Stove (2017-) Stove conforming with Danish legislation (2017)
 Eco labelled stove / new advanced stove (-2014) Stove conforming to the ecolabel (Svanemærket) until 2014
 Eco labelled stove / new advanced stove (2015-2016) Stove conforming to the ecolabel (Svanemærket) 2015-2016
 Eco labelled stove / new advanced stove (2017-) Stove conforming to the ecolabel (Svanemærket) from 2017
 Open fireplaces and similar
 Masonry stoves and similar
 Boilers with accumulation tank (-1979)
 Boilers without accumulation tank (-1979)
 Boilers with accumulation tank (1980-)
 Boilers without accumulation tank (1980-)
 Pellet boilers/stoves

 2.3 Annual sales
 The annual sales figures are not publically available, but a time series has been
 constructed based on information from the industrial association for suppliers
 of fireplaces and wood stoves (Kristensen, 2019) together with DCE assump-
 tions.

 Table 2.2 Annual sales of wood stoves.
 Year -1996 1997-2000 2001-2005 2006-2010 2011-2018
 Annual sale 20000 25000 31000 22400 20500

 The specific number varies between the years, but for the purpose of the
 model, approximate averages have been calculated and used in the model.

 For the other technologies, there is no information on the annual sales. For
 boilers there is a fixed assumption on a replacement rate of 3.3 % per annum,
 corresponding to a lifetime of 30 years.

 2.4 Replacement curves
 Since detailed data are not available on annual scrapping of old stoves, con-
 struction of new stoves and replacement of existing stoves, the population of
 stoves has been modelled using a replacement curve. The curve has been con-
 structed with input from the industry, chimneysweepers, the Danish EPA and
 the Ministry of Environment and Food.

 The constructed curve assumes that the first stove is replaced/scrapped 15
 years after being sold with the last stove being replaced/scrapped 50 years
 after being sold. The majority of stoves are being replaced/scrapped between
 the ages of 20 and 40.

12
Figure 2.1 Replacement curve for wood burning stoves.

The age distribution of wood stoves are done using the replacement curves in
combination with the information on annual sales.

For other technologies, there is either no age dependent technology split
(wood pellet appliances, fireplaces and similar, masonry stoves and similar)
or there is assumed a fixed rate replacement (wood boilers).

2.5 Unit consumption
For the different appliances, a unit consumption is used to estimate the total
wood consumption. The unit consumption has not been changed in the up-
date of the model with the exception that ‘other stoves’ has been subdivided.
The unit consumption for all stoves are considered equal and the same is the
case for the boilers. The data for unit consumption is referenced to Ea Ener-
gianalyse (2016) and the values are shown in Table 2.3. The unit consumptions
are weighted between permanent residences and summerhouses based on the
information provided in Ea Energianalyse (2016).

Table 2.3 Unit consumptions for different appliance types.
Appliance type GJ/appliance
Stoves 23.4
Open fireplaces and similar 11.8
Masonry stoves and similar 42.1
Boilers 121.2

The study conducted by Ea Energianalyse (2016) did not show a significant
difference in unit consumption based on the age of the appliance. The study
indicated a slightly higher consumption in appliances newer than 2005 com-
pared to older appliances. In permanent residences, there was a clear indica-
tion that the unit consumption is lower in Copenhagen and the Capital Region
compared to the other regions of Denmark. This does not impact the national
emission inventory, but is taken into account in the spatial distribution of
emissions (Plejdrup et al. 2016 & Plejdrup et al., 2018)

2.6 Comparison to energy statistics
When calculating the wood consumption based on the number of appliances
and the unit consumption, the total does not match the registered consump-
tion in the Danish energy statistics (DEA, 2019). Since the inventory should be
based on the official energy statistics, the wood consumption calculated bot-
tom-up is scaled with the official wood consumption in the energy statistics.
The scaling is done across all technologies of appliances using firewood, i.e.

 13
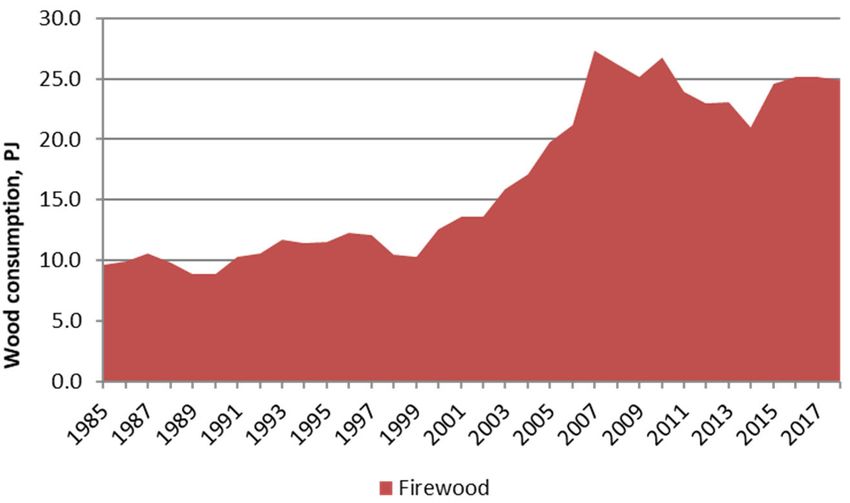
all technologies except wood pellet stoves/boilers. This assumption is made
 since no other information is available. This will however, be analysed further
 in the future. The scaling factors are shown in Table 2.4. The wood consump-
 tion in the energy statistics is lower than the bottom-up calculation in the early
 part of the time series, so the calculated consumption is divided by the scaling
 factors shown in Table 2.4.

 Table 2.4 Scaling factors for wood consumption to match the energy statistics.
 Year 1990 2000 2005 2010 2015 2018
 Scaling factor 2.5 1.8 1.2 1.0 1.0 1.0

 It can be seen that the correlation between the bottom-up estimated wood
 consumption and the statistics are much better in the last part of the time se-
 ries compared to the first part. This is partly connected to the fact that in later
 years the biennial surveys have been utilised both in the energy statistics and
 in the emission inventory. A graphical presentation of the scaling factors is
 included in Figure 2.2.

 Figure 2.2 Scaling factors for 1985 to 2018.

 The poor correlation in the beginning of the time series can possibly be at-
 tributed to a change in the energy statistics. The first survey on residential
 wood combustion was carried out for the year 2005 and showed a markedly
 higher wood consumption than previously considered in the statistics. A re-
 vision was made for 2000 to 2005 but not further back in time. As a result, the
 consumption of firewood shows a very large increase over these years as il-
 lustrated in Figure 2.3.

14
Figure 2.3 Firewood consumption in the energy statistics (DEA, 2019).

The firewood consumption increases by 118 % from 2000 to 2007 in the energy
statistics. While there was an increase in the number of stoves in that period,
there is no indications that it can justify that large an increase in wood con-
sumption. The development has also been discussed with the industry and
chimneysweepers and there is no evidence that the large increase is the result
of actual change but rather mostly a result of changes in methodology in the
statistics when starting to use surveys in the statistics in 2007 for the year 2005.

 15
3 Number of wood burning appliances

 The 2019 update of the residential wood combustion model includes an up-
 date of the number of appliances. A review of relevant data and literature
 have been carried out and used for decision of input data to the final time
 series for wood burning appliances. Updated time series have been made for
 the number of wood stoves. The time series for other stoves, masonry and
 wood boilers have been updated regarding the number of appliances, but no
 data has been found to support annual variation, and the number of these
 appliances are kept constant for the time series. The data and analysis behind
 the updated time series for appliance numbers are described in the following
 chapters.

 3.1 Literature study
 A literature study has been carried out to identify relevant information re-
 garding the number of wood burning appliances in Denmark and the devel-
 opment over time.

 3.1.1 Biennially surveys on residential wood consumption
 Biennially surveys focusing on the residential wood consumption in Denmark
 have been carried out by Force Technology for the years 2005, 2007, 2009, 2011
 and 2013 (Evald, 2006, 2008, 2010, 2012 & Hansen 2015), and by Ea Energian-
 alyse for 2015 (Ea Energianalyse, 2016). The surveys focus on the latest year,
 but do not include any time series or update of results from earlier years’ sur-
 veys.

 The first surveys by Force Technology (Evald, 2006; Evald 2008) were based
 on phone interviews with around 1 000 respondents in 2005 and 2007, 2 000
 respondents in 2009 and 2011, and around 2 100 respondents in 2013 (Table
 3.1). The methodology was changed in the 2015-survey, where the survey was
 send by digital mail to 40 000 households, resulting in 13 229 respondents.

 Table 3.1 Information from the biennial surveys on residential wood consumption in Den-
 mark.
 Year Respondents Stoves Fireplace Boilers Masonry
 2005 1 042 507 944 39 971 47 753
 2007 964 679 292 49 900 93 980
 2009 2 027 717 730 76 622 31 429
 2011 2 014 750 229 58 174 16 621 ~3 500-5 000
 2013 2 133 725 283 72 794 18 270 ~5 000
 2015 13 229 738 600 49 743 47 500 2 657

 The same methodology and questionnaire was used in the 2005-survey and
 2007-survey, see Evald (2006 and 2008).

 In the 2009-survey (Evald, 2010), questions regarding the age distribution of
 appliances and the occurrence of appliances with the Nordic eco-label
 (Svanemærket). Further, the survey was changed to include a representative
 number of households with fixed line phone, mobile phone and both, in con-
 trast to the earlier surveys only covering households with fixed line phone.

16
The 2011-survey (Evald, 2012) was extended with questions regarding the use
of briquettes and the size and location of the household (rural or urban area).

The 2013-survey (Hansen, 2015) was extended with questions regarding use
of other heating types, and if the wood burning appliances were used as pri-
mary or supplementing heating source.

The 2015-survey (Ea Energianalyse, 2016) followed a new methodology, as
the questionnaire was send by digital mail, which made it possible to contact
a much larger number of households, and thereby increase the number of re-
spondents significantly. The questionnaire was changed due to the shift from
phone interview to digital survey, but the subjects were rather similar.

The numbers of appliances on national level were estimated from the answers
according to the number of households in Denmark (see Figure 3.1). Due to
less respondents in the early surveys, the uncertainty is higher than for the
later surveys with more respondents, especially for the less occurring appli-
ance types; fireplaces and boilers, as the numbers are extrapolated to national
level. The number of masonry separately is not included in the surveys 2005-
2009, while the surveys for 2011 and 2013 include expert judgements. An es-
timate of the number of masonry is included in the 2015-survey.

A large increase of the number of stoves is seen from 2005-2009. Due to the
large uncertainty, it is not possible to assess to what degree this trend reflect
the real conditions. Due to the little number of respondents with boilers and
fireplaces, the uncertainty is even larger for those technologies, it is not possi-
ble to deduce a trend, and the appliance numbers is not trustworthy either.
The outcome of the 2015-survey is assumed to have less uncertainty due to
the larger number of respondents, and the number of appliances are assumed
to be in the right order of magnitude.

 17
a)

 b)

 Figure 3.1 Number of appliances based on the biennial surveys on the residential wood
 consumption for a) stoves and b) fireplaces and boilers.

 3.1.2 EPA projects on small wood burning appliances
 A number of projects focussing on small wood burning appliances have been
 published by the Danish EPA. Miljøprojekt 1021 (Palmgren et al., 2005) was
 established due to an increasing number of wood stoves in Denmark, which
 gave rise to an increasing number of enquiries from the public regarding ob-
 noxious smell. The emission calculations in the study were based on an esti-
 mate by the Technological Institute (TI) of 300 000 wood stoves and 90 000
 wood boilers (hereof 25 000 pellet boilers). This is the lowest number of stoves
 identified in the literature study, but in contrast to other studies, the number
 only include stoves used to a degree that they contribute significantly to the
 heating of the building. In contrast, Palmgren et al. (2005) estimate the highest
 number of boilers.

 In Miljøprojekt 1164 (Illerup et al., 2007), the numbers of wood burning appli-
 ances were updated based on two telephone surveys focusing on wood con-
 sumption in small wood burning appliances (Nikolaisen, 2005; Evald, 2006).
 The appliances are available by area type (urban, rural, holiday) and by tech-
 nology (old stove, new stove, modern stove, old boiler, new boiler, pellet
 boiler, other boilers).

18
The EPA published the results from a study of VOC emissions from product
use and households in 2009 (Schleicher et al., 2009). The numbers of wood
burning appliances were based on the 2007-survey, which was not yet pub-
lished at that time. It was found that the trend from 2005 (based on Illerup et
al. (2007) to 2007, showing a massive increase, was unrealistic. It was con-
cluded that the survey methodology with telephone interviews was not ap-
propriate, and the fact that respondents were selected only among fixed line
phones was questioned.

Iversen et al. (2010) provided updated fuel consumption data and a survey of
emission factors for wood stoves and boilers. Number of appliances are based
on the 2005-survey (Evald, 2006) and the distribution by technology was pro-
jected for the years 2006-2008 based on sales statistics from the industry and
information from the chimneysweepers. The total number of appliances was
kept constant at the 2005 level. An exchange rate of 5-8 % per year, corre-
sponding 25 000-40 000 appliances, was estimated, and the number of discon-
tinues and new installations was assumed to be about equal.

3.2 Data analysis

3.2.1 BBR data
Three data sets from the Building and Dwelling Register (BBR) is available for
the analysis, covering data withdrawals from 2005, 2010 and 2017 respec-
tively. The BBR data include information of primary heating source, heating
fuel, and supplementary heating source (see Table 3.2, 3.3 and 3.4). Wood
stoves and wood boilers are identified in the BBR based on the combination
of the three heating categories. It is only possible to register one value for each
category for each address in the BBR. This cause an underestimation of appli-
ances in case more appliances occur on a single address. The fact that the
house owners are responsible for updating the heating information the BBR
increase the uncertainty of the data set, as this is often neglected. Case studies
have shown large differences between the occurrence of wood stoves and the
registration in the BBR.

Table 3.2 Primary heating categories in the BBR and appliance category.
ID Primary heating category Appliance category
1 District heating
2 Boiler, one unit Boiler
3 Stove Stove
5 Heat pump
6 Boiler, two unit Boiler
7 Electricity appliance
8 Gas appliance
9 None

 19
Table 3.3 Fuel categories in the BBR and appliance category.
 ID Fuel Appliance category
 1 Electricity
 2 Town gas
 3 Liquid
 4 Solid Wood stove
 6 Straw
 7 Natural gas
 9 Other

 Table 3.4 Supplementary heating categories in the BBR and appliance category.
 ID Supplementary heating Appliance category
 1 Heat pump
 2 Stove, solid fuel Wood stove
 3 Stove, liquid fuel
 4 Solar
 5 Fireplace Fireplace
 6 Gas
 7 Electricity
 10 Biogas
 80 Other
 90 None

 The analysis of the three BBR data sets follow the same methodology and the
 same categorisation of appliances is used. The appliances in BBR are catego-
 rised based on primary heating, fuel and supplementary heating. A descrip-
 tion of the methodology is included in Nielsen & Plejdrup (2018). Table 3.5
 and Figure 3.2 list the number of appliances identified in the analysis for
 stoves, fireplaces and boilers. The category “stoves” cover old, new, modern
 and eco-label stoves in the inventory and the category “fireplaces” covers
 “other stoves” in the inventory. The number of appliances identified in the
 BBR data sets increase by 42 % from 2005 to 2010 and by 15 % from 2010 to
 2017. As mentioned, the BBR data is subject to large uncertainties regarding
 the heating information. Registration is supposed to be more correct and com-
 prehensive for new buildings, while updates of information for existing build-
 ings, e.g. when a stove is installed or removed, might more often be neglected.
 Generally, the number of appliances are known to be underestimated in the
 BBR register, which is best shown with a comparison between the BBR data
 and data provided by the Danish chimneysweepers. For 2017 this comparison
 showed that the number of stoves was underestimated by around 37 % in the
 BBR (see Table 3.5 and 3.6), when taking into consideration, that the SLF data
 are missing for smaller areas and adjust by adding data from the BBR for these
 areas (this is further described in the chapter “SFL data”). SFL data are only
 available for 2017 and following it is not possible to assess the trend showing
 a 63% increase in number of stoves from 2005 to 2017 in the BBR data, based
 on SFL data.

 Table 3.5 Number of appliances identified in the BBR data sets.
 Data set Stoves Fireplaces Boilers
 BBR2005 258 958 16 419 35 723
 BBR2010 366 700 24 329 52 034
 BBR2017 420 893 28 334 83 813

20
Figure 3.2 Number of appliances identified in the BBR data sets.

3.2.2 SFL data
SFL2017
The Danish chimneysweeper association (SFL) has provided data including
number and location of small wood burning appliances. The data set has been
processed and analysed by DCE, as described in Nielsen & Plejdrup (2018).
The SFL data are considered the most accurate data set available even though
the coverage is not complete. SLF data are missing for a few areas (~10 % of
the land area), and to complete the coverage, data from the BBR2017 data set
have been supplemented for these areas. The supplement data make up
around 5 % of the total number of appliances (see Table 3.6). The data set
made up of the SFL2017 data and the supplement data from the BBR2017 is in
the following referred to as SFL2017sup.

Table 3.6 Number of appliances identified in the SFL2017 data sets.
Data set Stoves Other appliances Boilers
SFL2017 635 141 46 283 62 457
Supplement from BBR2017 34 205 2 020 5 614
SFL2017sup 669 346 48 303 68 071

The BBR data are subject to uncertainties regarding number of stoves and boil-
ers, and this is transferred to the SFL2017sup when BBR is used as supple-
ment. To evaluate this approach, the number of appliances used for supple-
ment is compared to estimates from the chimneysweeper association on the
number of appliances serviced by chimneysweepers, who are not member of
the association. A rough estimate is that the around 25 000 stoves are serviced
by chimneysweepers, who are part of the association “Frie Fejere”, and fur-
ther an unknown number of stoves are serviced by chimneysweepers, who
are not member of neither of these two associations. The latter include e.g.
Brønderslev, but also part of Billund/Gl. Ølgod, Fyn, Lolland, Nordjylland,
and Syd-/Sønderjylland The number of stoves in Brønderslev, according to
the BBR2017, is 2 594. The total number of stoves from BBR2017 used as sup-
plement to the SFL2017 is 36 225, which corresponds well to the estimate of
stoves missing in the SFL2017 data (see Table 3.7).

 21
Table 3.7 Number of stoves not included in the SFL2017.
 Number of stoves
 Supplement from BBR2017 to SFL2017 for Denmark* 36 225

 Frie fejere 25 000
 Other chimneysweepers** ?
 Supplement from BBR2017 to SFL2017 for Brønderslev 2 594
 SUM 27 594
 *Stoves and Other appliances.
 **Not member of the chimneysweeper association or Frie Fejere, covering e.g.
 Brønderslev.

 SFL2006
 A data withdrawal from the SFL data in 2006 is available for a case area cov-
 ering Ballerup, Herlev, Skævinge, Stenløse and Værløse. This data set have
 been analysed and compared to the SFL2017 to assess if a trend for the number
 of appliances could be identified, and if it could support assumptions of the
 share of new installations and discontinues.

 Both the SFL2006 and the SFL2017 data are available on address level includ-
 ing postal code, road name and house number. The addresses in SFL2006
 were joined to the corrected road names and postal codes from the analysis of
 the SFL2017 data, to increase the number of registrations, which could be
 joined. Analysis of the two data sets on address level was associated with far
 too many assumptions and uncertainties to make a useful outcome. It was not
 possible to distinguish if a change was due to installation/discontinue of a
 stove, or if it was a result of mix up of addresses. Further, too large a share of
 the addresses could not be joined between the two data sets. The methodology
 was changed to compare the number of stoves by road, but this introduced
 uncertainty, as many roads extended the limit of the SFL2006 coverage, and
 thereby a large number of houses was included in the count for SFL2017 data,
 but was not part of the SFL2006 data set.

 Another methodology was tested, comparing the total number of appliances
 per postal code. This methodology was not applicable for most postal codes,
 as the case area did not follow the postal code areas. The output of this anal-
 ysis is shown in Table 3.8.

 It was decided to exclude the SFL2006 data set due to the large uncertainties
 in the comparisons, and because the case area is very small compared to na-
 tional level. Further, the representativeness of the case area and the uncer-
 tainty related to an upscale of the trend to national level is unknown.

22
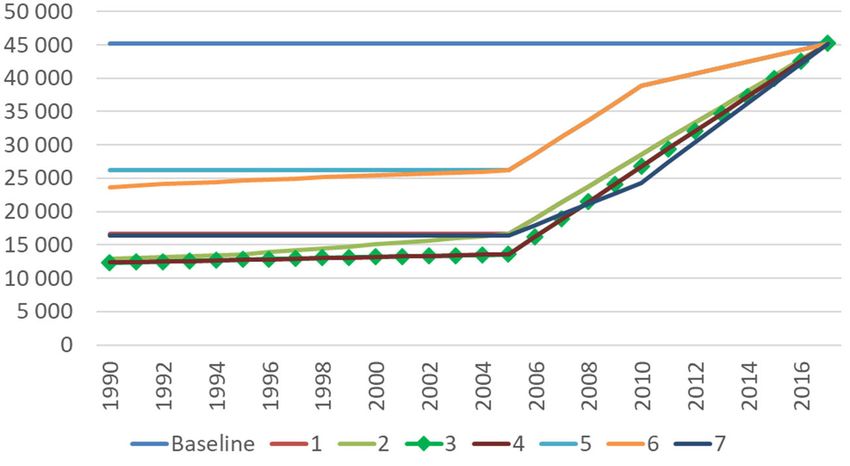
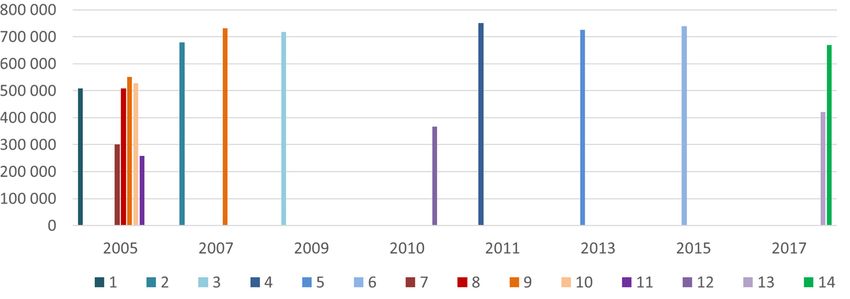
Table 3.8 Number of stoves and percentage increase from the SFL2006 to the SFL2017
data set.
 Stoves
Postal code
 SFL2006 SFL2017 Increase
0 2 34 1600%
2730 1 794 1 983 11%
2740 1 063 1 499 41%
2750 1 660 2 423 46%
2760 338 367 9%
2880 0 1 547 ---
3300 0 4 293 ---
3310 27 1 361 4941%
3320 765 748 -2%
3330 197 196 -1%
3400 11 4 009 36345%
3500 1 951 2 447 25%
3520 17 1 764 10276%
3540 2 740 36900%
3550 381 1 530 302%
3600 27 2 128 7781%
3660 1 683 1 692 1%
3670 300 458 53%
SUM 10 218 29 219 186%

3.2.3 Statistics Denmark
Figures from Statistics Denmark regarding import/export of small combus-
tion appliances of iron and steel for solid fuels (statistical figure: KN8M; com-
modity category: 73218300), residential heating installations (statistical figure
BOL105; heating: Central heating/without oil or nature gas; Stoves, other),
have been assessed, but neither were useful to prepare a time series for wood
burning appliances. No other statistical figures were identified, which in-
cluded information that could be linked to production, sales, import/export
or use of small wood burning appliances.

3.3 Data selection
The numbers of stoves, other appliances and boilers from the literature study
and the data analysis are presented in Table 3.9, 3.10 and 3.11 and in Figure
3.3, 3.4 and 3.5. The evaluation of the data and selection of the input to the
updated inventory model is included in the following chapters for stoves,
other appliances and boilers, respectively.

 23
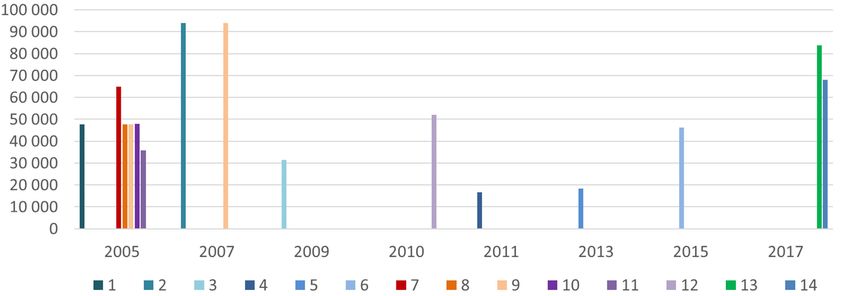
Table 3.9 Number of stoves identified in the literature study and the data analysis.
ID Reference 2005 2006 2007 2008 2009 2010 2011 2012 2013 2014 2015 2016 2017
1 2005-survey 507 944
2 2007-survey 679 292
3 2009-survey 717 730
4 2011-survey 750 229
5 2013-survey 725 283
6 2015-survey 738 600
7 Palmgren et al., 2005 300 000
8 Illerup et al., 2007 508 683
9 Schleicher et al., 2009 550 915 732 194
10 Iversen et al., 2010 527 394
11 BBR2005 258 958
12 BBR2010 366 700
13 BBR2017 420 893
14 SFL2017sup 669 346

Figure 3.3 Number of stoves identified in the literature study and the data analysis.

24
Table 3.10 Number of other appliances identified in the literature study and the data analysis.
ID Reference 2005 2006 2007 2008 2009 2010 2011 2012 2013 2014 2015 2016 2017
1 2005-survey 39 971
2 2007-survey 49 900
3 2009-survey 76 622
4 2011-survey 58 174
5 2013-survey 72 794
6 2015-survey 49 743
7 Palmgren et al., 2005 no data
8 Illerup et al., 2007 13 597
9 Schleicher et al., 2009 no data no data
10 Iversen et al., 2010 16 664
11 BBR2005 16 419
12 BBR2010 24 329
13 BBR2017 28 334
14 SFL2017sup * 48 303
*including 2 832 masonry.

Figure 3.4 Number of other appliances identified in the literature study and the data analysis.

 25
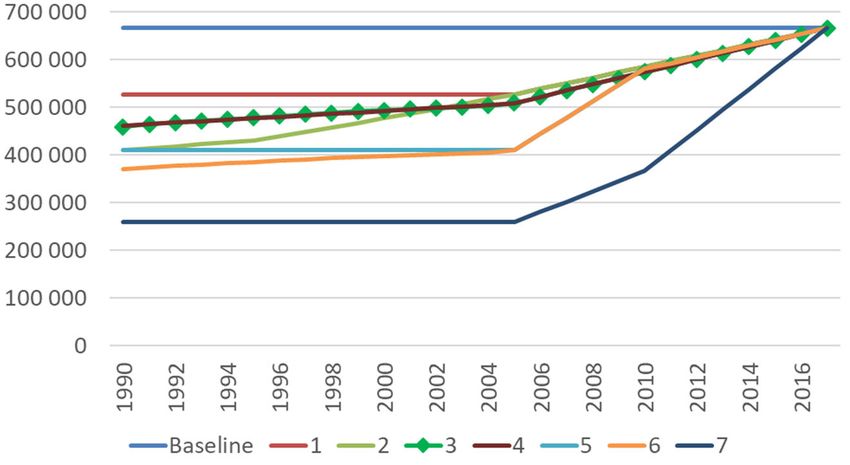
Table 3.11 Number of boilers identified in the literature study and the data analysis.
ID Reference 2005 2006 2007 2008 2009 2010 2011 2012 2013 2014 2015 2016 2017
1 2005-survey 47 753
2 2007-survey 93 980
3 2009-survey 31 429
4 2011-survey 16 621
5 2013-survey 18 270
6 2015-survey 46 241
7 Palmgren et al., 2005 65 000
8 Illerup et al., 2007 47 753
9 Schleicher et al., 2009 47 753 93 980
10 Iversen et al., 2010 47 945
11 BBR2005 35 723
12 BBR2010 52 034
13 BBR2017 83 813
14 SFL2017sup 68 071

Figure 3.5 Number of boilers identified in the literature study and the data analysis.

26
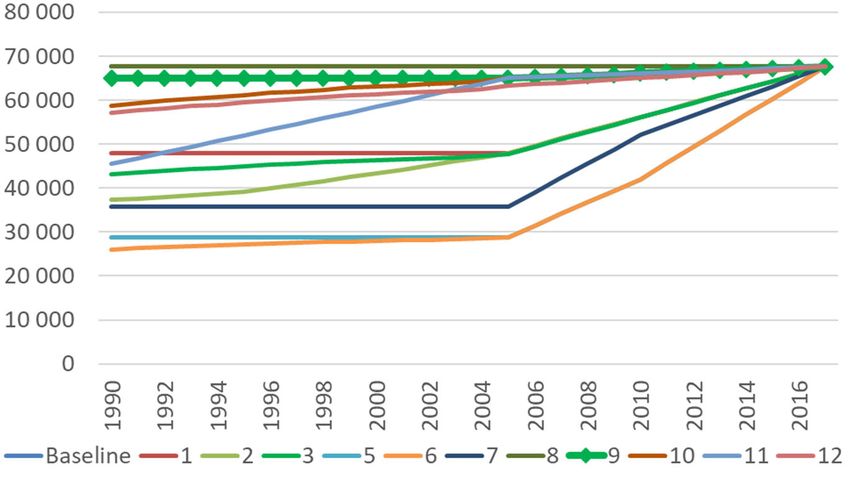
3.3.1 Stoves
To create a time series for the number of stoves, six scenarios have been set up
based on the data and information described in the previous chapters. The
scenarios are described in the following.

The data set from the chimneysweepers supplemented with data from the
BBR2017 (SFL2017sup) is considered the most accurate data set for 2017, and
the number of stoves based on this analysis is included in all scenarios. The
number might be subject to a minor underestimation due to the underestima-
tion in the BBR data used as supplement. The uncertainty of the BBR is not
systematic and it has been decided not to add any correction of the BBR, as
this might lead to introduction of further uncertainty by assuming that the
uncertainty is the same for all areas in Denmark. Further, overestimation
might occur as the chimneysweeper register include all appliances regardless
if it is used or not, as, by law, all appliances connected to a chimney must be
serviced by a chimneysweeper.

The basic scenario corresponds to the previous methodology, where the num-
ber of stoves is fixed for the entire time series. The number of stoves have been
updated according to the SFL2017 data supplemented with BBR2017 data for
the missing areas (SFL2017sup).

The surveys for 2007, 2009, 2011, 2013 and 2015 all exceed the number of
stoves in the SFL data, and due to the large uncertainty of the survey results,
because of the upscaling from a rather low number of respondents to national
level, these have been deselected for use in the scenarios. The result from the
2005-survey is expected to have even larger uncertainty due to the lower num-
ber of respondents, but is even though found to be among the best estimates
available for 2005. Illerup et al. (2007) made an updated emission inventory
based on the 2005-survey and other information, and the number of stoves for
2005 have been used in two scenarios (scenario 3 and 4). The number of stoves
from Iversen et al. (2010), also based on the 2005-survey, has been used for
2005 in two scenarios (scenario 1 and 2).

The number of stoves identified in the BBR data sets are the lowest number
identified for both 2005, 2010 and 2017. One scenario is set up using the num-
ber of stoves from the BBR for 2005 and 2010 (scenario 7). The BBR data are
subject to large uncertainties regarding the number of stoves, which is obvi-
ous from the comparison with the SFL2017 data. The changes between the
three BBR data sets might however reflect the actual trend. Two scenarios
have been set up, back scaling the number of stoves in SFL2017sup, based on
the percentage change between the years in the BBR. Both scenarios show an
unexpectedly steep increase from 2005 to 2017 (scenario 5 and 6).

No information of the trend from 1990 to 2005 have been found. The produc-
tion of wood stoves in Denmark started around 1950 and a linear trend from
1950 (zero stoves) to 2005 (number of stoves based on Illerup et al., 2007) have
been applied in one scenario (scenario 4).

Another approach for estimating the number of stoves before 2005 is applied
in two scenarios (scenario 3 and 6). The number of stoves have been back
scaled according to the change in number of households in Denmark from
figures published by Statistics Denmark. This methodology result in an in-
crease of 24 % from 1980 to 2005.

 27
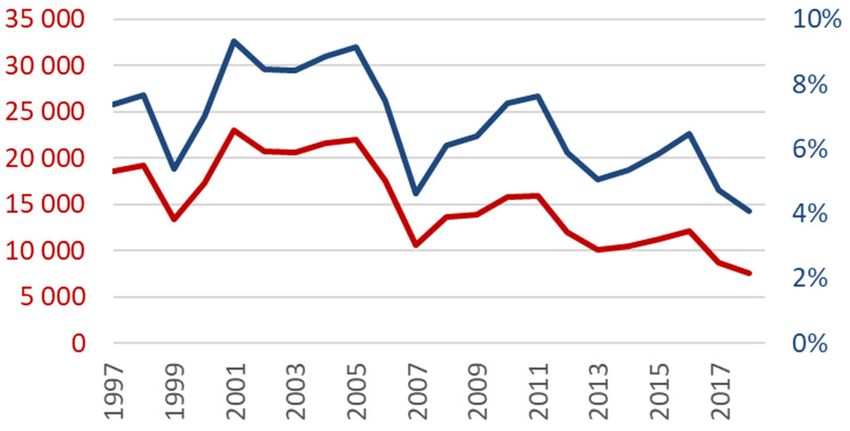
Sales statistics have been provided by DAPO (Foreningen af Danske Leveran-
 dører af Pejse og Brændeovne) for the years 1997-2018. Figure 3.6 show the
 sales numbers and the share of the total number of stoves in scenario 3. On
 average, the sale correspond to 4 % the total number of stoves. An unknown
 part of the sale is replacement of older stoves and following, the total number
 of stoves do not increase. Assuming that the sale is evenly distributed between
 replacement and new installation, the annual growth rate is around 2 %. A
 scenario has been set up based on the assumption of an annual growth rate of
 2 % for the years 1995-2005, and 1 % for the years 1980-1995 (scenario 2).

 Figure 3.6 Sales statistics (number) including stoves and fireplace inserts provided by
 DAPO (red line), and share (%) of total number of stoves (scenario 3) (blue line).

 The scenarios are listed in Table 3.12 with references to data and description
 of the assumptions.

28
Table 3.12 Scenarios for stoves.
Scenario 1990-2000 2000-2005 2005 2005-2010 2010 2010-2017 2017 2017-2050
 Constant (2017 value) Constant (2017 value) Constant (2017 value) Constant (2017 value) Constant (2017 value) Constant (2017 value) SFL2017sup Constant (2017
Basic value)
 Constant (2005 value) Constant (2005 value) Iversen et al., 2010 Linear interpolation Linear interpolation Linear interpolation SFL2017sup Constant (2017
1 2005-2017 2005-2017 2005-2017 value)
 + 1 % per year + 2 % per year Iversen et al., 2010 Linear interpolation Linear interpolation Linear interpolation SFL2017sup Constant (2017
2 2005-2017 2005-2017 2005-2017 value)
 Growth rate cf. number Growth rate cf. number Illerup et al., 2007 Linear interpolation Linear interpolation Linear interpolation SFL2017sup Constant (2017
3 of households of households 2005-2017 2005-2017 2005-2017 value)
 Linear interpolation Linear interpolation Illerup et al., 2007 Linear interpolation Linear interpolation Linear interpolation SFL2017sup Constant (2017
 from 1950 (zero) to from 1950 (zero) to 2005-2017 2005-2017 2005-2017 value)
 2005 (Illerup et al., 2005 (Illerup et al.,
4 2007) 2007)
 Constant (2005 value) Constant (2005 value) Back scale of 2017 Linear interpolation Linear interpolation Linear interpolation SFL2017sup Constant (2017
 value cf. growth rates 2005-2017 2005-2017 2005-2017 value)
 from BBR2005 to
5 BBR2017
 Growth rate cf. number Growth rate cf. number Back scale of 2010 Linear interpolation Back scale of 2017 Linear interpolation SFL2017sup Constant (2017
 of households of households value cf. growth rates 2005-2010 value cf. growth rates 2010-2017 value)
 from BBR2005 to from BBR2010 to
6 BBR2010 BBR2017
 Constant (2005 value) Constant (2005 value) BBR2005 Linear interpolation BBR2010 Linear interpolation SFL2017sup Constant (2017
7 2005-2010 2010-2017 value)

 29
The numbers of stoves for the scenarios are shown in Figure 3.7.

 Figure 3.7 Number of stoves in the scenarios.

 Evaluation of the scenarios regarding trends and number of stoves, have re-
 sulted in selection of scenario 3 as the best scenario. It is assumed that Illerup
 et al. (2007) is the best reference for 2005 and that SFL2017sup is the best ref-
 erence for 2017. The trends for 2005-2010 and 2010-2017 based on BBR data is
 not supported by other data sources and is not included in the inventory
 model due to the large uncertainties for heating information in BBR. The trend
 before 2005 follow the trend for the number of households, as this is found to
 be the most appropriate assumption. The trend is increasing as expected but
 less dramatic as the result of a linear interpolation back to zero in 1950. No
 information is available that support a linear trend for 1950-2005, or if the
 trend should be steepest in early or later years. Using the household numbers
 as proxy is found more reasonable than using the growth rate based on sales
 statistics and assumption of the distribution between new installations and
 replacements (see Table 3.13 and Figure 3.8).

 Table 3.13 Number of stoves for selected years as applied in the emission inventory
 model.
 Year Number of stoves
 1990 459 140
 1995 478 459
 2000 493 676
 2005 508 683
 2010 575 626
 2015 642 569
 2017 669 346
 2030 669 346

30
Figure 3.8 Number of stoves applied in the model.

The final decision has been to use the number of appliances in 2017 based on
the data from the chimneysweeper association supplemented by data from
the building and dwelling register for the areas not covered by the chim-
neysweeper data. The time series are prepared based on assumption of ex-
pected lifetime for appliances and replacement rates, as described in Chapter
2.4.

3.3.2 Other appliances
The same methodology and background data has been used to analyse the
time series for the number of other appliances as for stoves. The same scenar-
ios have been set up as for stoves. The scenarios are listed in Table 3.12 with
references to data and description of the assumptions. The category ’other ap-
pliances’ covers a number of different appliances, e.g. open fireplaces, ma-
sonry, pizza ovens, sauna ovens and cooking stoves. Open fireplaces and sim-
ilar is the most common, while most other appliances are rather rare. Due to
the large differences of the appliances in this category, it is divided into two
categories in the inventory covering high and low emission appliances; Open
fireplaces and similar, and Masonry heat accumulating stoves and similar.

The uncertainty for SFL2017sup is assumed to be small, and be the best refer-
ence for 2017. As the number of other appliances is far less that the number of
stoves, the uncertainty of the results from the surveys is much larger for this
category. The large uncertainty spread to the projects included in the litera-
ture study, which build on the survey data, here among Illerup et al. (2007),
which therefore is not used to generate a time series for other stoves. The num-
bers of other appliances for the scenarios are shown in Figure 3.9.

 31
Figure 3.9 Number of other appliances in the scenarios.

 Other appliance identified in the BBR data sets include registrations of fire-
 places as supplementary heating. Information of supplementary heating is as-
 sumed to be subject to large uncertainties in the BBR, as house owners are
 responsible for updating the information. First registrations for new buildings
 might be more correct than for old households, where updates might have
 been neglected. Further, there might be more focus on updating primary than
 supplementary heating information. Fireplaces are more frequent as supple-
 mentary heating and in old buildings than as primary heating and in new
 buildings. Following, the number could very well be overestimated in the BBR
 register.

 Missing updates when fireplaces are discarded or when fireplace inserts have
 been installed contribute to an overestimation, while neglecting registrations
 of fireplaces contribute to an underestimation. The BBR only allow registra-
 tion of one primary and one supplementary heating installation, leading to
 missing registrations if more than one supplementary heating installation oc-
 cur. The trends for 2005-2010 and 2010-2017 based on BBR data is not sup-
 ported by other data sources and is not included in the inventory model due
 to the large uncertainties for heating information in BBR. The trend before
 2005 are not supposed to follow the trend for the number of households as
 assumed for stoves. Due to the small number of other stoves and the large
 uncertainty of the analysed data, it is decided to apply a constant number in
 the model, based on SFL2017sup (45 471 high emission appliances, see Table
 3.14).

 Masonry is covered by a separate category (Masonry heat accumulating
 stoves and similar) as the emission factors are much different compared to
 open fireplaces etc. The 2011-survey and the 2013-survey mention 3 500-5 000
 masonry and 5 000 masonry, respectively. The 2015-survey gives an estimate
 of 2 657 masonry, and the number in SFL2017sup is 2 832. Due to the few data
 available and no information for the prior years, it has been decided to use a
 constant number of 3 000 low emission appliances for the entire time series
 (see Table 3.14).

 The emission inventory model has been updated to use the number of other
 stoves based on the SFL2017sup data set, taking into account the results from
 the surveys for low emission appliances. The number of high and low emis-
 sion appliances applied in the model is listed in Table 3.14.

32
Table 3.14 Number of other appliances applied in the emission inventory model.
Year Open fireplaces and similar Masonry heat accumulating stoves and similar
All years 45 471 3 000

3.3.3 Boilers
To create a time series for the number of boilers, 12 scenarios have been set up
based on the data and information described in the previous chapters. The
scenarios Basic, 1-3 and 5-7 are similar to the scenarios for stoves. The scenar-
ios are listed in Table 3.15 with references to data and description of the as-
sumptions, and are described in the following.

The data set from the chimneysweepers supplemented with data from the
BBR2017 (SFL2017sup) is considered the most accurate data set for 2017, and
the number of boilers based on this analysis is included in all scenarios. The
number might be subject to overestimation due to the overestimation in the
BBR data used as supplement. The uncertainty of the BBR is not systematic
and it has been decided not to add any correction of the BBR, as this might
lead to introduction of further uncertainty by assuming that the uncertainty
is the same for all areas in Denmark. Further, overestimation might occur as
the chimneysweeper register include all appliances regardless of whether it is
used or not, as, by law, all appliances connected to a chimney must be serviced
by a chimneysweeper.

The basic scenario corresponds to the previous methodology, where the num-
ber of boilers is fixed for the entire time series. The number of boilers have
been updated according to the SFL2017sup data (68 071 wood boilers, see Ta-
ble 3.16).

The number of boilers estimated in the surveys for 2007, 2009, 2011, 2013 and
2015 show large variation and no trend can be derived from the data (see Fig-
ure 3.10). The uncertainty is expected to be very large due to the few respond-
ents with boilers, and the following upscaling to national level. Illerup et al.
(2007) made an updated emission inventory based on the 2005-survey and
other information, and the number of boilers for 2005 have been used in one
scenario (scenario 3). The number of boilers from Iversen et al. (2010), also
based on the 2005-survey, has been used for 2005 in two scenarios (scenario 1
and 2).

Figure 3.10 Number of boilers in the surveys.

 33
You can also read