Variable coastal hypoxia exposure and drivers across the southern California Current - Nature
←
→
Page content transcription
If your browser does not render page correctly, please read the page content below
www.nature.com/scientificreports
OPEN Variable coastal hypoxia exposure
and drivers across the southern
California Current
Natalie H. N. Low1,2*, Fiorenza Micheli1,3, Juan Domingo Aguilar4, Daniel Romero Arce5,
Charles A. Boch6, Juan Carlos Bonilla7, Miguel Ángel Bracamontes8, Giulio De Leo1,
Eduardo Diaz9, Eduardo Enríquez10, Arturo Hernandez9, Ramón Martinez11,
Ramon Mendoza12, Claudia Miranda13, Stephen Monismith14, Mario Ramade15,
Laura Rogers‑Bennett16,17, Alfonso Romero9, Carmina Salinas18, Alexandra E. Smith1,19,
Jorge Torre9, Gustavo Villavicencio20 & C. Brock Woodson21
Declining oxygen is one of the most drastic changes in the ocean, and this trend is expected to
worsen under future climate change scenarios. Spatial variability in dissolved oxygen dynamics
and hypoxia exposures can drive differences in vulnerabilities of coastal ecosystems and resources,
but documentation of variability at regional scales is rare in open-coast systems. Using a regional
collaborative network of dissolved oxygen and temperature sensors maintained by scientists and
fishing cooperatives from California, USA, and Baja California, Mexico, we characterize spatial
and temporal variability in dissolved oxygen and seawater temperature dynamics in kelp forest
ecosystems across 13° of latitude in the productive California Current upwelling system. We find
distinct latitudinal patterns of hypoxia exposure and evidence for upwelling and respiration as regional
drivers of oxygen dynamics, as well as more localized effects. This regional and small-scale spatial
variability in dissolved oxygen dynamics supports the use of adaptive management at local scales, and
highlights the value of collaborative, large-scale coastal monitoring networks for informing effective
adaptation strategies for coastal communities and fisheries in a changing climate.
Ocean deoxygenation is currently one of the most drastic changes occurring in marine ecosystems1,2. Coastal
ecosystems are particularly susceptible, with declines in oxygen level occurring more rapidly along the coast
compared to open ocean ecosystems3,4. Further, the intensity and frequency of deoxygenation is expected to
worsen with climate change over t ime5–9. Oxygen levels in some coastal ecosystems may be nearing thresholds
below which fisheries, biodiversity and ecosystems may c ollapse1 negatively impacting marine species, popula-
tions, ecosystems, and the services they provide humans. In coastal marine ecosystems, exposure to hypoxia
1
Hopkins Marine Station, Stanford University, Pacific Grove, CA, USA. 2Monterey Bay Aquarium Research
Institute, Moss Landing, CA, USA. 3Stanford Center for Ocean Solutions, Stanford University, Pacific Grove, CA,
USA. 4Sociedad Cooperativa de Producción Pesquera Progreso, La Bocana, Baja California Sur, México. 5Sociedad
Cooperativa de Producción Pesquera Pescadores Nacionales de Abulón, Isla Cedros, Baja California Sur,
México. 6Southwest Fisheries Science Center, National Oceanic and Atmospheric Administration, San Diego,
CA, USA. 7Sociedad Cooperativa de Producción Pesquera La Purísima, Bahía Tortugas, Baja California Sur,
México. 8Sociedad Cooperativa de Producción Pesquera Ensenada, El Rosario, Baja California, México. 9Comunidad
y Biodiversidad, La Paz, Baja California Sur, México. 10Sociedad Cooperativa de Producción Pesquera Punta
Abreojos, Punta Abreojos, Baja California Sur, México. 11Sociedad Cooperativa de Producción Pesquera Buzos
y Pescadores de la Baja California, Isla Natividad, Baja California Sur, México. 12Sociedad Cooperativa de
Producción Pesquera Bahía Tortugas, Bahía Tortugas, Baja California Sur, México. 13Sociedad Cooperativa de
Producción Pesquera California San Ignacio, Bahía Asunción, Baja California Sur, México. 14Department of Civil and
Environmental Engineering, Stanford University, Stanford, CA 94305, USA. 15Federación Regional de Sociedades
Cooperativas de la Industria Pesquera Baja California, Ensenada, Baja California, México. 16Coastal Marine Science
Institute, Karen C. Drayer Wildlife Health Center, University of California Davis, Davis, CA, USA. 17California
Department of Fish and Wildlife, Bodega Marine Laboratory, Bodega Bay, CA, USA. 18Sociedad Cooperativa de
Producción Pesquera Emancipación, Bahía Tortugas, Baja California Sur, México. 19Scoot Science, Santa Cruz,
CA, USA. 20Sociedad Cooperativa de Producción Pesquera Leyes de Reforma, Bahía Asunción, Baja California Sur,
México. 21COBIA Lab, University of Georgia, Athens, GA, USA. *email: nlow@mbari.org
Scientific Reports | (2021) 11:10929 | https://doi.org/10.1038/s41598-021-89928-4 1
Vol.:(0123456789)www.nature.com/scientificreports/
(commonly defined as < 2 mg/L10–13, can cause direct mortality14,15 or severely impact feeding behavior, move-
ment, growth, and reproductive processes, and reduce habitat quality for marine species13,16–19. These impacts can
in turn scale up to impacts on populations, community composition, and fisheries2,10,15,20. Many of these impacts
of hypoxia are exacerbated by interactions with other co-occurring stressors. In particular, warm temperatures
can increase organisms’ vulnerability to hypoxia by enhancing their metabolic demand for oxygen21–23. Hypoxia
can also increase vulnerability to the impacts of fishing, as when organisms fleeing from hypoxia aggregate at
edges of low oxygen waters, and are targeted by fi shers24.
Spatial and temporal patterns of variability in coastal hypoxia can influence their severity and impact on
coastal ecosystems. Larger-scale seasonal drivers of hypoxia such as weather-driven nutrient loading, stratifica-
tion, water temperatures, and upwelling patterns6,10 can interact with finer-scale transport processes such as
tidal flushing and internal bores to generate complex patterns of temporal variability in dissolved oxygen25,26.
These processes can also interact with the physical structure of nearshore habitats to produce local-scale spatial
differences in the severity and temporal patterns of exposure to h ypoxia27–29. For example, in the Monterey Bay
region of California, USA, regional wind-driven upwelling transports cold, hypoxic deep water up onto the
shelf, local internal bores move this hypoxia water into the shallow nearshore in distinct pulses, and where these
internal bores surge and recede along local kelp forest rocky reef topography, hypoxic water can pool in benthic
depressions to generate highly localized (< 10 m) spatial mosaics of hypoxic e xposure29,30. Spatial variation in
the severity and patterns of exposure to physiological stressors can provide natural refuges for organisms from
large-scale climate impacts. Mobile organisms may be able to respond to spatiotemporal shifts in oxygen con-
ditions by moving to escape hypoxia or even take advantage of periodic hypoxia to increase predation on less
mobile, and therefore more vulnerable p rey31 whereas sessile or sedentary organisms often benefit most from
persistent refuges32,33. Identifying and harnessing such refuges, e.g., for the siting of seasonal or permanent fish-
ing protections and restoration projects, has been suggested as a promising strategy for coastal communities and
management agencies to implement climate change adaptation and conservation34,35. However, regional-scale
analyses of dissolved oxygen dynamics are still uncommon, particularly in open-coast upwelling systems, and
cross-shelf data on oxygen dynamics are not always particularly useful for the communities and marine resource
managers whose interests lie mostly in shallow nearshore habitats. Continuous, high-resolution observations
of dissolved oxygen conditions in coastal upwelling ecosystems, at depths of greatest interest to coastal manag-
ers and resource users, remain lacking at regional scales. Such data are available for the first time in the highly
productive California Current upwelling region, thanks to a collaborative, participatory monitoring network
of academic, government, and NGO scientists, as well as fishing cooperatives from California, USA, and Baja
California, Mexico. Here we analyse a year-long dataset of dissolved oxygen and temperature data from kelp
forest and rocky reef ecosystems from this regional monitoring network. We document spatial and temporal
exposures to hypoxia at multiple locations, as well as substantial spatial heterogeneity and seasonal variability in
dissolved oxygen and temperature dynamics. We highlight potential drivers and consequences of these spatial
differences, opportunities for local adaptation, and the value of collaborative regional monitoring networks in
the face of escalating exposure to environmental stressors.
Materials and methods
We analysed a year of time series data (October 2017–September 2018) for seawater temperature (°C) and dis-
solved oxygen (DO, mg/L) from the regional network of oceanographic sensors located at 18 sites in kelp forest/
rocky reef ecosystems, spanning 13° of latitude from northern California, USA, to central Baja California, Mexico
(Fig. 1, Table 1). Most of these sensors were sited, deployed, and maintained in partnership with local fishing
cooperatives from the Federación Regional de Sociedades Cooperativas de la Industria Pesquera (FEDECOOP),
the civil association Comunidad y Biodiversidad in Baja California, and the California Department of Fish and
Wildlife. Deployment sites were all selected on the basis of being known suitable habitat for ecologically and
economically important benthic invertebrate species, particularly red, green, and pink abalone (Haliotis rufescens,
H. fulgens, and H. corrugata), which have previously suffered widespread mortality from hypoxic exposures
atividad27,36, La Bocana, Micheli et al., unpublished data). Sensors were located at
at sites in this region (Isla N
depths of 6 to 15 m (Table 1), falling within the overlapping depth ranges of these abalone species (H. rufescens:
low intertidal to 40 m; H. fulgens: low intertidal to 18 m, H. corrugata: 6–30 m37. Other co-occurring valu-
able benthic fisheries include spiny lobster (Panulirus interruptus), sea urchins (Mesocentrotus franciscanus and
Strongylocentrotus purpuratus), sea cucumber (Parastichopus parvimensis) and turban snails (Megastraea spp.).
For all sites except Monterey, temperature and DO were measured using autonomous sensors (PME Mini-
DOTs and/or Seabird SBE37-ODO, see Table 1) deployed within 1 m of the bottom, within or directly adjacent
to kelp beds. In Baja California and Baja California Sur, sensor locations were selected by local fishing coop-
eratives based on their knowledge of present or past productive abalone fishing habitat. At these sites, sensors
were deployed and maintained by divers from local fishing cooperatives, with the support and participation of
academic and NGO scientists and staff. The Van Damme and San Diego sites correspond to locations where the
California Department of Fish and Wildlife has conducted long-term abalone population monitoring. Sensors at
these two sites were deployed and maintained by scientists and staff from the California Department of Fish and
Wildlife. Sensors at all sites logged measurements at 10-min intervals with the exception of the Van Damme site,
which logged measurements at 1-min intervals. At the Monterey site, temperature and DO were sampled from
seawater drawn through the Monterey Bay Aquarium’s intake pipes, located at 17 m and adjacent to kelp forest
habitat. Measurements were logged at intervals of 5 min using wired probes (GF Signet Resistance Thermometer
for temperature, In Situ RDO Pro-X for DO) that were cleaned and calibrated regularly. More details of this site,
including intake flow rates are available at25. At all other sites, sensors were cleaned and batteries changed at least
once during the 12-month deployment.
Scientific Reports | (2021) 11:10929 | https://doi.org/10.1038/s41598-021-89928-4 2
Vol:.(1234567890)www.nature.com/scientificreports/
Figure 1. Temperature (black line) and dissolved oxygen (blue line) dynamics at 18 coastal sites in the southern
California Current, over the 1-year period between October 2017 and September 2018. The dashed line
represents the 2 mg/L threshold of hypoxia.
Site Name Latitude Longtitude Depth (m) Sensor Type
1-VD Van Damme, CA 39.271833 − 123.79563 10 PME MiniDOT
2-MRY Monterey, CA 36.621 − 121.899 17 GF Signet Resistance Thermometer, In Situ RDO Pro-X
3-SD San Diego, CA 32.81320 − 117.29006 20 PME MiniDOT
4-SPF El Rosario, BC 29.79099 − 115.80957 14 PME MiniDOT
5-PN Punta Norte, BC 28.3532 − 115.19258 9 PME MiniDOT
6-PP Punta Prieta, BCS 27.88691 − 115.18875 14 PME MiniDOT/ Seabird SBE 37
7-MP Morro Prieto, BCS 27.87984 − 115.21378 15 PME MiniDOT/ Seabird SBE 37
8-EUG Punta Eugenia, BCS 27.83632 − 115.07539 10 PME MiniDOT
9-VIZ Bahia Vizcaino, BCS 27.8105 − 114.50412 10.5 PME MiniDOT
10-CB Clam Bay, BCS 27.62015 − 114.84217 6 PME MiniDOT
11-PER Punta Perico, BCS 27.5271 − 114.74084 13 PME MiniDOT
12-CAS Puerto Castro, BCS 27.17093 − 114.42178 11 PME MiniDOT
13-GAV Los Gavilanes, BCS 27.10345 − 114.2965 9 PME MiniDOT
14-PAT Piedra Pato, BCS 27.00639 − 114.04489 14 PME MiniDOT
15-HIP San Hipolito, BCS 26.987267 − 113.97182 7 PME MiniDOT
16-BCN Bocanita, BCS 26.79495 − 113.72841 10 PME MiniDOT
17-RIN Rincon, BCS 26.77482 − 113.69234 11 PME MiniDOT
18-ABR Punta Abreojos, BCS 26.74856 − 113.50941 12 PME MiniDOT
Table 1. Summary of sensor deployment sites.
To maintain identical sampling intervals across all sites, we filtered the time series data from the Van Damme
and Monterey sites to obtain subsets of the data with 10-min intervals between measurements. We used the
temperature and DO time series data to calculate summary statistics to characterize temperature and DO dynam-
ics, as well as hypoxia exposures. We calculated mean and maximum temperature, minimum DO, coefficient
of variation in DO, mean absolute rate of change in DO between adjacent data points, the number of exposures
to hypoxic conditions (defined as an exposure to the widely-used 2 mg/L threshold for h ypoxia10–13 for an hour
or more), the mean duration of these hypoxic events, the mean duration between the end of a hypoxic event
and the start of the next one (“return time”), for each monitored site. We calculated mean temperature and DO
Scientific Reports | (2021) 11:10929 | https://doi.org/10.1038/s41598-021-89928-4 3
Vol.:(0123456789)www.nature.com/scientificreports/
level for each day of the year and plotted these values on a temperature-DO biplot to visualize shifts in seawater
characteristics throughout the year.
For sites that experienced hypoxia, we also took the number of hypoxic events observed for each month of the
study and divided them by the total number of events observed at the site to calculate the proportion of hypoxic
events occurring in each month to investigate potential seasonal patterns. To assess the potential role of upwelling
as a driver of dissolved oxygen dynamics across the year, we calculated monthly correlation coefficients between
temperature and dissolved oxygen at each site. We assessed timescales of variability for temperature and DO by
calculating variance spectra for the time series data. Power spectra were computed using the Welch method with
a Hamming window of 90 days and a 50% overlap. Spectra were then scaled to the variance in DO. Variances
were then integrated across seasonal (0.01–0.05 cycles per day; cpd), synoptic (scales of mesoscale variability and
atmospheric weather patterns, 0.1–0.5 cpd), diurnal (0.75–1.25 cpd), and semidiurnal (1.75–2.25 cpd) period
bands, corresponding to 20–100 day, 2–10 day, ~ 24-h, and ~ 12-h cycles respectively.
Results
We observed broad regional patterns in exposure to coastal hypoxia throughout the study region. Dissolved
oxygen levels fell below the 2 mg/L threshold for hypoxia at all sites southwest of the Punta Eugenia headland on
the Vizcaino peninsula, in Baja California Sur, Mexico (sites 8, 10–18), as well as one site north of this headland,
Punta Norte (Fig. 2a). Severely hypoxic (< 0.05 mg/L) conditions were recorded in the five southernmost sites
(sites 14–18), south of Bahía Asunción. These five sites also experienced the greatest oxygen variability (Fig. 2b),
the highest number of hypoxic exposure events (Fig. 2d), the longest hypoxia exposure durations (Fig. 2e), and
the shortest hypoxia return times of about a day or less, although they did not also experience distinctly faster
rates of change compared to other sites. Among the other sites that experienced hypoxia, mean return times
were on the order of months for Punta Eugenia and Clam Bay, the northernmost sites on the western Vizcaino
peninsula, and 1–2 weeks for Punta Perico, Puerto Castro, and Los Gavilanes, the three sites in the central area
of this peninsula (Fig. 2f). Mean return time was about a week for Punta Norte, the only site that experienced
hypoxia north of the Punta Eugenia boundary.
Despite differences in sensor deployment depths among sites (6–20 m depth; Table 1), we did not see evidence
that these differences impacted our detection of regional patterns of dissolved oxygen dynamics and exposures
to hypoxia. Because exposures to low-oxygen water transported inshore by internal waves may be influenced
by closer proximity to deeper offshore sources, we were concerned that deeper sensors would be more likely
to detect lower dissolved oxygen concentrations as well as instances of h ypoxia34,35,38. However, hypoxic events
were also detected at sites with shallower sensors, and we only found a weak positive correlation between site
sensor depth and the minimum dissolved oxygen recorded at the site ( R2 = 0.21, P = 0.03). We did not find any
correlations between sensor depth and the other dissolved oxygen summary variables (P > 0.27 for all variables).
We also observed broad-scale patterns for seasonality in temperature and dissolved oxygen dynamics. Across
almost all sites, water temperatures cooled between October and May, during the winter months and upwelling
season, and warmed again between June and September (Fig. 1, S1). At most sites, dissolved oxygen concentra-
tions became much more temporally variable starting in the early spring, when dissolved oxygen levels expe-
rienced periodic decreases (Fig. 1). This led to overall decreases in mean values of dissolved oxygen between
spring and summer (Fig. 1, S2). This springtime change was also associated with stronger positive correlations
between water temperature and dissolved oxygen values (Fig. 3). The periodic decreases in dissolved oxygen led
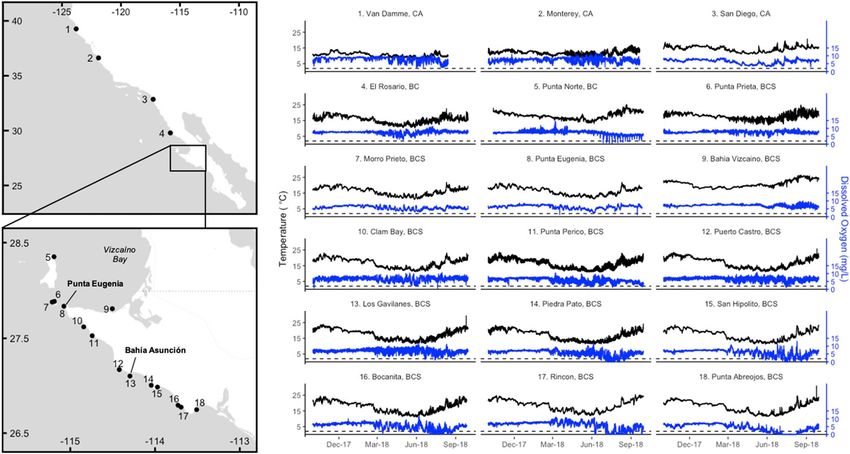
to their levels falling below hypoxic thresholds at Punta Norte and sites south of Punta Eugenia between May
and October, but especially in the summer months of June to August (Figs. 1, 4, S2). In the two southernmost
sites, Rincon and Punta Abreojos, water temperature and dissolved oxygen became uncorrelated during these
months of hypoxic exposure (Fig. 3, S3d).
Exceptions to these broad seasonal trends occurred at sites most closely associated with the Vizcaíno Bay
in Baja California (Punta Norte, Punta Prieta, and Bahía Vizcaíno; sites 5, 6, and 8), which were on average,
1–4 °C warmer than Morro Prieto and Punta Eugenia, the other two sites in the same area (Fig. 1, S1, S3). At
Bahía Vizcaíno, water temperature warmed from January through the spring and summer, and dissolved oxygen
levels stayed high with low variability during the spring (Fig. 1, S1, S2). Punta Norte and Punta Prieta showed
temperature patterns similar to most other sites, but dissolved oxygen levels also remained high and less variable
through the spring, relative to Morro Prieto and Punta Eugenia (Fig. 1, S2). Punta Norte experienced a series of
regular low-oxygen events in the summer that occurred at water temperatures higher than the overall site average
(Fig. 1, 3, S3). Water temperature and dissolved oxygen were generally not correlated at Punta Norte and Bahía
Vizcaíno, but Punta Prieta showed seasonal correlation patterns similar to most other sites in the region (Fig. 3).
Variance spectra for dissolved oxygen showed distinct variance peaks at diurnal frequencies across all sites,
and a semidiurnal peak was also present at many sites (Fig. S5). Integrated variance spectra showed that domi-
nant timescales of variation were similar for temperature and dissolved oxygen dynamics, with the exception
of Punta Norte and Bahía Vizcaíno, where temperature dynamics were dominated by synoptic (2–10 day) vari-
ation, while dissolved oxygen dynamics were dominated by diurnal (~ 24 h) variation. The integrated variance
spectra also showed that there could be considerable among-site differences in dominant timescales of variance,
even for nearby sites where broader exposure patterns seem relatively similar (i.e., Piedra Pato and San Hipolito
(sites 14 and 15)).
Discussion
Using data collected from our multi-national collaborative, participatory oceanographic monitoring network, we
found evidence for broad regional and seasonal patterns in water temperature and dissolved oxygen dynamics
and exposures to hypoxia, as well as local-scale differences, across sites spanning 13° of latitude in the southern
Scientific Reports | (2021) 11:10929 | https://doi.org/10.1038/s41598-021-89928-4 4
Vol:.(1234567890)www.nature.com/scientificreports/
Figure 2. Summary metrics of dissolved oxygen (DO) variability at 18 sites in the southern California Current
between October 2017 and September 2018: (a) minimum DO recorded during the year; (b) coefficient
of variation in DO; (c) mean rate of change in DO; (d) total number of exposures to hypoxic conditions
(≤ 2 mg/L); (e) mean duration of exposure to hypoxia; (f) mean return time between exposures to hypoxia. Sites
are arranged by latitude from north to south. The dashed line indicates the 2 mg/L threshold for hypoxia.
Scientific Reports | (2021) 11:10929 | https://doi.org/10.1038/s41598-021-89928-4 5
Vol.:(0123456789)www.nature.com/scientificreports/
Figure 3. Monthly correlation values between temperature and dissolved oxygen for each site. The dashed line
represents a correlation coefficient of 0.7, which is a significant positive correlation.
Figure 4. Proportion of total hypoxic (< 2 mg/L dissolved oxygen) events in each month, for each site.
Scientific Reports | (2021) 11:10929 | https://doi.org/10.1038/s41598-021-89928-4 6
Vol:.(1234567890)www.nature.com/scientificreports/
California Current region. This is the first regional-scale analysis of nearshore dissolved oxygen dynamics in
this highly variable and productive upwelling system. The observed patterns suggest the presence of multiple
drivers of hypoxia, and that the vulnerability of coastal ecosystems and human communities to hypoxia is highly
variable seasonally and across multiple spatial scales.
Coastal upwelling systems like the California Current region are often characterized by high variability in tem-
perature, pH, and dissolved oxygen. Hypoxia in these systems can be driven by upwelling, alongshore transport
of deep hypoxic water, shoaling internal waves, eutrophication, or a combination of these p rocesses15,25,26,39,40.
We found evidence for upwelling as a widespread regional driver of temperature and dissolved oxygen dynamics,
starting in the spring, when most study sites showed decreases in water temperature, increased variability in dis-
solved oxygen levels, and tighter correlation between temperature and dissolved oxygen values. These springtime
changes correspond to the period of time when upwelling is known to occur in the California Current system,
transporting colder, less oxygenated water into shallower coastal h abitats25,41. In addition to the region-scale influ-
ences of upwelling, we also found evidence for respiration-driven hypoxia at smaller spatial scales. We observed
further declines in dissolved oxygen levels and longer, more intense exposures to hypoxia at the five sites south
of Bahía Asunción in the summer months, accompanied by decreases in the correlation between temperature
and dissolved oxygen. The effect was particularly pronounced at Rincon and Punta Abreojos, which experienced
extensive exposures to near-anoxia. At these two southernmost sites, temperature and dissolved oxygen became
decoupled in the summer months, suggesting that upwelling was no longer a key driver of oxygen dynamics.
The intense hypoxia exposures at these southern sites corresponded spatially and temporally to reports of algal
blooms (red tide) observations by the fishing cooperatives, which were also corroborated by red tide detection
algorithms based on satellite images (Lee and Micheli, in prep). These cooperatives also reported mortalities of
abalone and other benthic invertebrates in their fishing grounds during this period.
This combination of upwelling and respiration drivers cumulatively created a broad latitudinal pattern of
hypoxia exposure, with hypoxia exposure mostly occurring only south of the Punta Eugenia headland, which
is a well-known phylogeographic and biogeographic boundary for many taxa42,43. Among these affected sites,
southern sites experienced more intense and extensive hypoxia exposures than northern sites. However, we also
found evidence for smaller-scale differences in temperature and dissolved oxygen dynamics, suggesting that
more localized drivers can alter the effects of these large-scale regional drivers. At Bahía Vizcaíno, Punta Norte,
and to a lesser extent at Punta Prieta, dissolved oxygen levels remained high and less variable through the spring
initiation of upwelling. These sites are within or oriented towards the Vizcaíno Bay rather than towards the Pacific
Ocean and the prevailing wind direction, and are likely less influenced by wind-driven upwelling. They were
consistently warmer than Morro Prieto and Punta Eugenia, the two westward-oriented sites in the same area. The
general lack of correlation between temperature and dissolved oxygen, and the mismatch of dominant variation
frequencies at Bahía Vizcaíno and Punta Norte also suggests that dynamics of the warmer, less-variable Vizcaíno
Bay, rather than regional coastal upwelling processes, are the key drivers of conditions at these sites. Similarly,
Punta Norte’s unique and highly localized series of intense exposures to hypoxia in the late summer are likely
driven by processes other than upwelling. These hypoxic events were associated with high water temperatures
and with decoupled temperature and dissolved oxygen dynamics, but were also not associated with algal blooms
like the ones observed at southern sites. Finally, Punta Prieta appears to exhibit temperature and dissolved oxy-
gen dynamics intermediate between the Vizcaíno Bay-oriented sites and the Pacific Ocean-oriented sites, likely
due to the transport of water by strong tidal currents that circle the small island of Isla Natividad34,35,44. Because
these multiple drivers of dissolved oxygen dynamics and hypoxia exposures act at different spatial scales and
are expected to be impacted differently by global change9,45,46, understanding when and where the drivers differ
is critical to anticipating the current and future occurrence and impacts of hypoxia.
Our data show that patterns of exposure and thus, potential ecological vulnerabilities to hypoxia, are highly
variable on different spatial and temporal scales, and thus suggest that the valuable, hypoxia-vulnerable benthic
fisheries in the region may be best managed at small spatial scales that match these differences in vulnerability.
In Baja California, the involvement of local fishing cooperatives with ecological and oceanographic monitoring
makes such small-scale adaptive management both a practical and desirable s trategy47. These fishing coopera-
tives have already used data from this monitoring network to make management decisions. Cooperatives in the
network independently access and visualize the temperature and oxygen data at their sites via an application
developed by co-author A. Smith on the R Shiny platform48,49. Temperature data have been used to adjust the
timing of fishing activities, such as by delaying the start of the fishing season after prolonged cold temperatures
to allow more time for mollusk body conditions to recover after spawning. Oxygen data and documentation of
hypoxia have motivated temporary closures of parts of the fishing grounds, to avoid adding fishing mortality to
hypoxia induced mortality. Temperature and oxygen data have also informed the siting of mariculture, artificial
reef and restoration projects in some cooperatives, by enabling identification of sites that are warmer and less
prone to hypoxia. Creating similar local capacity for monitoring and for flexible local-scale adaptive manage-
ment in other areas is crucial for more effective management and climate change adaptation across the California
Current and other upwelling regions.
Our monitoring network has been successful at providing valuable information on spatial variability in
hypoxia exposure. However, to evaluate spatial differences in vulnerability to hypoxia, spatial variation in dis-
solved oxygen dynamics must be integrated with the hypoxia sensitivity of species and processes in these ecosys-
tems. In this study, we used the widely-used hypoxia threshold of 2 mg/L as a broad reference point. However,
broadly-defined hypoxia thresholds may not be representative of tolerances for this particular system. There is a
very limited amount of hypoxia threshold data available for species in the California Current system. Those that
exist for benthic invertebrates suggest that both adult and juvenile life stages may be tolerant of oxygen levels
much lower than 2 mg/L, but that physiological, behavioral, and ecological processes may be impacted at much
higher levels of dissolved oxygen (e.g., 5.5 mg/L in sea urchins)18,50,51. These vulnerabilities also vary among taxa.
Scientific Reports | (2021) 11:10929 | https://doi.org/10.1038/s41598-021-89928-4 7
Vol.:(0123456789)www.nature.com/scientificreports/
For example, crustaceans tend to be sensitive to low oxygen conditions while mollusks and echinoderms tend
to be more t olerant13,50. Species mobility will also have an impact on hypoxia vulnerability with sessile benthic
organisms being less able to move away from localized hypoxia. A better understanding of species hypoxia toler-
ances in this and other systems will be crucial to assessing spatial differences in vulnerability to coastal hypoxia.
Furthermore, understanding potential intraspecific differences in organism tolerances, especially relative to
oceanographic and phylogeographic breaks (such as Punta Eugenia in our study region42), will be useful for
assessing the potential for local adaptation.
This network of dissolved oxygen sensors has identified broad geographic trends and smaller-scale vari-
ability in hypoxia drivers and vulnerabilities, but further observations will be required to assess the longer-term
persistence of these trends in an oceanographic system known for its high temporal variability and multi-year
drivers, and under continuing climate change41,46,52,53. Previous multi-year monitoring has revealed localized
high interannual variability and exposures to hypoxia at sites relatively unaffected during this study p eriod27,36,
and respiration-driven hypoxia associated with algal blooms has been reported at the northern California sites in
the past, but was not observed from 2017 to 2 01854. Although there is evidence that some spatial differences are
maintained across y ears34,35, it is unclear if the broader, regional-scale patterns show similar levels of persistence.
The longevity of this spatial mosaic will determine if and how local- and regional-scale variability in physiological
stress can be useful in adaptation, management, and conservation.
Our collaborative, region-wide efforts so far have characterized hypoxia exposures in the important context
of seawater temperature. However, dissolved oxygen dynamics needs to be monitored within an integrated,
multi-stressor context. For example, pH is also known to correlate closely with temperature and dissolved oxy-
gen during upwelling e vents25,55, and also to influence hypoxia t olerance56. Simultaneous exposures to oxygen,
pH and temperature variation and extremes are likely to produce additive, synergistic or antagonistic effects on
organisms57,58.
As the first characterization of regional-scale coastal hypoxia dynamics in the California Current upwelling
system, this study provides a key step forward in demonstrating the complex, multiple-driver spatial mosaic of
this increasingly important climate change stressor in coastal systems, and also highlights how knowledge co-
production in multi-stakeholder groups can be instrumental in enabling such spatially extensive efforts. Our
findings highlight the need for understanding this spatial and temporal variability to design realistic experi-
ments and models to inform species and ecosystem vulnerabilities, and importantly, providing guidance for
local and regional scale adaptive management. In particular, the identification of potential refuges from hypoxia
provides promising opportunities for supporting local resilience through marine protected areas, restoration,
and mariculture that leverage these microclimates27,34,35. The use of large-scale coastal monitoring networks,
in partnership with local stakeholders and governments, will be invaluable for meeting this need in the face of
regional and global ocean changes.
Received: 25 September 2020; Accepted: 26 April 2021
References
1. Díaz, R. J. Overview of hypoxia around the world. J. Environ. Qual. 30, 275–281 (2001).
2. Laffoley, D. & Baxter, J. M. (eds) Ocean deoxygenation: Everyone’s problem. Causes, impacts, consequences and solutions (IUCN,
International Union for Conservation of Nature, 2019).
3. Booth, J. A. T. et al. Patterns and potential drivers of declining oxygen content along the southern California coast. Limnol. Ocean-
ogr. 59, 1127–1138 (2014).
4. Gilbert, D., Rabalais, N. N., Díaz, R. J. & Zhang, J. Evidence for greater oxygen decline rates in the coastal ocean than in the open
ocean. Biogeosciences 7, 2283–2296 (2010).
5. Altieri, A. H. & Gedan, K. B. Climate change and dead zones. Glob. Change Biol. 21, 1395–1406 (2015).
6. Breitburg, D. et al. Declining oxygen in the global ocean and coastal waters. Science (80-) 359, eaam7240 (2018).
7. Keeling, R. E., Körtzinger, A. & Gruber, N. Ocean deoxygenation in a warming world. Ann. Rev. Mar. Sci. 2, 199–229 (2010).
8. Levin, L. A. & Breitburg, D. L. Linking coasts and seas to address ocean deoxygenation. Nat. Clim. Change 5, 401–403 (2015).
9. Rabalais, N. N., Turner, R. E., Díaz, R. J. & Justić, D. Global change and eutrophication of coastal waters. ICES J. Mar. Sci. 66,
1528–1537 (2009).
10. Diaz, R. J. & Rosenberg, R. Spreading dead zones and consequences for marine ecosystems. Science (80-) 321, 926–929 (2008).
11. Hofmann, A. F., Peltzer, E. T., Walz, P. M. & Brewer, P. G. Hypoxia by degrees: Establishing definitions for a changing ocean. Deep
Res. Part I Oceanogr. Res. Pap. 58, 1212–1226 (2011).
12. Rabalais, N. N. et al. Dynamics and distribution of natural and human-caused hypoxia. Biogeosciences 7, 585–619 (2010).
13. Vaquer-Sunyer, R. & Duarte, C. M. Thresholds of hypoxia for marine biodiversity. Proc. Natl. Acad. Sci. 105, 15452–15457 (2008).
14. Altieri, A. H. et al. Tropical dead zones and mass mortalities on coral reefs. Proc. Natl. Acad. Sci. U. S. A. 114, 3660–3665 (2017).
15. Grantham, B. A. et al. Upwelling-driven nearshore hypoxia signals ecosystem and oceanographic changes in the northeast Pacific.
Nature 429, 749–754 (2004).
16. Kim, T. W., Barry, J. P. & Micheli, F. The effects of intermittent exposure to low-pH and low-oxygen conditions on survival and
growth of juvenile red abalone. Biogeosciences 10, 7255–7262 (2013).
17. Kolesar, S. E., Breitburg, D. L., Purcell, J. E. & Decker, M. B. Effects of hypoxia on Mnemiopsis leidyi, ichthyoplankton and copepods:
Clearance rates and vertical habitat overlap. Mar. Ecol. Prog. Ser. 411, 173–188 (2010).
18. Low, N. H. N. & Micheli, F. Lethal and functional thresholds of hypoxia in two key benthic grazers. Mar. Ecol. Prog. Ser. 594,
165–173 (2018).
19. Thomas, P. & Saydur Rahman, M. Extensive reproductive disruption, ovarian masculinization and aromatase suppression in
Atlantic croaker in the northern Gulf of Mexico hypoxic zone. Proc. R. Soc. B Biol. Sci. 279, 28–38 (2011).
20. Breitburg, D. Effects of hypoxia, and the balance between hypoxia and enrichment, on coastal fishes and fisheries. Estuaries 25,
767–781 (2002).
21. Brown, J. H., Gillooly, J. F., Allen, A. P., Savage, V. M. & West, G. B. Toward a metabolic theory of ecology. Ecology 85, 1771–1789
(2004).
Scientific Reports | (2021) 11:10929 | https://doi.org/10.1038/s41598-021-89928-4 8
Vol:.(1234567890)www.nature.com/scientificreports/
22. Pörtner, H. O. & Knust, R. Climate change affects marine fishes through the oxygen limitation of thermal tolerance. Science (80-)
315, 95–97 (2007).
23. Vaquer-Sunyer, R. & Duarte, C. M. Temperature effects on oxygen thresholds for hypoxia in marine benthic organisms. Glob.
Change Biol. 17, 1788–1797 (2011).
24. Breitburg, D. L., Hondorp, D. W., Davias, L. A. & Diaz, R. J. Hypoxia, nitrogen, and fisheries: Integrating effects across local and
global landscapes. Ann. Rev. Mar. Sci. 1, 329–349 (2009).
25. Booth, J. A. T. et al. Natural intrusions of hypoxic, low pH water into nearshore marine environments on the California coast.
Cont. Shelf. Res. 45, 108–115 (2012).
26. Walter, R. K., Woodson, C. B., Leary, P. R. & Monismith, S. G. Connecting wind-driven upwelling and offshore stratification to
nearshore internal bores and oxygen variability. J. Geophys. Res. Ocean 119, 3517–3534 (2014).
27. Boch, C. A. et al. Local oceanographic variability influences the performance of juvenile abalone under climate change. Sci. Rep.
8, 1–12 (2018).
28. DiMarco, S. F., Chapman, P., Walker, N. & Hetland, R. D. Does local topography control hypoxia on the eastern Texas–Louisiana
shelf?. J. Mar. Syst. 80, 25–35 (2010).
29. Leary, P. R. et al. “Internal tide pools” prolong kelp forest hypoxic events. Limnol. Oceanogr. 62, 2864–2878 (2017).
30. Walter, R. K., Brock Woodson, C., Arthur, R. S., Fringer, O. B. & Monismith, S. G. Nearshore internal bores and turbulent mixing
in southern Monterey Bay. J. Geophys. Res. Ocean 117, 1–13 (2012).
31. Long, W. C. & Seitz, R. D. Trophic interactions under stress: Hypoxia enhances foraging in an estuarine food web. Mar. Ecol. Prog.
Ser. 362, 59–68 (2008).
32. Kwiatkowski, L. & Orr, J. C. Diverging seasonal extremes for ocean acidification during the twenty-first centuryr. Nat. Clim. Chang.
8, 141–145 (2018).
33. Safaie, A. et al. High frequency temperature variability reduces the risk of coral bleaching. Nat. Commun. 9, 1–12 (2018).
34. Woodson, C. B. The fate and impact of internal waves in nearshore ecosystems. Ann. Rev. Mar. Sci. 10, 421–441 (2018).
35. Woodson, C. B. et al. Harnessing marine microclimates for climate change adaptation and marine conservation. Conserv. Lett.
12(2), 1–9 (2018).
36. Micheli, F. et al. Evidence that marine reserves enhance resilience to climatic impacts. PLoS ONE 7, e40832 (2012).
37. Cox, K. W. California abalones, family haliotidae. Fish. Bull. 118 28–32 (1962).
38. Frieder, C. A., Nam, S. H., Martz, T. R. & Levin, L. A. High temporal and spatial variability of dissolved oxygen and pH in a
nearshore California kelp forest. Biogeosciences 9, 3917–3930 (2012).
39. Mayol, E., Ruiz-Halpern, S., Duarte, C. M., Castilla, J. C. & Pelegrí, J. L. Coupled C O2 and O2-driven compromises to marine life
in summer along the Chilean sector of the Humboldt Current System. Biogeosciences 9, 1183–1194 (2012).
40. Orellana-Cepeda, E., Granados-Machuca, C. & Serrano-Esquer, J. Ceratium furca: One possible cause of mass mortality of cultured
Blue-Fin Tuna at Baja California, Mexico. Harmful Algae 2002, 514–516 (2004).
41. Bograd, S. J. et al. Oxygen declines and the shoaling of the hypoxic boundary in the California Current. Geophys. Res. Lett. 35, 1–6
(2008).
42. Bernardi, G., Findley, L. & Rocha-Olivares, A. Vicariance and dispersal across Baja California in disjunct marine fish populations.
Evolution (N Y) 57, 1599–1609 (2003).
43. Haupt, A. J., Micheli, F. & Palumbi, S. R. Dispersal at a snail’s pace: Historical processes affect contemporary genetic structure in
the exploited wavy top snail (Megastraea undosa). J. Hered. 104, 327–340 (2013).
44. Al Najjar, M. W. Nearshore Processes of a Coastal Island: Physical Dynamics and Ecological Implications (Stanford University, 2019).
45. Hughes, B. B. et al. Climate mediates hypoxic stress on fish diversity and nursery function at the land-sea interface. Proc. Natl.
Acad. Sci. U. S. A. 112, 8025–8030 (2015).
46. Sydeman, W. J. et al. Climate change and wind intensification in coastal upwelling ecosystems. Science (80-) 345, 77–80 (2014).
47. Fulton, S. et al. From fishing fish to fishing data: The role of Artisanal Fishers in Conservation and Resource Management in
Mexico. In Viability and Sustainability of Small-Scale Fisheries in Latin America and The Caribbean (eds Salas, S. et al.) 151–175
(Springer International Publishing, 2019).
48. Chang, W., Cheng, J., Allaire, J. J., Xie, Y. & McPherson, J. shiny: Web Application Framework for R. R package version 1.4.0.2.
https://cran.r-project.org/package=shiny (2020).
49. R Core Team. R: A language and environment for statistical computing. R Foundation for Statistical Computing, Vienna, Austria.
https://www.R-project.org/ (2020).
50. Eerkes-Medrano, D., Menge, B. A., Sislak, C. & Langdon, C. J. Contrasting effects of hypoxic conditions on survivorship of plank-
tonic larvae of rocky intertidal invertebrates. Mar. Ecol. Prog. Ser. 478, 139–151 (2013).
51. Low, N. H. N. & Micheli, F. Short- and long-term impacts of variable hypoxia exposures on kelp forest sea urchins. Sci. Rep. 10,
1–9 (2020).
52. Bograd, S. J. et al. Phenology of coastal upwelling in the California Current. Geophys. Res. Lett. 36, 1–5 (2009).
53. Nam, S., Kim, H. J. & Send, U. Amplification of hypoxic and acidic events by la Nia conditions on the continental shelf off California.
Geophys. Res. Lett. 38, 1–5 (2011).
54. Rogers-Bennett, L. et al. Dinoflagellate bloom coincides with marine invertebrate mortalities in Northern California. Harmful
Algae News 46, 10–11 (2012).
55. Chan, F. et al. Persistent spatial structuring of coastal ocean acidification in the California Current System. Sci. Rep. 7, 1–8 (2017).
56. Montgomery, D. W., Simpson, S. D., Engelhard, G. H., Birchenough, S. N. R. & Wilson, R. W. Rising CO2 enhances hypoxia toler-
ance in a marine fish. Sci. Rep. 9, 1–10 (2019).
57. Boch, C. A. et al. Effects of current and future coastal upwelling conditions on the fertilization success of the red abalone (Haliotis
rufescens). ICES J. Mar. Sci. 74, 1125–1134 (2017).
58. Gobler, C. J. & Baumann, H. Hypoxia and acidification in marine ecosystems: Coupled dynamics and effects on ocean life. Biol.
Lett. 12, 20150976 (2016).
Acknowledgements
This work was supported by Grants from NSF BioOce (OCE1736830) and NSF-CNH (1212124), and Grants from
The Walton Family, Packard and Marisla Foundations. The California Department of Fish and Wildlife supported
the collection of oxygen data in northern California and San Diego, and the Monterey Bay Aquaarium provided
access to their long-term seawater monitoring dataset. We are grateful to the members, staff and directors of
the FEDECOOP fishing cooperatives and communities of the Pacific coast of Baja, and to CONANP staff of the
Vizcaino Biosphere Reserve for their participation and support.
Author contributions
F.M, C.A.B., G.D., M.R., J.T., and C.B.W. conceived the study, created the regional participatory network for data
collection, and obtained the funding for the study. N.H.N.L., F.M., J.D.A., D.R.A., C.A.B., J.C.B., M.A.B., E.D.,
Scientific Reports | (2021) 11:10929 | https://doi.org/10.1038/s41598-021-89928-4 9
Vol.:(0123456789)www.nature.com/scientificreports/
E.E., A.H., R.M., R.M., C.M., L.R.B., A.R., C.S., A.E.S., G.V, and C.B.W. collected and processed the field data.
N.H.N.L, F.M., and C.B.W. analyzed the data. N.H.N.L., F.M., C.A.B., G.D., S.M., L.R.B., and C.B.W. wrote and
edited the manuscript.
Competing interests
The authors declare no competing interests.
Additional information
Supplementary Information The online version contains supplementary material available at https://doi.org/
10.1038/s41598-021-89928-4.
Correspondence and requests for materials should be addressed to N.H.N.L.
Reprints and permissions information is available at www.nature.com/reprints.
Publisher’s note Springer Nature remains neutral with regard to jurisdictional claims in published maps and
institutional affiliations.
Open Access This article is licensed under a Creative Commons Attribution 4.0 International
License, which permits use, sharing, adaptation, distribution and reproduction in any medium or
format, as long as you give appropriate credit to the original author(s) and the source, provide a link to the
Creative Commons licence, and indicate if changes were made. The images or other third party material in this
article are included in the article’s Creative Commons licence, unless indicated otherwise in a credit line to the
material. If material is not included in the article’s Creative Commons licence and your intended use is not
permitted by statutory regulation or exceeds the permitted use, you will need to obtain permission directly from
the copyright holder. To view a copy of this licence, visit http://creativecommons.org/licenses/by/4.0/.
© The Author(s) 2021
Scientific Reports | (2021) 11:10929 | https://doi.org/10.1038/s41598-021-89928-4 10
Vol:.(1234567890)You can also read