VVV-WIT-01: highly obscured classical nova or protostellar collision?
←
→
Page content transcription
If your browser does not render page correctly, please read the page content below
MNRAS 000, 1–13 (2019)                        Preprint 17 January 2020               Compiled using MNRAS LATEX style file v3.0

                                               VVV-WIT-01: highly obscured classical nova or
                                               protostellar collision?

                                                P. W. Lucas,1? D. Minniti2,3,4 , A. Kamble5 , D. L. Kaplan6 , N. Cross7 , I. Dekany8 ,
                                               V.D. Ivanov9 , R. Kurtev2,10 , R.K. Saito11 , L.C. Smith12 , M. Catelan2,13 ,
                                               N. Masetti14,3 , I. Toledo15 , M. Hempel3 , M.A. Thompson1 , C. Contreras Peña16 ,
                                               J. Forbrich1 , M. Krause1 , J. Dale1 , J. Borissova2,10 , J. Emerson17
arXiv:2001.05536v1 [astro-ph.SR] 15 Jan 2020

                                               1 Centre for Astrophysics, University of Hertfordshire, College Lane, Hatfield, AL10 9AB, UK
                                               2 Millennium    Institute of Astrophysics, Av. Vicuna Mackenna 4860, 782-0436, Macul, Santiago, Chile
                                               3 Departamento de Ciencias Fı́sicas, Universidad Andrés Bello, Fernández Concha 700, Las Condes, Santiago, Chile
                                               4 Vatican Observatory, V00120 Vatican City State, Italy
                                               5 Harvard-Smithsonian Center for Astrophysics, 60 Garden St., Cambridge, MA 02138, USA
                                               6 Center for Gravitation, Cosmology and Astrophysics, University of Wisconsin-Milwaukee, P.O. Box 413, Milwaukee, WI 53201, USA
                                               7 Wide-Field Astronomy Unit, Institute for Astronomy, University of Edinburgh, Royal Observatory, Blackford Hill, Edinburgh EH9 3HJ, UK
                                               8 Astronomisches Rechen-Institut, Zentrum für Astronomie der Universität Heidelberg, Mönchhofstr. 12-14, D-69120 Heidelberg, Germany
                                               9 European Southern Observatory, Karl-Schwarszchild-Str 2, D-85748 Garching bei Muenchen, Germany
                                               10 Instituto de Fı́sica y Astronomı́a, Universidad de Valparaı́so, ave. Gran Bretaña, 1111, Casilla 5030, Valparaı́so, Chile
                                               11 Departamento de Fı́sica, Universidade Federal de Santa Catarina, Trindade 88040-900, Florianopolis, SC, Brazil
                                               12 Institute of Astronomy, University of Cambridge, Madingley Road, Cambridge, CB3 0HA, UK
                                               13 Instituto de Astrofisica, Pontificia Universidad Catolica de Chile, Av. Vicuna Mackenna 4860, 7820436 Macul, Santiago, Chile
                                               14 INAF - Osservatorio di Astrofisica e Scienza dello Spazio, via Gobetti 93/3, I-40129 Bologna, Italy
                                               15 ALMA Observatory, Alonso de Cordova 3107, Vitacura, Santiago, Chile
                                               16 School of Physics, University of Exeter, Stocker Road, Exeter, EX4 4QL, UK
                                               17 Astronomy Unit, School of Physics and Astronomy, Queen Mary University of London, Mile End Road, London, E1 4NS, UK

                                               Accepted XXX. Received YYY; in original form ZZZ

                                                                               ABSTRACT
                                                                               A search of the first Data Release of the VISTA Variables in the Via Lactea (VVV) Sur-
                                                                               vey discovered the exceptionally red transient VVV-WIT-01 (H − K s = 5.2). It peaked
                                                                               before March 2010, then faded by ∼9.5 mag over the following two years. The 1.6–
                                                                               22 µm spectral energy distribution in March 2010 was well fit by a highly obscured
                                                                               black body with T ∼ 1000 K and AKs ∼ 6.6 mag. The source is projected against the In-
                                                                               frared Dark Cloud (IRDC) SDC G331.062−0.294. The chance projection probability is
                                                                               small for any single event (p ≈ 0.01 to 0.02) which suggests a physical association, e.g.
                                                                               a collision between low mass protostars. However, black body emission at T ∼ 1000 K
                                                                               is common in classical novae (especially CO novae) at the infrared peak in the light
                                                                               curve, due to condensation of dust ∼30–60 days after the explosion. Radio follow up
                                                                               with the Australia Telescope Compact Array (ATCA) detected a fading continuum
                                                                               source with properties consistent with a classical nova but probably inconsistent with
                                                                               colliding protostars. Considering all VVV transients that could have been projected
                                                                               against a catalogued IRDC raises the probability of a chance association to p = 0.13
                                                                               to 0.24. After weighing several options, it appears likely that VVV-WIT-01 was a
                                                                               classical nova event located behind an IRDC.
                                                                               Key words: (stars:) novae, cataclysmic variables, stars: formation, infrared: stars,
                                                                               radio continuum: transients, ISM: clouds

                                                                                                                 1    INTRODUCTION
                                                                                                                 Very high amplitude near infrared variable sources detected
                                                                                                                 in the Milky Way are typically cataclysmic variables (CVs)

                                                                                                                 ?   E-mail: p.w.lucas@herts.ac.uk (PWL)
                                               c 2019 The Authors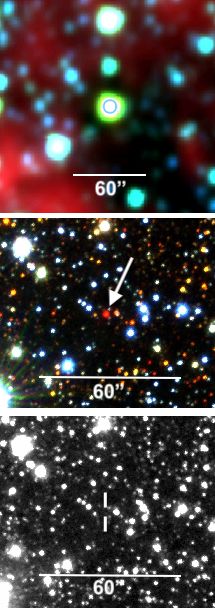
2      P. W. Lucas et al.

Figure 1. The VVV DR1 survey area in the southern Galactic plane, showing the locations of all the candidate high-amplitude variable
stars returned by the SQL query. The total area explored covers about 150 deg2 within ±2◦ of the Galactic plane. The green circle
represents the position of VVV-WIT-01.

                                                                            2   VVV-WIT-01 DISCOVERY DATA

                                                                            Since 2010, the VVV survey has mapped and monitored
                                                                            the Galactic bulge and the adjacent southern plane in the
                                                                            near infrared with VIRCAM (VISTA InfraRed CAMera)
                                                                            mounted on the 4.1 m wide-field Visible and Infrared Survey
                                                                            Telescope for Astronomy (VISTA, Sutherland et al. 2015)
                                                                            at ESO Paranal Observatory. There are now typically be-
                                                                            tween 75 and 100 epochs of data in the K s bandpass for each
                                                                            field, across a total area of 560 deg2 . From 2016, the survey
                                                                            area was extended to cover new fields (the rest of the south-
                                                                            ern Galactic plane at longitudes l > 230◦ and l < 20◦ , along
                                                                            with the outer bulge (Minniti 2016) leading to less frequent
                                                                            observations of the original VVV fields. Initial data reduc-
                                                                            tion and archival merging are carried out using the pipelines
                                                                            at the Cambridge Astronomical Survey Unit (CASU, Irwin
                                                                            et al. 2004) and VISTA Science Archive (VSA) in Edinburgh
                                                                            (Cross et al. 2012). The VVV photometry presented here are
Figure 2. K s amplitudes (K s,max − K s,min ) vs. H − K s colour for can-   profile fitting photometry, performed with an updated ver-
didate high amplitude variable stars returned by the SQL query              sion of DoPhot (Schechter et al. 1993; Alonso-Garcı́a et al.
of VVV DR1. The green circle indicates VVV-WIT-01.
                                                                            2012) for all data in the original VVV fields (Smith et al., in
                                                                            prep). The absolute calibration is based on the VVV pho-
                                                                            tometric catalogue of Alonso-Garcı́a et al. (2018) which is
                                                                            in turn derived from the CASU v1.3 VISTA pipeline. The
                                                                            VVV Survey produces near-IR multi-colour photometry in
(e.g. Saito et al. 2015, 2016; De et al. 2019) or Young Stel-               five passbands: Z (0.88 µm), Y (1.02 µm), J (1.25 µm), H
lar Objects (YSOs) undergoing episodic accretion, variable                  (1.65 µm), and K s (2.15 µm), as well as multi-epoch pho-
extinction or both (e.g. Kóspál et al. 2013; Contreras Peña              tometry in K s .
et al. 2017; Lucas et al. 2017). The VVV survey (Minniti                         The VVV 1st Data Release (VVV DR1), an SQL-based
et al. 2010; Saito et al. 2012) is the first panoramic near                 relational database available at the VSA, contains the VVV
infrared time domain survey of the Milky Way, offering the                  data taken up to 30 Sep 2010. It includes about 58 million
chance to improve our knowledge of infrared variability and                 sources detected at 4 epochs or more in a 150 deg2 area at
to discover new types of variable star. Studies of VVV tran-                Galactic latitudes b < ±2◦ (see Fig. 1). VVV DR1 was created
sients may assist extragalactic transient work, where events                in early 2012 and an SQL query was very soon run to search
such as Luminous Red Novae (LRN) have uncertain physical                    for transients and variable sources with >3 magnitudes of
origin (e.g. Kasliwal et al. 2011; Pastorello et al. 2019). In the          variation. The query selected candidates having at least 4
Milky Way, the remnants of past explosive events can read-                  epochs of observation, images in both the H and K s band-
ily be detected, providing examples of events that have not                 passes and a median K s magnitude at least two magnitudes
been seen in our galaxy in modern times. For example the                    brighter than the expected limiting magnitude for each field.
Becklin-Neugebauer explosion in the Orion Molecular Cloud                   There were a total of ∼5000 candidates, the great majority of
1 (OMC-1), likely the consequence of a protostellar collision,              them false positives with unremarkable colours (H − K s < 2)
occurred ∼500 years ago and the optically obscured super-                   but one extremely red candidate with (H − K s = 5.2) stood
nova remnant G1.9+0.3 appears to be only ∼100 years old                     out in the colour vs. amplitude diagram (see Fig. 2). After
(Reynolds et al. 2008). In this paper we report the discovery               passing visual inspection, it was classified as the first “WIT”
and analysis of VVV-WIT-01, an extremely red transient                      source (an acronym for “What is This?”) deemed worthy of
that was first observed by the VVV survey in March 2010.                    further study. It was later renamed as VVV-WIT-01. (False

                                                                                                                 MNRAS 000, 1–13 (2019)
VVV-WIT-01 3
Table 1. VVV Photometry of VVV-WIT-01.
MJD-2455250.0 Filter Magnitude σ
8.381478 Ks 12.24 0.02
8.382969 Ks 12.23 0.02
11.339142 Ks 12.28 0.02
11.339855 Ks 12.30 0.02
21.294046 Ks 12.44 0.02
21.295505 Ks 12.43 0.02
187.054863 Ks 16.42 0.06
187.055789 Ks 16.32 0.05
189.022168 Ks 16.47 0.05
189.022994 Ks 16.57 0.06
213.004979 Ks 16.92 0.10
213.005872 Ks 16.69 0.07
214.021768 Ks 16.70 0.09
214.022686 Ks 16.87 0.11
8.376614 H 17.50 0.04
8.378080 H 17.41 0.04
21.289327 H 17.60 0.02
21.290754 H 17.62 0.05
Note: the quoted errors are those given by DoPhot, with a floor
of 0.02 mag imposed as the estimated calibration uncertainty.
positives were due to multiple causes such as saturated stars,
blends of two or more stars or cosmic rays.)
VVV-WIT-01 is the only high amplitude variable with
such a red H − K s colour amongst 58 million sources in DR1
with 4 or more epochs of photometry (Minniti et al. 2012).
Moreover, additional searches of a database of 2010–2018
light curves for all sources in the original 560 deg2 VVV
area have found no additional transients with H − K s > 3 (see
section 4.6). It was at K s ≈ 12.2 when first detected in March
2010 but faded to K s ∼ 16.7 by July of that year and was
then undetected in VVV images taken in every subsequent
year up to 2018, to a typical 3σ upper limit of K s = 18.85
(using annual stacks of all the relevant images taken each
year). The source was not detected in the VVV Z, Y and J
images taken in 2010 and again in 2015, to 3σ limits of 20.5,
20.5 and 20.0 mag in Z, Y and J respectively. Finder images
showing the location of the source are presented in Fig. 3
and the time series of profile fitting photometry is given in
Table 1.
The observed light curve (see Fig. 4) shows a rate of
decline similar to that of a core collapse supernova (Meikle
2000; Mannucci et al. 2003; Leibundgut & Suntzeff 2003)
or perhaps a classical nova, given that the latter have
widely varying decline timescales (see section 4.1). A search
of the SIMBAD database revealed that the object is pro-
jected within SDC G331.062−0.294, a small Infrared Dark
Cloud (IRDC) from the catalogue of Peretto & Fuller (2009)
with an equivalent-area radius of 1700 . This IRDC cata-
logue in fact lists two IRDCs within two arcminutes (the
other being SDC G331.030−0.299) and inspection of the
Spitzer/GLIMPSE 8 µm image for the region shows that Figure 3. Finder images (equatorially oriented). (Top:) 3 × 30
these two appear to be part of the same dark region ∼30 in WISE 3-colour image showing VVV-WIT-01 in 2010, marked with
extent (see Fig. 5) that is seen in projection against the a blue circle (blue: 3.3 µm, green: 4.6 µm, red: 12 µm). The green
inner part of a large bubble of bright mid-infrared emis- colour is due to high extinction and emission from warm circum-
sion designated as MWP1G331057−002239 (Simpson et al. stellar matter. (Middle:) 90 × 8000 VVV 3-colour image (blue: J,
2012). This bubble is coincident with the HII region IRAS green H, red: K s ) from March 2010. VVV-WIT-01 is the very red
star at the centre, with additional red YSO candidates adjacent.
16067−5145, for which Jones & Dickey (2012) give a kine-
(Bottom:) K s stacked image made from all VVV images of the
matic distance of 7.4±1.1 kpc. IRDCs are the densest por-
field in 2011. The transient was no longer detected.
MNRAS 000, 1–13 (2019)4 P. W. Lucas et al.
Figure 4. Observed K s light curve for VVV-WIT-01. We show the VVV Survey observations from 2010 (green circles), until 2011 (upper
limit), and the ISAAC observation from May 2012 (green diamond). The insert shows the contemporaneous VVV and WISE observations
from early 2010, where we have averaged data within each day for clarity. The error bars are typically smaller than the point sizes.
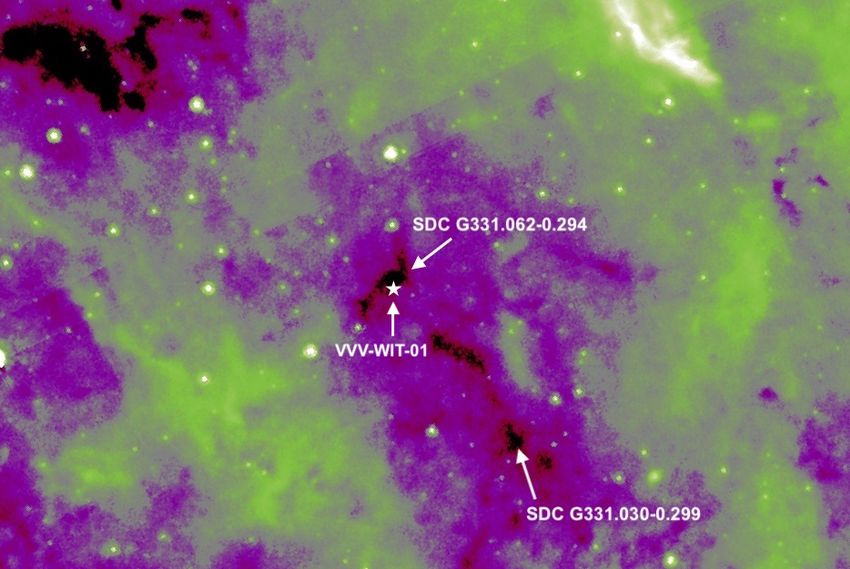
Figure 5. Spitzer/GLIMPSE 8 µm 8 × 60 false colour image of the IRDCs in the VVV-WIT-01 field, with equatorial orientation. This
image was taken in 2004, before the transient event (marked with a white star) in SDC G331.062−0.294. We see that this IRDC is part
of a larger dark region that includes SDC G331.030−0.299. The bright diffuse 8 µm background emission (green or white areas) is typical
of the mid-plane of the inner Milky Way. The white area at the top right is the HII region IRAS 16067-5145 at d ≈ 7.4 kpc, see text.
MNRAS 000, 1–13 (2019)VVV-WIT-01 5
Table 2. AllWISE Multi-epoch Photometry of VVV-WIT-01.
MJD-55250 W1 σW1 W2 σW2 W3 σW3 W4 σW4
5.564351 7.918 0.018 5.592 0.018 4.764 0.028 4.295 0.149
5.696656 7.908 0.015 5.669 0.022 4.753 0.027 4.117 0.111
5.828960 7.929 0.016 5.685 0.022 4.746 0.024 4.066 0.116
5.961264 7.922 0.015 5.775 0.019 4.747 0.031 4.115 0.164
6.027479 7.915 0.017 5.63 0.016 4.795 0.03 4.211 0.193
6.093695 7.934 0.017 5.603 0.024 4.743 0.024 4.025 0.137
6.159783 7.922 0.013 5.667 0.021 4.761 0.023 4.157 0.161
6.225999 7.975 0.016 5.672 0.029 4.696 0.023 4.137 0.167
6.292087 7.945 0.014 5.621 0.017 4.745 0.027 4.153 0.16
6.424391 7.974 0.017 5.546 0.019 4.722 0.029 4.113 0.16
6.424519 7.939 0.016 5.575 0.015 4.75 0.033 4.253 0.165
6.556823 7.945 0.015 5.742 0.028 4.718 0.023 4.14 0.085
6.689127 7.942 0.015 5.627 0.017 4.698 0.027 4.196 0.195
12.57761 8.078 0.018 5.805 0.016 4.806 0.026 4.2 0.166
12.57773 8.057 0.021 5.754 0.021 4.819 0.026 4.243 0.171
tions of molecular clouds and the probability of chance as- seems very probable that SDC G331.062−0.294 is a bona fide
sociation with such an object is only ∼1% (see section 4) IRDC located in front of the HII region IRAS 16067-5145.
for any single unrelated VVV transient within the south- In summary, VVV-WIT-01 is a very red object (H − K s
ern half of the Spitzer/GLIMPSE I survey area (where the = 5.22 ± 0.05 mag), with mean K s = 12.3 mag in March
Peretto & Fuller (2009) catalogue is defined). We must there- 2010 (Fig. 4). We have measured an accurate absolute posi-
fore consider the case for a pre-main sequence origin for the tion (uncertainty ∼6 milliarcsec) based on the VVV profile
event. We should also keep in mind that many transients fitting photometry catalogues, astrometrically transformed
have been detected in VVV so the chance of observing at to the Gaia DR2 reference frame (Lindegren et al. 2018) us-
least one transient in an IRDC over the course of the survey ing numerous stars in the vicinity of the transient (Smith et
is rather higher (discussed later in section 4.6). While a lo- al., in prep.). The J2000.0 equatorial coordinates are: RA =
cation within or behind an IRDC may appear to explain the 16h 10m 53.4293s, DEC = -51d 55m 32.439s (J2000), and
red colour simply as a consequence of very high extinction, the Galactic coordinates are: l = 331.061347◦ , b = 0.295905◦ .
this alone cannot explain the slope of the spectral energy
distribution (SED) in the mid-infrared (see section 3.1).
3 MULTIWAVEBAND FOLLOW UP AND
IRDCs are initially detected simply as dark regions ARCHIVAL OBSERVATIONS
against the bright mid-infrared background of the Galac-
3.1 Infrared and optical data
tic plane. Small IRDCs from the Peretto & Fuller (2009)
catalogue can be false positive detections caused by dips in We searched various archival optical-infrared databases for
the background emission so confirmation is typically sought this source. The source is absent in the optical plates taken
via detection of far-infrared emission from cold dust in the with the UK Schmidt Telescope, available at the SuperCos-
putative dense cloud. Peretto et al. (2016) performed au- mos Sky Survey (www-wfau.roe.ac.uk/sss/). There were
tomated checks on their 2009 catalogue using the 250 µm no detections in the following additional image datasets:
Herschel/HiGal images (Molinari et al. 2010) to statisti- JHK s data taken on 1999 July 15 by the Two Micron All
cally assess the fraction of false positives and false negatives. Sky Survey (Skrutskie et al. 2006), I JK data taken on 1996
SDC G331.062−0.294 passed only one of the two principal April 16 by the Deep Near Infrared Survey of the South-
checks: far infrared emission was detected but below the 3σ ern Sky (Epchtein et al. 1999), riHα data taken on 2015
threshold, because the measured noise level was inflated by June 8 by VPHAS+ (Drew et al. 2014), 3.6–8.0 µm mid-
real variation on small spatial scales. However, the adjacent infared data taken on 2004 April 2 by Spitzer/GLIMPSE
cloud SDC G331.030−0.299 passed both checks. Visual in- (Benjamin et al. 2003), a 24 µm image taken on 2006 April
spection of the HiGal 250 µm image clearly shows emission 13 by Spitzer/MIPSGAL (Rieke et al. 2004; Carey et al.
at the two expected locations (brightest in between them 2009) and Midcourse Space Experiment 8 µm and 21 µm
in fact) and the surrounding bright and highly structured images taken in 1996–1997 (Egan et al. 1998).
emission from the [SPK2012] MWP1G331057−002239 bub- However, the object is present and very bright in the
ble dominates the image. In view of the caveats described Wide-field Infrared Survey Explorer (WISE) mid-infrared
by Peretto et al. (2016) for their automated analysis and dataset (with several images between 2010 February 28 and
after visual comparison with other small IRDCs in the same 2010 March 7, fortuitously overlapping with the dates of the
HiGal image that pass or fail the automated tests, we do first VVV images). The WISE photometry from the All-
not regard this non-confirmation of SDC G331.062−0.294 as WISE Multi-Epoch Photometry Database is given in Table
significant. Given that high infrared extinction is required 2. The tabulated W2 data in fact require a positive correction
to fit the SED of VVV-WIT-01 (see section 3.1) and YSO for saturation of 0.07 mag (Cutri et al. 2012); this applies in
candidates are present (see section 3.4 and Appendix A) it a similar fashion for WISE Allsky and AllWISE data taken
MNRAS 000, 1–13 (2019)6 P. W. Lucas et al.
tometry on the W3 FITS image obtained from the NASA
Infrared Science Archive with IRAF/DAOPHOT, bootstrap-
ping the zero point using several nearby sources in the All-
WISE source catalogue. We find W3 = 6.78 ± 0.14 mag on
2010 August 29 (the mid-point date of the image stack), the
measurement error being dominated by the uncertain back-
ground level within the IRDC. This compares with K s = 16.45
on the same date (averaging VVV data from August 28 and
August 30), indicating that the transient had faded by 4.2
mag at 2.15 µm but only 2.0 mag at 12 µm. N.B. the August
2010 data were from the ”3-Band Cryo” phase of the WISE
mission so no data were taken in W4.
The near simultaneity of the VVV and WISE mea-
surements in March 2010 allows us to define an SED, see
Fig. 6 (upper panel). We attempted to fit the SED using a
reddened, uniform-temperature black body, i.e. the model
is log10 (λBλ (T )10−0.4A(λ) ). We constructed a library of black
body SEDs with a range of temperatures and extinctions
(60 11 at this epoch
deeper unWISE W2 stacked image constructed from data corresponds to a fade of over 5 mag at 4.6 µm, larger than
taken on 2010 August 28 to August 31 (Meisner et al. 2018) the 4.2 mag fade at 2.15 µm and the 2.0 mag at 12 µm.
but the location is severely blended with 2 adjacent stars After including this upper limit in W2, the SED is not well
in the ∼600 WISE beam, preventing detection of stars with described by a single temperature black body in late August
W2 ≥ 11 mag). However, the stacked W3 image taken at that (see the blue points in Fig. 6), for any value of extinction.
time shows a clear but uncatalogued detection of a point Nonetheless, the relative brightness at 12 µm suggests a shift
source at the position of the transient. There are no blend- to lower temperatures.
ing issues in this waveband because fewer stars are detected. Soon after the discovery of the transient in VVV
Moreover, this source is not present in the GLIMPSE 8 µm
image taken in 2004 (see Fig. 5) so we can be confident that
it is VVV-WIT-01. We suspect that the AllWISE pipeline 1 We also considered the modified near infrared extinction law of
did not detect it because the sky background level is mea- Alonso-Garcı́a et al. (2017), derived for VVV data in the inner
sured with a coarse spatial grid so the flux peak within the bulge. Steeper near infrared extinction laws such as this lead to
small IRDC did not stand out sufficiently above the (over- best-fit solutions with slightly lower values of both extinction and
estimated) background level. We performed aperture pho- temperature, not significantly changing our conclusions.
MNRAS 000, 1–13 (2019)VVV-WIT-01 7
DR1 in early 2012, we obtained deeper and higher resolu- Again the 6 km configuration was used. The phase and gain
tion follow-up observations on 2012 May 10 using the In- calibrators observed on this occasion were 1646-50 and 1600-
frared Spectrometer And Array Camera (ISAAC, Moorwood 48, the latter being used only at the start of the run before
et al. 1998) at the ESO Very Large Telescope (ESO pro- 1646-50 rose high enough. An adjacent, uncatalogued con-
gramme 289.D-5009). We also obtained Spitzer/IRAC im- tinuum source at 16:10:59.4 -51:49:24.0 was used for self-
ages on 2012/05/29 (MJD 56076.787), under Spitzer pro- calibration at 5.5 GHz but this was not possible at 9 GHz.
gramme 80259. The ISAAC data showed that VVV-WIT- VVV-WIT-01 was no longer detected, with 3σ upper limits
01 had faded to K s = 20.34 ± 0.09 mag. The IRAC data also of approximately 40 µJy at both frequencies.
showed a point source, with I2(4.5 µm) = 15.22 ± 0.30 mag.
(The source is clearly detected but there is uncertainty in
the background level because two much brighter stars are 3.4 Radio mm/submm continuum data
present on either side of VVV-WIT-01 and there are also
The transient was also followed up with the Atacama Large
gradients in the surrounding nebulosity). In the I1 passband
Millimeter/submillimeter Array (ALMA), using the 12 m
we measure a 3σ upper limit, I1(3.6 µm) > 16.5 mag. The I2
antennae in the main array. Observations were made in the
magnitude can be compared with the earlier WISE W2 mag-
continuum in ALMA band 3 (2.6–3.6 mm), band 6 (1.1–
nitude, as the passbands are similar. The comparison shows
1.4 mm) and band 7 (0.8–1.1 mm) in 2013 and 2015 (ALMA
that the variable source has faded by ∼9.5 mag at 4.5 µm
project codes 2012.1.00463.S and 2013.A.00023.S). These
over the 2 year interval.
were reduced with the standard data reduction pipeline by
observatory staff. No source was detected at the coordinates
of VVV-WIT-01, to 3σ upper limits of approximately 0.1
3.2 High energy and neutrino data
mJy in all 3 bands. In bands 6 and 7 two sources were de-
We note that the ANTARES neutrino project (Ageron tected within the area of SDC G331.062−0.294, both of them
et al. 2011) did not detect any non-solar astronomical neu- offset from VVV-WIT-01 by a few arcseconds. One of these
trino sources in the 2007–2012 period (see http://antares. sources is coincident with a likely YSO, VVV J161053.93-
in2p3..fr/publicdata2012.html). The Super-Kamiokande 515532.8, that happens to show a ∼1 mag infrared out-
and SNEWS neutrino projects (Fukuda et al. 2003; Anto- burst in 2015. This is one of the two red stars visible to
nioli et al. 2004) also did not detect any events in a 9 month either side of VVV-WIT-01 in the middle panel of figure
interval prior to March 2012 (M. Vagins and K. Scholberg, 3, both of which are YSO candidates. We give details of
private comm.). Similarly, there are no reported detections VVV J161053.93-515532.8 in Appendix A. The other ALMA
of γ-ray or hard X-ray sources that can be connected with detection has no infrared counterpart and may well be an
this transient in alert data and catalogue data from the extragalactic object.
Fermi, Swift and INTEGRAL satellites (Ackermann et al.
2013; Oh et al. 2018; Krivonos et al. 2012).
We moreover obtained targeted X-ray follow up obser-
4 DISCUSSION AND SEARCHES FOR
vations of the VVV-WIT-01 field with Swift/XRT from 21
ADDITIONAL EVENTS
April to 13 May 2012, totalling 8123 s on source in the 0.3-
10 keV passband. No X-ray source was detected, with a 3σ 4.1 Protostellar collision interpretation
upper limit of 3×10⁻¹⁴ erg cm−2 s−1 .
Owing to the location projected against an IRDC, we must
consider the case for a genuine physical association and a
pre-main sequence origin. IRDCs are numerous in the inner
3.3 Radio cm continuum data
Galactic plane but relatively small. Using the equivalent area
Following the initial announcement of this transient event radii from Peretto et al. (2016) for IRDCs that passed their
(Minniti et al. 2012), the field was observed with the far-infrared confirmation test, we derive a covering fraction,
Australia Telescope Compact Array (ATCA) at 2.1 GHz, f = 1.2% within the southern portion of the GLIMPSE-I sur-
5.5 GHz and 9 GHz on 2012 May 21, some two years after vey area at 295 < l < 350◦ , |b| < 1◦ , where the IRDC catalogue
the first detections (ATCA programme CX240). The obser- of Peretto et al. (2016) was defined. This rises to f = 2.3% if
vations used the longest baseline array configuration (6 km) we include IRDCs that did not pass the automated confirma-
and lasted for a full track, providing good uv coverage and tion test. These small covering fractions led us to explore the
a spatial resolution, θ ≈ 100 at the two higher frequencies, possibility that the transient was a collision between YSOs
with a symmetric beam. The phase and gain calibrator was within the IRDC, SDC G331.062−0.294. Collisions, which
1613-586. The Miriad software package was used to reduce will often lead to mergers, can cause high amplitude tran-
the data, using standard procedures to flag and remove bad sient events such as the “mergeburst” observed in V1309 Sco
data. VVV-WIT-01 was clearly detected at 5.5 GHz and (Tylenda et al. 2011, arising in a contact eclipsing binary sys-
9 GHz with fluxes of 276 ± 10 µJy and 236 ± 37 µJy respec- tem) and other likely examples such as V838 Mon and V4332
tively. It was not detected at 2.1 GHz, with a 2σ upper limit Sgr (Martini et al. 1999; Tylenda & Soker 2006; Kochanek
of approximately 400 µJy. A power law fit to the detections et al. 2014). As noted earlier, such events are a possible ex-
and upper limit yields a spectral index α = −0.15 ± 0.22, for planation for “luminous red novae” seen in external galaxies.
Fν ∝ να , essentially a flat radio spectrum. We note that the high amplitude of the event (≥9.5 mag
A second set of ATCA observations at 5.5 GHz and at 4.5 µm) tends to argue against some form of episodic
9 GHz was obtained 7 years later, on 2019 June 24/25, with accretion event in a protostar because infrared variations
a duration of almost a full track (ATCA programme C3309). in the most extreme such events have not exceeded ∼6 to
MNRAS 000, 1–13 (2019)8 P. W. Lucas et al.
7 mag hitherto, e.g. Audard et al. (2014). An apparent pro- tude diagrams for the larger region within 3 arcminutes of
tostellar eruption with an unprecedented mid-infrared am- VVV-WIT-01 (not shown) shows a fairly smooth increase
plitude of 8.5 mag has recently been discovered in the public in extinction with distance at d > 3 kpc, consistent with the
WISE/NEOWISE, GLIMPSE and VVV data (Lucas et al., existence of several large molecular clouds along this line of
in prep) but the event has a long plateau and a slow decline sight.
over several years, not resembling the rapid decline seen in
VVV-WIT-01.
Bally et al. (2017) provide three examples of explosion 4.2 Supernova hypotheses
remnants within Galactic star formation regions that are
The non-detections of neutrinos and γ-rays (see section 3.2)
likely due to historical collisions between YSOs. The best-
rule out a highly obscured core collapse supernova on the far
studied example is the Becklin-Neugebauer event in OMC-1,
side of the Galactic disc. Such events are very luminous γ-
where recent data indicate that three YSOs are moving away
ray and hard X-ray sources; we would also expect to detect
from a common origin some 500 years ago, at the centre of
the neutrino signal because it is very rare for all three of
the explosion remnant (Kuiper et al. 2010b). The physics
the neutrino observatories listed in section 3.2 to be offline
of collisions between protostars, and mergers, is discussed
simultaneously.
in detail by Bally & Zinnecker (2005). The topic is inter-
These neutrino and high energy radiation checks were
esting in part because mergers are a possible mode of for-
necessary because a relatively low luminosity core collapse
mation for massive stars (Bonnell et al. 1998), though it is
supernova with peak absolute magnitude MKs = −16, subject
now thought likely that massive stars can form without re-
to extinction AKs = 10 mag (the maximum plausible value,
course to this mechanism (Kuiper et al. 2010a; Baumgardt &
see above) might have apparent magnitude mKs = 10.5 if lo-
Klessen 2011; Kuiper & Hosokawa 2018). If collisions in star
cated at d=20 kpc from the sun; the infrared data alone
forming regions do occur, the relatively low space density
would not entirely rule out this possibility because VVV-
in such regions would require some explanation other than
WIT-01 was discovered after the peak. Similarly, while a
random motions within the cluster potential, even when
core collapse supernova would typically be a far brighter
gravitational focussing is allowed for (Shara 2002). Possible
cm continuum radio source than was observed (see section
explanations might include focussing of YSOs within rela-
3.3), rare examples with blue supergiant progenitors can be
tively small volumes due to formation within hub-filament
radio-quiet (Weiler & Sramek 1988).
systems of dense gas within molecular clouds (Myers 2009;
A type Ia supernova in the inner Milky Way would be
Peretto et al. 2013; Williams et al. 2018), ongoing accre-
radio-quiet and lack detectable neutrino emission (Odrzy-
tion of low angular momentum gas in a star forming cluster
wolek & Plewa 2011). However, such an event would have
(Gieles et al. 2018) or perhaps the unstable dynamical decay
been detected in γ-rays by the Fermi, Swift or INTEGRAL
of newborn multiple systems (Rawiraswattana et al. 2012;
telescopes due to strong emission at specific energies associ-
Moeckel & Bonnell 2013; Railton et al. 2014).
ated with the decay of 56 Ni and 56 Co in the ejecta, see Wang
No massive protostar remained visible in the vicin-
et al. (2019) for a full discussion. For example, in the case of
ity of VVV-WIT-01 after the transient event so a colli-
SN2014j at 3.3 Mpc distance, the 847 keV line of 56 Co was
sion would have to involve low mass YSOs. This is not
detected by INTEGRAL for more than four months (Diehl
an obstacle because the great majority of YSOs have low
et al. 2015).
masses and they can appear faint when embedded in an
IRDC at a distance of several kpc. IRDCs have typical
distances of 1–8 kpc (Simon et al. 2006) and we inferred
4.3 Helium flash hypothesis
in section 2 that SDC G331.062−0.294 is probably lo-
cated in front of the bright HII region IRAS 16067-5145 A few examples of a very late thermal pulse in a post-
at d ≈ 7.4 kpc. The recent 12 CO-based molecular cloud cat- Asymptotic Giant Branch star have been observed over the
alogue of Miville-Deschênes et al. (2017) lists at least four past century, e.g. V4334 Sgr (Sakurai’s object) and V605
massive molecular clouds that appear to overlap the loca- Aql, (see e.g. Hajduk et al. 2005). In these events, the star
tion of VVV-WIT-01, with likely distances ranging from returns from the white dwarf cooling track to giant star sta-
1.5 to 8.5 kpc. The distance to SDC G331.062−0.294 can tus but then remains luminous (L ∼ 104 L ) for hundreds of
be constrained using blue foreground stars with parallaxes years. Such stars can appear almost nova-like at visible wave-
from Gaia. Gaia source 5933412592646831872 is projected lengths because the rise in flux takes place over a time of
in this IRDC and has a likely minimum parallax-based order 1 year and subsequent formation of dust in the ejecta
distance of 2.4 kpc in Bailer-Jones et al. (2018). Source can cause a rapid optical fading, as in V605 Aql. The near
5933458016223623552, projected in the adjacent, apparently infrared flux can also fade and re-brighten as the ejecta cool
connected IRDC SDC G331.030−0.299 has a likely mini- and the observed structure changes (Hinkle & Joyce 2014;
mum parallax-based distance of 3.1 kpc (based on a 7σ Evans et al. 2006; Hinkle & Joyce 2002; Clayton et al. 2013;
parallax and neglecting the small systematic parallax er- Kimeswenger et al. 2000) but the mid-infrared flux remains
ror in Gaia DR2). Combining these lower limits with the high for several years, with measured temperatures exceed-
upper limit from the background HII region, we can as- ing 500 K. The data for VVV-WIT-01 do not seem consis-
sume 3.1 < d < 7.4 kpc for these IRDCs. Unfortunately it tent with a helium flash event because, while some cooling
was not possible to calculate a red clump giant distance apparently occurred over the six month interval after first
(López-Corredoira et al. 2002) because the IRDCs are too detection, the source faded by 2 mag at 12 µm and by much
small to have a projected population of such stars. The giant larger amounts at 4.6 µm and 2.15 µm (see section 3.1), in-
branch in the 2MASS and VVV K s vs J − K s colour magni- dicating that the total luminosity probably declined by a
MNRAS 000, 1–13 (2019)VVV-WIT-01 9
large factor during this time. This rapid decline, and the distance modulus m − M = 10.6 to 15.6, or d = 1.3 to 13 kpc,
continued decline from 2010–2012 at 4.6 µm, contrast with if we were observing the initial outburst. If we adopt a lower
the approximately constant luminosity of V4334 Sgr over extinction model more typical of IRDCs, within the likely
several years (Hinkle & Joyce 2014). The relative rarity of range of 3.6 < AKs < 10.1 (see section 3.1), these distances
these events also means that a chance association with an can rise by up to a factor of three, despite the slightly lower
IRDC would be unlikely. temperature associated with these models. The photometric
maximum was not in fact observed so the distance is not
well constrained in this interpretation, though it would have
4.4 Classical Nova interpretation to be larger than the minimum distance of 3.1 kpc to the
A clear case may be made for a classical nova located behind IRDC (see section 4.1). Nonetheless, a classical nova with a
the IRDC. Classical novae are the commonest type of tran- prominent dust peak could plausibly be located at a distance
sient seen in VVV: at least 20 likely examples have been of several kpc, i.e. behind the IRDC.
discovered within the VVV dataset, many of them in the
“VVV disc” area at Galactic longitudes 295 < l < 350◦ (e.g.
4.5 The cm continuum test
Saito et al. 2015, 2016) and many others have been indepen-
dently discovered within the Galactic bulge since 2010, by The cm continuum data from ATCA provide a valuable test
VVV, WISE or optical surveys such as OGLE and ASAS. of the protostellar collision and nova hypotheses. Numerous
Classical novae (and recurrent novae, which are novae that radio shells associated with classical novae have been ob-
have been observed to erupt more than once) have outburst served previously. Nearby novae have typical fluxes of the
amplitudes from 7 to 20 mag in the optical (e.g. Strope order of a few mJy at 4–9 GHz continuum when observed
et al. 2010; Osborne 2015) and a very wide range of de- ∼2 years after the event and the radio spectral index at those
cay timescales; in the sample of 95 optical nova light curves frequencies is typically approximately flat at that time, con-
presented by Strope et al. (2010), the t3 parameter (the time sistent with optically thin free-free emission (Hjellming et al.
for the outburst to decline by 3 mag from the peak at optical 1979; Seaquist 2008; Finzell et al. 2018). Optically thin nova
wavelengths) ranges from 3 days to 900 days. Strope et al. shells then fade fairly rapidly at these frequencies as the
(2010) illustrated considerable variety in the morphological shell becomes increasingly optically thin, with S ν ∝ (t − t0 )k ,
features of nova light curves that remains poorly understood. where k ranges from -3 to -1 and t0 is the time of the explo-
In the infrared, only a few well sampled novae have sion. If VVV-WIT-01 was a classical nova, we would expect
been studied in detail (see e.g. Gehrz 1988, 1999; Hachisu the radio emission to have faded by a factor of at least 4.5,
& Kato 2006; Gehrz et al. 2015), though fairly well sam- and more likely by one or two orders of magnitude, between
pled K bandpass light curves are now available for many the 2012 and 2019 ATCA observations. The ATCA non-
novae in the SMARTS database (www.astro.sunysb.edu/ detection in 2019 at a level an order of magnitude fainter
fwalter/SMARTS/NovaAtlas/). Many novae have a second than the 2012 flux is therefore consistent with this interpre-
peak in the infrared light curve some 30 to 60 days after tation. The flat spectral index and ∼0.25 mJy flux level in
the initial optical/infrared maximum, due to the conden- 2012 are also consistent with a classical nova at a distance
sation of a dust shell within the ejecta that is sometimes of several kpc.
optically thick and sometimes optically thin, perhaps due to In the case of a collision between YSOs, numerical sim-
clumpiness (see e.g. Gehrz 1988; Hachisu & Kato 2006; Das ulations of relatively violent collisions (those would produce
et al. 2013; Burlak et al. 2015). The SED of the dust shell is a transient event of nova-like luminosity) predict between
well fit by emission from a black body at temperatures from 1% and 10% of the combined stellar mass would be ejected,
∼700 to 1100 K. Examples include Nova Cyg 1978 (Gehrz i.e. a mass of order a few ×10−2 M to a few ×10−1 M for a
et al. 1980b) and Nova Ser 1978 (Gehrz et al. 1980a), whilst collision between low mass stars (Laycock & Sills 2005; Dale
in the SMARTS database the light curves of e.g. V906 Car & Davies 2006; Soker & Tylenda 2006). This is supported
and V5668 Sgr appear to show a prominent K bandpass by an empirical estimate of 1 M ejected, in the case of the
dust peak. A large amount of dust production is more com- massive Becklin-Neugebauer event (Bally et al. 2017). The
mon in CO novae, originating in low mass white dwarfs, ejection velocities would be lower than in a classical nova,
than ONeMg novae wherein the white dwarf has a typical of order 102 km/s (i.e. a little less than the escape veloc-
mass M > 1.2 M (Gehrz 1999). Our derived temperature ity): this is in line with the ejection velocities observed in
near 1000 K for the Planckian emission from VVV-WIT-01 V1309 Sco, V4332 Sgr and V838 Mon (Tylenda & Soker
is clearly a close match to a classical nova soon after the 2006; Kamiński et al. 2009, 2015, and references therein).
epoch of dust condensation. Classical novae typically eject a few ×10−4 M , e.g. Gehrz
The absolute visual magnitudes of classical novae at (1999), at speeds of order 103 km/s. Since the ejected mass
peak brightness typically lie in the range −10 < MV < −5 from a stellar collision is likely to be two or three orders
(Warner 1987) and K s magnitudes are similar to V at this of magnitude greater and the velocity is likely to be almost
time, in the absence of reddening. The absolute K s magni- an order of magnitude less, we would expect the collision
tude of the second peak after the epoch of dust formation ejecta to remain optically thick in the 4 cm continuum for
can vary widely depending on the optical depth and temper- ∼2 orders of magnitude longer than the 2 year timescale that
ature of the dust (e.g. Hachisu & Kato 2019) but in some of is characteristic of novae. Free-free emission from optically
the above examples it is similar to, or only 1 or 2 mag fainter thick ejecta tends to slowly brighten over time as the surface
than, the first peak. Adopting our best-fit values of extinc- area increases, as is observed in the early stages of nova shell
tion and temperature AKs = 6.6, T ≈ 1000 K for VVV-WIT-01, expansion, so in such an event we would have expected the
the brightest K s magnitudes in March 2010 would imply a radio continuum flux to be brighter in the 2019 ATCA ob-
MNRAS 000, 1–13 (2019)10 P. W. Lucas et al.
servation than in 2012. The non-detection in 2019 therefore a 1 in 5 × 10⁷ chance of a collision per year for individual
argues fairly strongly against the collision hypothesis. YSOs, or 1 in 50 per Myr per YSO. This upper limit is at
a level that begins to be useful, confirming that, while such
collisions are rare, there may be numerous such events within
4.6 Searches for additional very red transients the lifetime of massive pre-main sequence clusters of several
thousands stars, such as the Orion Nebula Cluster. A careful
In order to further test our two main hypotheses, we
search of datasets such as VVV, GLIMPSE, WISE and the
searched the current working database of VVV/VVVX
United Kingdom Infrared Deep Sky Survey (UKIDSS) may
2010–2018 light curves covering the original 560 deg2 area
yield more examples of the remnants of pre-main sequence
(see section 2) to determine how many transient events have
mergebursts, to add to the three listed by Bally & Zinnecker
occurred and whether there have been any other exception-
(2005).
ally red transients in star forming regions. We detected 59
transient events with amplitudes over 4 mag, 12 of which
occurred within the boundary of the GLIMPSE-I survey
at 295 < l < 350◦ , −1 < b < 1◦ where the IRDC catalogue 5 CONCLUSIONS
of Peretto & Fuller (2009) is defined. None of these events
The VVV-WIT-01 transient event was uniquely red amongst
were projected in IRDCs and none have SEDs as red as
transients detected in the VVV dataset thus far. It was also
VVV-WIT-01. Some events that were detected by WISE,
unique in its projected location in an IRDC. The contem-
e.g. VVV-NOV-005 (Saito et al. 2015), have colours in the
poraneous timing of observations with VISTA and WISE in
range 1 < W1 − W2 < 2, consistent with emission from hot
March 2010 was fortunate but the sparse sampling of the
dust. Most of these 59 transients have been previously iden-
light curve and lack of a spectrum make a definitive classi-
tified as novae or nova candidates but some are new: their
fication difficult. Nonetheless, the absence of γ-ray and neu-
infrared light curves will be the subject of a separate paper.
trino emission allows us to rule out a Galactic supernova
With 12 events over the 2010–2018 interval in the
and the very high amplitude and steep decline in flux make
GLIMPSE I survey area, the IRDC covering fractions, f ,
it unlikely that this was an episodic accretion event in a
noted in section 4.1 imply that the chance of observing at
YSO. The steep decline in mid-infrared flux also appears to
least one in an IRDC is p = 1 − (1 − f )12 = 0.13 (including
rule out a Very Late Thermal Pulse in a post-AGB star.
only confirmed IRDCs) or p = 0.24 (including all IRDC can-
The hypothesis of a highly obscured classical nova with
didates). In view of this result, the nova hypothesis appears
a bright dust peak appears to fit all the available data.
very plausible. It was merely surprising, at the time, to de-
Whilst it was initially surprising that such an event should
tect such a chance projection amongst the first VVV tran-
be projected in an IRDC in the first year of the survey, VVV
sients near the start of the survey. A separate search for tran-
subsequently detected several dozen transients in the 2010–
sients in IRDCs was conducted with the WISE/NEOWISE
2018 interval, including 12 in the Spitzer/GLIMPSE region
time series data from 2010 and 2014–2017. We constructed
where the Peretto & Fuller (2009) IRDC catalogue was de-
a variable star and transient source catalogue for all sources
fined. Consequently, the chance of detecting a single such
within 20 of the 7139 confirmed IRDCs listed in Peretto et al.
event over the course of the survey is calculated as between
(2016). This search did not find any additional transients,
13% and 24%, not a very unlikely occurrence.
though some high amplitude variable sources were detected
The protostellar collision/mergeburst hypothesis is the
(Lucas et al., in prep).
most interesting one that we have considered, given that
the remnants of a few such events involving pre-main se-
quence stars have been observed in the Milky Way (Bally
4.7 Upper limit on the protostellar collision rate
& Zinnecker 2005). The rapidly fading 4 cm continuum flux
The ATCA data and the incidence of VVV transients have detected by ATCA appears to be inconsistent with this in-
led us to conclude that VVV-WIT-01 was very probably a terpretation, causing us to favour the nova hypothesis. A
classical nova behind an IRDC. The main caveats are that cautionary note remains that our prediction regarding the
our empirical knowledge of stellar mergers is limited to a radio evolution of a mergeburst rests on theoretical simu-
few probable events and the present generation of numeri- lations in a field that is still maturing. We should remain
cal simulations is unlikely to be the final word. We can use open to the possibility that the transient was a new type
the non-detection of stellar mergers in VVV to place a limit of event. Any detections of additional very red transients
on the incidence of luminous collisions between YSOs. Our in star forming regions would require us to reconsider the
search of the 2010–2018 VVV data spanned ∼8.5 years and classical nova interpretation.
covered an area of sky that encompasses ∼ 1011 stars (as-
suming the Milky Way contains at least twice that number
of stars). Adopting a constant star formation rate (for sim-
ACKNOWLEDGEMENTS
plicity) and typical stellar lifetimes in excess of 1010 yr, a
fraction of order 10−4 , i.e. 107 stars, have ages ≤1 Myr. Our We gratefully acknowledge data from the ESO Public Sur-
detection efficiency is ≈0.5, given that events occurring in vey program ID 179.B-2002 taken with the VISTA telescope,
the southern summer may have been missed by our search. and products from the Cambridge Astronomical Survey Unit
The non-detection in 8.5 years then implies that the rate is (CASU). We thank the referee, Nye Evans, for a helpful and
probably ≤0.2 collisions per year. For 107 YSOs with ages constructive report. We also thank M. Vagins and K. Schol-
≤ 1 Myr, likely to still be in a crowded and dynamically un- berg for checking their neutrino data during the relevant
stable environment, a limit of 0.2 collisions per year implies 2009-2010 time period. This publication makes use of data
MNRAS 000, 1–13 (2019)VVV-WIT-01 11
products from the WISE satellite, which is a joint project Egan M. P., Shipman R. F., Price S. D., Carey S. J., Clark F. O.,
of the University of California, Los Angeles, and the Jet Cohen M., 1998, ApJ, 494, L199
Propulsion Laboratory/California Institute of Technology, Epchtein N., et al., 1999, A&A, 349, 236
funded by the National Aeronautics and Space Adminis- Evans A., et al., 2006, MNRAS, 373, L75
tration (NASA). This research has made use of NASAÕs Finzell T., et al., 2018, ApJ, 852, 108
Fukuda S., et al., 2003, Nuclear Instruments and Methods in
Astrophysics Data System Bibliographic Services and the
Physics Research A, 501, 418
SIMBAD database operated at CDS, Strasbourg, France. Gehrz R. D., 1988, ARA&A, 26, 377
P.W.L. acknowledges support by STFC Consolidated Grants Gehrz R. D., 1999, Phys. Rep., 311, 405
ST/R00905/1, ST/M001008/1 and ST/J001333/1 and the Gehrz R. D., Grasdalen G. L., Hackwell J. A., Ney E. P., 1980a,
STFC PATT grant ST/R00126X/1. D.M. acknowledges sup- ApJ, 237, 855
port from the FONDECYT Regular grant No. 1170121, the Gehrz R. D., Hackwell J. A., Grasdalen G. I., Ney E. P., Neuge-
BASAL Center for Astrophysics and Associated Technolo- bauer G., Sellgren K., 1980b, ApJ, 239, 570
gies (CATA) through grant AFB170002, and the Ministry Gehrz R. D., et al., 2015, ApJ, 812, 132
for the Economy, Development and Tourism, Programa Ini- Gieles M., et al., 2018, MNRAS, 478, 2461
ciativa Cientifica Milenio grant IC120009, awarded to the Gutermuth R. A., Megeath S. T., Myers P. C., Allen L. E., Pipher
J. L., Fazio G. G., 2009, ApJS, 184, 18
Millennium Institute of Astrophysics (MAS). D.L.K. was
Hachisu I., Kato M., 2006, ApJS, 167, 59
supported by NSF grant AST-1816492. N.M. acknowledges
Hachisu I., Kato M., 2019, ApJS, 242, 18
financial support from ASI-INAF contract n.2017-14-H.0. Hajduk M., et al., 2005, Science, 308, 231
M.H. acknowledges financial support from the Comité Mixto Hildebrand R. H., 1983, QJRAS, 24, 267
ESO-Gobierno de Chile. Support for M.C. is provided by Hinkle K., Joyce R., 2002, Ap&SS, 279, 51
Proyecto Basal AFB-170002; by the Ministry for the Econ- Hinkle K. H., Joyce R. R., 2014, ApJ, 785, 146
omy, Development, and Tourism’s Millennium Science Ini- Hjellming R. M., Wade C. M., Vandenberg N. R., Newell R. T.,
tiative through grant IC 120009, awarded to the Millen- 1979, AJ, 84, 1619
nium Institute of Astrophysics (MAS); and by FONDECYT Irwin M. J., et al., 2004, in Quinn P. J., Bridger A., eds,
project #1171273. Proc. SPIEVol. 5493, Optimizing Scientific Return for As-
tronomy through Information Technologies. pp 411–422,
doi:10.1117/12.551449
Johnstone D., Hendricks B., Herczeg G. J., Bruderer S., 2013,
ApJ, 765, 133
REFERENCES Jones C., Dickey J. M., 2012, ApJ, 753, 62
Kamiński T., Schmidt M., Tylenda R., Konacki M., Gromadzki
Ackermann M., et al., 2013, ApJ, 771, 57 M., 2009, ApJS, 182, 33
Ageron M., et al., 2011, Nuclear Instruments and Methods in Kamiński T., Mason E., Tylenda R., Schmidt M. R., 2015, A&A,
Physics Research A, 656, 11 580, A34
Alonso-Garcı́a J., Mateo M., Sen B., Banerjee M., Catelan M., Kasliwal M. M., et al., 2011, ApJ, 730, 134
Minniti D., von Braun K., 2012, AJ, 143, 70 Kimeswenger S., Koller J., Schmeja S., 2000, A&A, 360, 699
Alonso-Garcı́a J., et al., 2017, ApJ, 849, L13 Kochanek C. S., Adams S. M., Belczynski K., 2014, MNRAS, 443,
Alonso-Garcı́a J., et al., 2018, A&A, 619, A4 1319
Antonioli P., et al., 2004, New Journal of Physics, 6, 114 Koenig X. P., Leisawitz D. T., 2014, ApJ, 791, 131
Audard M., et al., 2014, Protostars and Planets VI, pp 387–410 Kóspál Á., et al., 2013, A&A, 551, A62
Bailer-Jones C. A. L., Rybizki J., Fouesneau M., Mantelet G., Krivonos R., Tsygankov S., Lutovinov A., Revnivtsev M., Chu-
Andrae R., 2018, AJ, 156, 58 razov E., Sunyaev R., 2012, A&A, 545, A27
Bally J., Zinnecker H., 2005, AJ, 129, 2281 Kuiper R., Hosokawa T., 2018, A&A, 616, A101
Bally J., Ginsburg A., Arce H., Eisner J., Youngblood A., Zapata Kuiper R., Klahr H., Dullemond C., Kley W., Henning T., 2010a,
L., Zinnecker H., 2017, ApJ, 837, 60 A&A, 511, A81
Baumgardt H., Klessen R. S., 2011, MNRAS, 413, 1810 Kuiper R., Klahr H., Beuther H., Henning T., 2010b, ApJ, 722,
Beckwith S. V. W., Sargent A. I., Chini R. S., Guesten R., 1990, 1556
AJ, 99, 924 Laycock D., Sills A., 2005, ApJ, 627, 277
Benjamin R. A., et al., 2003, PASP, 115, 953 Leibundgut B., Suntzeff N. B., 2003, in Weiler K., ed., Lecture
Bonnell I. A., Bate M. R., Zinnecker H., 1998, MNRAS, 298, 93 Notes in Physics, Berlin Springer Verlag Vol. 598, Super-
Burlak M. A., Esipov V. F., Komissarova G. V., Shenavrin V. I., novae and Gamma-Ray Bursters. pp 77–90 (arXiv:astro-
Taranova O. G., Tatarnikov A. M., Tatarnikova A. A., 2015, ph/0304112), doi:10.1007/3-540-45863-8 6
Baltic Astronomy, 24, 109 Lindegren L., et al., 2018, A&A, 616, A2
Cardelli J. A., Clayton G. C., Mathis J. S., 1989, ApJ, 345, 245 López-Corredoira M., Cabrera-Lavers A., Garzón F., Hammersley
Carey S. J., et al., 2009, PASP, 121, 76 P. L., 2002, A&A, 394, 883
Clayton G. C., et al., 2013, ApJ, 771, 130 Lucas P. W., et al., 2017, MNRAS, 472, 2990
Contreras Peña C., et al., 2017, MNRAS, 465, 3011 Mannucci F., et al., 2003, A&A, 401, 519
Cross N. J. G., et al., 2012, A&A, 548, A119 Martini P., Wagner R. M., Tomaney A., Rich R. M., della Valle
Cutri R. M., et al., 2012, Technical report, Explanatory Supple- M., Hauschildt P. H., 1999, AJ, 118, 1034
ment to the WISE All-Sky Data Release Products Megeath S. T., et al., 2004, ApJS, 154, 367
Dale J. E., Davies M. B., 2006, MNRAS, 366, 1424 Meikle W. P. S., 2000, MNRAS, 314, 782
Das R. K., Banerjee D. P. K., Ashok N. M., Mondal S., 2013, Meisner A. M., Lang D., Schlegel D. J., 2018, AJ, 156, 69
Bulletin of the Astronomical Society of India, 41, 195 Minniti D., 2016, in Galactic Surveys: New Results on Formation,
De K., et al., 2019, The Astronomer’s Telegram, 13130, 1 Evolution, Structure and Chemical Evolution of the Milky
Diehl R., et al., 2015, A&A, 574, A72 Way. p. 10
Drew J. E., et al., 2014, MNRAS, 440, 2036 Minniti D., et al., 2010, New Astron., 15, 433
MNRAS 000, 1–13 (2019)12 P. W. Lucas et al.
Minniti D., Lucas P. W., Cross N., Ivanov V. D., Dekany I.,
Kurtev R., 2012, The Astronomer’s Telegram, 4041
Miville-Deschênes M.-A., Murray N., Lee E. J., 2017, ApJ, 834,
57
Moeckel N., Bonnell I. A., 2013, Primordial triples and collisions
of massive stars (arXiv.:1301.6959)
Molinari S., et al., 2010, A&A, 518, L100
Moorwood A., et al., 1998, The Messenger, 94, 7
Myers P. C., 2009, ApJ, 700, 1609
Odrzywolek A., Plewa T., 2011, A&A, 529, A156
Oh K., et al., 2018, ApJS, 235, 4
Osborne J. P., 2015, Journal of High Energy Astrophysics, 7, 117
Pastorello A., et al., 2019, A&A, 625, L8
Peretto N., Fuller G. A., 2009, A&A, 505, 405
Peretto N., et al., 2013, A&A, 555, A112
Peretto N., Lenfestey C., Fuller G. A., Traficante A., Molinari S.,
Thompson M. A., Ward-Thompson D., 2016, A&A, 590, A72
Railton A. D., Tout C. A., Aarseth S. J., 2014, Publ. Astron. Soc.
Australia, 31, e017
Rawiraswattana K., Lomax O., Goodwin S. P., 2012, MNRAS,
Figure A1. VVV K s light curve for the submm-bright source
419, 2025
VVV J161053.93-515532.8. A jump of ∼0.9 mag occurred in mid-
Reynolds S. P., Borkowski K. J., Green D. A., Hwang U., Harrus
2015, lasting for at least 13 days. The flux had returned to the
I., Petre R., 2008, ApJ, 680, L41
pre-outburst level in data taken 12 months later. The inset panel
Rieke G. H., et al., 2004, ApJS, 154, 25
shows an expanded view of the data during the outburst.
Saito R. K., et al., 2012, A&A, 537, A107
Saito R. K., Minniti D., Angeloni R., Dekany I., Catelan M., 2015,
The Astronomer’s Telegram, 7124
Saito R. K., Minniti D., Catelan M., Angeloni R., Beamin J. C.,
Palma T., Gutierrez L. A., Montenegro K., 2016, The As-
515532.8, that is visible about 500 east of VVV-WIT-01
tronomer’s Telegram, 8602 in the middle panel of Fig. 3. This red star has mean
Schechter P. L., Mateo M., Saha A., 1993, PASP, 105, 1342 K s = 15.39 mag, H − K s =1.66, J − H>3. The VVV/VVVX K s
Seaquist E. R., 2008, in Bode M., Evans A., eds, , Classical Novae, light curve is shown in Fig. A1. Our Spitzer/IRAC data (see
2nd Edition., No. 43. Cambridge University Press section 3.1) give magnitudes I2 = 12.39, I1 − I2 = 0.71.
Shara M. M., 2002, in Shara M. M., ed., Astronomical Society The infrared colours and fluxes are typical for a low
of the Pacific Conference Series Vol. 263, Stellar Collisions, mass class I or class II YSO (Megeath et al. 2004; Gutermuth
Mergers and their Consequences. p. 1 et al. 2009) at a distance of a few kpc and in view of the pro-
Simon R., Rathborne J. M., Shah R. Y., Jackson J. M., Chambers jected location in an IRDC it is likely that VVV J161053.93-
E. T., 2006, ApJ, 653, 1325
515532.8 is indeed a YSO. The K s light curve clearly shows
Simpson R. J., et al., 2012, MNRAS, 424, 2442
Skrutskie M. F., et al., 2006, AJ, 131, 1163
an infrared outburst of 0.9 mag amplitude in the data taken
Soker N., Tylenda R., 2006, MNRAS, 373, 733 on 30 June and 13 July 2015 (MJDs 57203 and 57216). This
Strope R. J., Schaefer B. E., Henden A. A., 2010, AJ, 140, 34 further supports a YSO identification, in view of the fact
Sutherland W., et al., 2015, A&A, 575, A25 that high amplitude variability is fairly common in YSOs
Tylenda R., Soker N., 2006, A&A, 451, 223 (Contreras Peña et al. 2017). The infrared burst faded by
Tylenda R., et al., 2011, A&A, 528, A114 0.08 mag over the 13 days between the two dates of obser-
Wang X., Fields B. D., Lien A. Y., 2019, MNRAS, 486, 2910 vation. The infrared flux was otherwise fairly constant from
Warner B., 1987, MNRAS, 227, 23 2012–2018 and was observed at the quiescent level on 2015
Weiler K. W., Sramek R. A., 1988, ARA&A, 26, 295 May 19 and 2016 July 5. A slow 0.25 mag decline was seen
Williams G. M., Peretto N., Avison A., Duarte-Cabral A., Fuller
from 2010 to 2011.
G. A., 2018, A&A, 613, A11
The ALMA continuum detections can be attributed to
emission by dust in the cool outer regions of a circumstel-
lar disc. This would be consistent with the non-detection in
band 3, due to the decline in dust emissivity with increas-
APPENDIX A: A SUBMM-BRIGHT VARIABLE
ing wavelength. We can estimate the dust mass with the
YSO IN SDC G331.062−0.294
equation Mdust = (Fν d2 )/(κν Bν (T )) (Hildebrand 1983). Adopt-
As noted in section 3.4, the ALMA follow up observations of ing T = 20 K and opacity κ = 10(ν/1000)β GHz cm2 g−1
VVV-WIT-01 did not detect the transient but a submm/mm and β = 1 (Beckwith et al. 1990) yields a mass Mdust =
continuum source was detected 4.500 to the east. The submm 5 × 10⁻⁴ (d/3 kpc)2 M . Adopting the conventional gas to
flux was 0.62 ± 0.04 mJy in band 6 (230 GHz) and 0.86 ± 0.06 dust ratio of 100:1, this implies Mdisc = 0.05(d/3 kpc)2 M .
mJy in band 7 (336.5 GHz). It was not detected in band 3 Recalling that the distance to SDC G331.062−0.294 is likely
(100 GHz) to a 3σ limit of 0.14 mJy. The band 6 observations to be between 3.1 and 7.4 kpc, this indicates that the YSO
were obtained on 2015 August 14 and 2015 September 4 and hosts a relatively massive disc, or perhaps an unusually
the band 7 observations were on 2015 September 25. The warm one. It is certainly possible that the infrared outburst
beam sizes were 0.500 , 0.300 and 0.2500 , in band 3, band 6 and was ongoing at the time of the ALMA detections in August
band 7, respectively. The ALMA source is coincident (within and September 2015, resulting in heating of the outer disc
0.100 ) with the red VVV point source, VVV J161053.93- (Johnstone et al. 2013).
MNRAS 000, 1–13 (2019)You can also read