Water vulnerabilities mapping: a multi-criteria and multi-scale assessment in central Chile
←
→
Page content transcription
If your browser does not render page correctly, please read the page content below
© 2022 The Authors                                                        Water Policy Vol 24 No 1, 159 doi: 10.2166/wp.2021.116

            Water vulnerabilities mapping: a multi-criteria and multi-scale assessment
            in central Chile

            Martin Paegelow a,*, Jorge Quenseb, Anne Peltiera, Cristian Henríquez Ruizb,c,d, Lucie Le Goffa,
            Federico Arenas Vásquezb and Jean-Marc Antoinea
            a
              Département de Géographie and GEODE-UMR 5602 CNRS, Université Toulouse Jean Jaurès, 5 allées Antonio Machado, Toulouse cedex 31058,
            France
            b
              Instituto de Geografía, Pontificia Universidad Católica de Chile, Vicuña Mackenna 4860, Macul, Chile
            c
              Centre for Sustainable Urban Development, CEDEUS, Santiago, Chile
            d
              Centro Interdisciplinario de Cambio Global UC, Santiago, Chile
            *Corresponding author. E-mail: paegelow@univ-tlse2.fr

                MP, 0000-0001-9254-5312

            ABSTRACT

            One of the major challenges that populations have to face is vulnerability to water: lack of water, flooding, pollution, hazard sen-
            sitivity and coping capacity. Owing to economic, social and environmental inequalities, this paper focuses on water-related
            vulnerabilities in the Metropolitan Region of Santiago (RMS) in Chile. Our main objective is to understand, through mapping, the
            multiscalar logics of water vulnerability. This study is carried out at two scales: at the regional level (RMS), we proceed with
            open access municipal statistical data and maps, while at the local level, a more detailed analysis focusing on the Chacabuco Pro-
            vince is based on the same type of data but with either a higher spatial resolution (census districts) or a spatially more intensive data
            processing in order to take into account intra-municipal differences. In this way, we put into perspective the discourse developed in
            the Chilean media and by the inhabitants of Chacabuco Province regarding the province as an environmental ‘sacrifice zone’ for the
            RMS. The vulnerability maps are carried out at different scales in a simple and reproducible way by multi-criteria evaluation (MCE).
            The results confirm the hypothesis of a sacrifice zone and show that high-resolution data and adequate data processing give, on
            average, lower vulnerability scores than using only statistical data on the municipal level. The results provide a cartographic
            decision support for stakeholders. Limitations of the study are discussed and required further research is pointed out.

            Key words: Metropolitan Region of Santiago, Multi-criteria evaluation, Risk-taking, Trade-off, Water vulnerability

            HIGHLIGHTS

           •    Multi-criteria and multi-scale assessment to map water vulnerabilities in the Metropolitan Region of Chile.
           •    Use of scale dependant data and critical analysis of benefits of higher spatial resolution data.
           •    Use of open access data to allow mapping generalization.
           •    The calculation of several scenarios varying trade-offs and risk levels can support better decision-making.

            INTRODUCTION
            The studies carried out on social vulnerability over the last three decades have shown the extent to which
            societies are fragile in relation to the fluctuations of their environment and to the threats induced by human

            This is an Open Access article distributed under the terms of the Creative Commons Attribution Licence (CC BY-NC-ND 4.0), which permits
            copying and redistribution for non-commercial purposes with no derivatives, provided the original work is properly cited (http://
            creativecommons.org/licenses/by-nc-nd/4.0/).

Downloaded from http://iwaponline.com/wp/article-pdf/24/1/159/1003739/024010159.pdf
by guest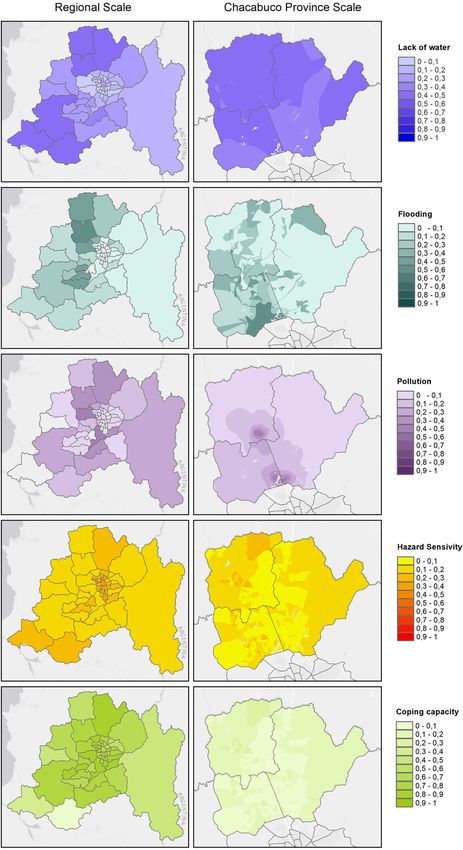
Water Policy Vol 24 No 1, 160

                 activities. However, the vulnerability approach to risk has not much percolated down to the population, in par-
                 ticular, because vulnerability has a negative connotation, unlike a term such as resilience, which has a positive,
                 proactive connotation (Quenault, 2015). When situations of vulnerability become too unbearable, other terms are
                 used by people, associations and researchers, such as ‘sacrifice zone’ (Lerner, 2010; Shade, 2015), which has re-
                 emerged in Chile in recent years in response to the concentration of polluting industries in some sectors of the
                 country (Programa de Reducción de Riesgos y Desastres, 2020; Valenzuela-Fuentes et al., 2021).
                    The confrontation with one of these areas, the Chacabuco province, in the north of the Santiago metropolitan
                 area (Metropolitan Region of Santiago, RMS), considered by the media, associations and inhabitants as an
                 environmental ‘sacrifice zone’, during a fieldwork with a focus on water, led us to begin this research. The charac-
                 terization of the province, especially the municipality of Tiltil, as a sacrifice zone, is due to the concentration of
                 polluting activities (mine tailings, cement factory, industrial piggery and old gold mines) with a high water con-
                 sumption level and a high polluting potential (Jorge et al., 2020). Two of the three municipalities of the
                 Chacabuco province were moreover openly chosen by the region to locate its polluting infrastructures: ‘danger-
                 ous production activities duly authorised by the competent authorities may only be located on the territory of the
                 municipalities of Lampa and Tiltil’ (Gobierno regional Region metropolitana de Santiago, 1997). Combined with
                 a water governance that is usually recognized as particularly unequal (Budds, 2020), this development policy has
                 led to the qualification of this area as a ‘sacrifice zone’, which is why we have chosen to focus on it. We wanted to
                 know to what extent the Chacabuco Province was different from the other provinces of the Metropolitan Region.
                 We wanted to identify whether it was possible to perceive, through the mobilization of spatialized statistical indi-
                 cators, if this area was sacrificed in relation to the rest of the urban agglomeration.
                    We have therefore chosen to focus on the vulnerability of this area to water-related risks. The issue of access to
                 sufficient quantities of water of satisfactory quality is indeed a minimum right of the population. The greater or
                 lesser vulnerability of metropolitan populations to water-related risks is therefore a good indicator of the margin-
                 alization of the territories concerned and therefore an indicator of the fact that these territories are left out by the
                 public authorities, which potentially reinforces its character as a ‘sacrifice zone’.

                 LITERATURE REVIEW
                 The notion of sacrifice zone emerged during the 1970s in the USA, regarding the consequences of a nuclear
                 explosion. It refers commonly to ‘areas negatively impacted by environmental degradation and/or pollution
                 that harms nearby residents for broader economic gains elsewhere’ (Randolph, 2021).
                    Since the 1970s and the development of the research field of environmental justice (EJ) (McGurty, 1997), it has
                 been recognized that there is a link between the concentration of polluting infrastructures and the presence of
                 poor and marginalized populations (Bullard, 1999). This is due to a ‘complex sociohistorical process’ (Pellow,
                 2000): on the one hand, polluting infrastructures are more likely to be located in areas where they appear to
                 be an opportunity for development rather than a nuisance, and, on the other hand, the concentration of polluting
                 infrastructures devalues the land and encourages the arrival of low-income populations. These territories thus
                 accumulate difficulties: pollution, threats to health and poverty constituting an obstacle to the mobilization of
                 the inhabitants and representing areas of high vulnerability to environmental risks.
                    Social vulnerability is generally considered to be ‘the susceptibility of a given population, system or space to be
                 adversely affected by exposure to a hazard, directly affecting the ability to prepare for, respond to and recover
                 from hazards and disasters’ (Cutter et al., 2009). It has been approached in a variety of ways. The analysis can
                 be hazard-centric (Gilbert, 2009) when vulnerability is analysed in relation to a hazard, but the hazard can
                 also be considered as a secondary variable when the focus is on the factors that construct vulnerability (e.g.,

Downloaded from http://iwaponline.com/wp/article-pdf/24/1/159/1003739/024010159.pdf
by guest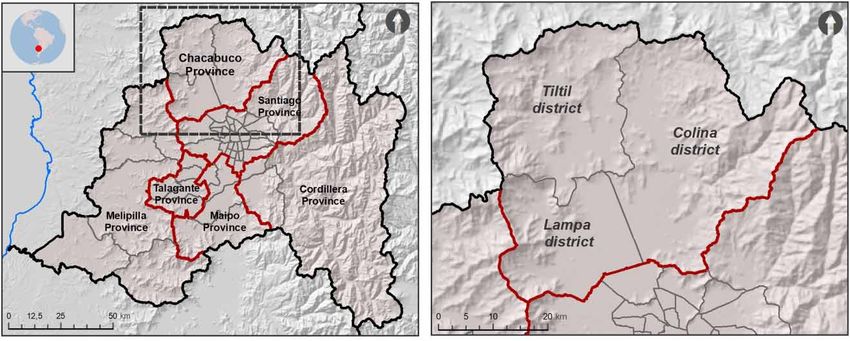
Water Policy Vol 24 No 1, 161

            in the Pressure and Release model of Blaikie et al., 2004) or on social inequalities as the main factor of vulner-
            ability (Gaillard et al., 2007; Wisner, 2016).
               The components of social vulnerability are identified differently depending on the research community, the
            time period and the disciplinary affiliation. Birkmann & Wisner (2006) identify five components of vulnerability:
            physical, social, economic, environmental and institutional. Rufat (2017) distinguishes between biophysical vul-
            nerability (potential losses and damage), social vulnerability (relating to the capacity of societies to cope,
            materially, morally, politically and economically) and functional vulnerability, which refers to the organization
            of territories and the management of the event. Cutter & Finch (2008, p. 2301) note that the scientific commu-
            nities working on vulnerability, whether they approach it through natural risks and disasters or through global
            environmental change, agree on the fact that ‘the composition of vulnerability is driven by exposure, sensitivity,
            and response (carrying capacity or resilience), and it requires measurements of both environmental and social
            systems, the latter being less prevalent in the literature’.
               In particular, research conducted since the 2000s has highlighted the difficulty of measuring social vulnerability
            and, more broadly, of operationalizing it. Birkmann and Wisner entitled their 2006 publication ‘Measuring the
            un-measurable’, while Rufat (2017) highlights the difficulties of assessing vulnerability, in particular, because of
            the lack of empirical studies to support the choice of assessment criteria. Boissier (2013) shows, for example,
            that during a flood, women are less often victims than men, even though they are systematically considered
            more vulnerable.
               We have chosen to use a fairly consensual approach of vulnerability, combining exposure, sensitivity and
            coping capacity (Cutter & Finch, 2008; Cardona et al., 2012), insofar as it makes it possible to take account of
            the sources of danger (Cutter et al., 2009) but also of the response of societies by going beyond simple socioeco-
            nomic criteria. Exposure refers to being in an area likely to be affected by a hazard. Sensitivity describes the
            magnitude of the possible consequences of the event in relation to the fragility of the society. Coping capacity
            characterizes society’s ability to respond to the event.
               Quantitative approaches, which serve as a basis for statistical mapping, are thus confronted with various diffi-
            culties related to data access: unavailable data (a problem that is tending to diminish given the efforts to provide
            free access to data of general interest), non-homogeneous data, and data unavailable at the considered spatial or
            temporal scales. Another category of difficulty relates to the choice of data, given the diversity of approaches high-
            lighted above, the complexity of the factors generating vulnerability (Villagran de Leon, 2006; Cutter et al., 2009)
            and the sometimes subjective nature of the used indicators (Rufat, 2017). These limitations should obviously not
            prevent any attempt at mapping, but they must be taken into account when interpreting the results. Despite these
            difficulties, Joerin & Musy (2000) have already underlined useful cartographical diagnostics for territorial
            decision-making processes based on geographical information systems and multi-criteria analysis. At the same
            time, Sullivan et al. (2002) were among the first offering a quantitative and multi-dimensional approach applied
            to define water poverty indexes (WPIs). To continue on the example of WPI, we can quote Gong et al. (2017) who
            demonstrate that this index is traditionally calculated for administrative units such as countries, regions and
            municipalities.
               Wurtz et al. (2019) illustrate the above-mentioned problems related to data and data aggregation as well as the
            advantages of the chosen multi-criteria evaluation (MCE) allied to the calculation of a WPI in Mexico. Another
            sophisticated approach is that elaborated by Dong et al. (2020). This method, however, gives quantitative results
            without mapping them. Applied to measure the vulnerability of urban water infrastructures facing flood and
            drought risks, the authors carried out a complex quantitative approach measuring the vulnerability based on a
            very large number of indicators related to vulnerability dimensions such as physical, social, economic and

Downloaded from http://iwaponline.com/wp/article-pdf/24/1/159/1003739/024010159.pdf
by guest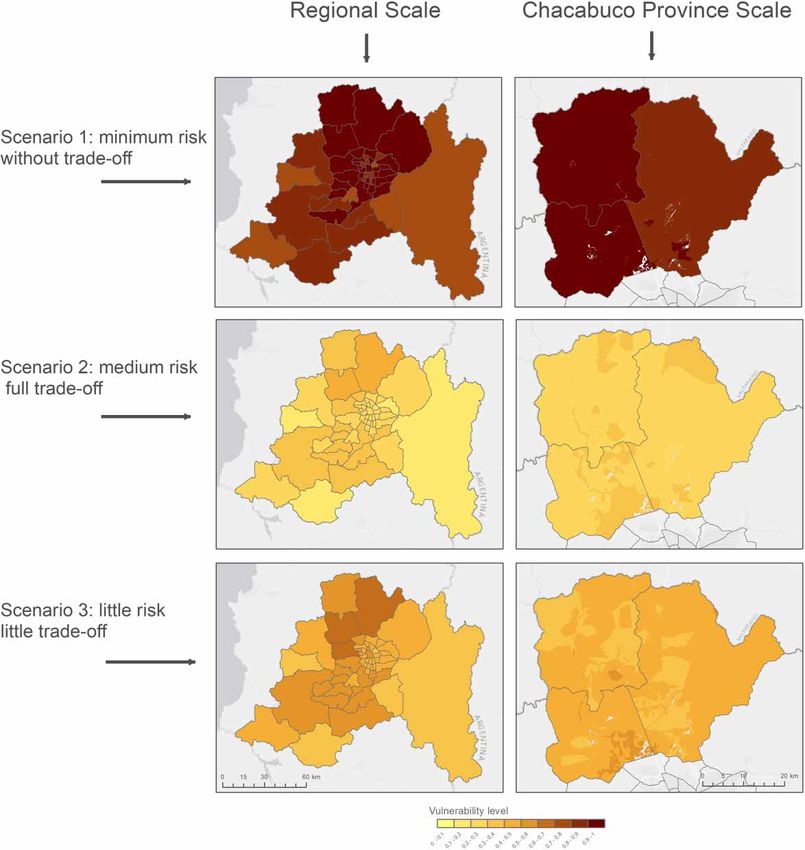
Water Policy Vol 24 No 1, 162

                 environmental dimensions. The authors combine and weight the sensitivity data by matrix techniques and
                 applied their method to various Chinese cities.
                    The advantage of the MCE approach can be shown by comparison with more generic and well-known EJ web
                 mapping tools such as USEPA’S (United States Environmental Protection Agency) EJSCREEN (Environmental
                 Justice Screening and Mapping Tool) or Berkley’s MEJ (Mapping for Environmental Justice). EJSCREEN (2021)
                 combines 11 EJ indexes. They are weighted by a so-called demographic factor including income and proportion of
                 minorities. The weighting consists in the difference between the local census district and the national average.
                 The interactive tool gives statistic indexes for each of the 11 environmental indicators whose spectrum is very
                 wide and not focused on water. Also, there is no combination of indicators, nor devices to limit trade-off and
                 risk-taking during the decision-making process.
                    Berkeley’s MEJ (2021) is another interactive web-mapping tool for EJ. It considers environmental, public health
                 and socioeconomic disparities. The map tool shows a cumulative EJ impact, while by clicking on the map, a pop-
                 up window gives numeric details for each indicator. The cumulative, mapped, EJ impact results from averaging
                 the sensitive population factor and the socioeconomic factor themselves made up of several single factors such as
                 poverty and people of colour (socioeconomic factor). It is the same for the two other factors, called exposure and
                 environmental effects, which also group together several individual indicators. The two resulting combinations
                 are finally multiplied.
                    Both examples, EJSCREEN and MEJ, are first generic EJ measurement tools and second rather mechanical
                 arithmetic combinations without sophisticated weighting tools or trade-off and risk-managing mechanisms
                 such as provided by MCE. Particularly MCE’s ordered weighted averaging (OWA) technique offers a sort of sen-
                 sitivity analysis.

                 DATA AND METHODS
                 Our research has a central goal of identifying the most vulnerable areas inside the RMS and especially the Cha-
                 cabuco Province. To analyse vulnerabilities, we will consider various criteria and combine them by MCE. To
                 verify the ‘sacrifice zone’ hypothesis, this study will be carried out at two scales: on a regional level (RMS) analy-
                 sis is using easily and open access municipal statistical data and maps then a more detailed analysis is focusing on
                 the Chacabuco Province using the same type of data but with a higher spatial resolution (e.g., census districts or
                 distance-based variables). Applying this method, the authors intend to identify the most vulnerable areas in the
                 RMS and in the Chacabuco Province and to compare them taking into account the used data.
                    On the regional scale, the study area corresponds to RMS made up of 6 provinces and 52 municipalities, while,
                 on the local scale, the study area corresponds to the territory of Chacabuco Province (see Figure 1) including the
                 municipalities of Colina, Lampa and Tiltil. The Chacabuco Province is located in the north of the RMS, occupy-
                 ing an area equivalent to 13% of the regional area; the RMS has an extent of 1.53 million ha.
                    Demographically, more than 7 million inhabitants (7,112,808, according to INE 2017) are living in RMS,
                 including 267,553 (3.7%) located in the Chacabuco Province. The urban population of the whole region reaches
                 92.3% of the total population, while its proportion in Chacabuco is about 79.1%.
                    The growth of the urban area in the Chacabuco Province is higher than in the entire region: from 2,120 ha in
                 2002 to about 9,230 ha in 2017. This means a net growth of 474 ha/year on average (Table 1).
                    This urban growth, during the last decade, is also reflected in rapid demographic growth, the creation of infra-
                 structures and real estate projects (Lukas et al., 2020).
                    During the 1970s and 1980s, Chacabuco was an eminently rural province. The rural population, according to
                 the 1982 census, was about 46.5% of the total population spread over various locations of less than 5,000 inhabi-
                 tants. The towns of Colina, Lampa and Tiltil are the most important urban centres of the province.

Downloaded from http://iwaponline.com/wp/article-pdf/24/1/159/1003739/024010159.pdf
by guest
Water Policy Vol 24 No 1, 163

            Fig. 1. | Study area: Santiago Metropolitan Region (RMS) and Chacabuco Province.

              Population growth was the result of the location of social housing in the vicinity of urban centres (Armijo,
            2000) and then of the deployment of high-level plots and high-income housing, especially in the municipality
            of Colina. In this sense, the study area is representative of many of the changes that occurred in the country,
            associated with the process of urban-metropolitan transformation, described in Hidalgo et al. (2009).
              This analysis is voluntarily based on open and easily accessible data with the aim to propose an approach that
            would be reproducible at different spatial scales and in different geographical contexts. We therefore began by
            identifying the indicators generally used in the literature (Blaikie et al., 2004; Birkmann & Wisner, 2006;
            Villagran de Leon, 2006; Cutter et al., 2009; Plummer et al., 2012; Gonzáez Tanago et al., 2015; Carrão et al.,
            2016; Rufat, 2017).
              From these indicators, we selected those that allowed us to characterize the three components of vulnerability
            that we had selected, namely exposure, sensitivity and coping capacity, distinguishing, with regard to exposure,
            the types of hazards considered: lack of water, water quality and flooding.
              Finally, the number of indicators was drastically reduced according to several criteria:

           •   Strong contribution of an indicator to the production or reduction of vulnerability, even if it only indirectly cap-
               tures the situation. For example, it is commonly accepted that a high degree of sociability contributes to a better
               capacity to cope, insofar as the social ties that existed before the disaster are transformed into solidarity ties

            Table 1. | Consolidated urban area.

            Province                                    Urban area 2002 (ha)          Urban area 2017 (ha)              Net growth 2002–2017

            Chacabuco                                   2,119.2                       9,231.9                           7,112.7
            Mountain range                              4,420.2                       6,412.8                           1,992.6
            Maipo                                       5,268.9                       10,352.2                          5,083.3
            Melipilla                                   1,463.2                       2,475.3                           1,012.1
            Santiago                                    54,839.0                      60,676.2                          5,837.2
            Talagante                                   2,911.1                       6,043.2                           3,132.1
            Source: Ministerio de Vivienda y Urbanismo (2018).

Downloaded from http://iwaponline.com/wp/article-pdf/24/1/159/1003739/024010159.pdf
by guest
Water Policy Vol 24 No 1, 164
during the disaster (Revet, 2007). As we were unable to characterize the social links in each commune precisely
through a social survey, we mobilized the number of associations per 1,000 inhabitants for each commune.
• Limiting redundancies between indicators as much as possible. For example, the use of the index of multidimen-
sional poverty (including access to water, income and educational level) from the CASEN survey allowed us to
avoid using other indicators relating to the standard of living.
• Mobilization of indicators immediately available for analysis on the regional scale and indicators that are easy
to produce on the local, infra-municipal scale (e.g., analysis by photointerpretation of torrential basins threaten-
ing inhabited areas).
Data
Following the above-mentioned specifications leads us to distinguish between five metacriteria, also called vulner-
ability dimensions: lack of water, flooding, pollution, hazard sensitivity and coping capacity. Each of which is
split into several elementary criteria (Table 2). While the metacriteria are rigorously the same at both scales,
some basic indicators, on the local level, have either finer spatial resolution or are changed in order to take advan-
tage of more detailed information the elaboration of which, for the entire region, however, would be too costly in
time and not compatible with the requirement of an easily reproducible method.
This means that the intensity of the implementations depends on the geographical scale and, consequently, on
the extent of the study area. At the local level, the census data for the three municipalities are broken down into
about 2,000 territorial units formed by house blocks (manzana) in urban areas and rural census districts (entidad
rural) in rural territories. For other data, on the local scale, we used a 10 m pixel resolution. Also, the data pre-
processing and analysis is more thorough on the local level (Chacabuco) than the regional one. For instance, we
summed up potentially polluting activities or the number of health centres and fire stations at the RMS scale,
while we mapped the distance to them at the local level. The authors proceeded in a comparable manner with
ravines – counting them at the RMS level but focusing on material and human stakes at the Chacabuco level –
while splitting one criterion (multidimensional poverty) into three more relevant criteria when working at the
finer scale.
Data pre-processing includes conversion into raster format (100 m resolution at the RMS scale, 10 m at the
Chacabuco scale), standardization of coordinate reference systems, some analytical steps as computing distance
maps, and spatial interpolation (Benson index isolines) analysis of stakes (ravines) and, at the local level, identify-
ing all public territories which do not form census units like, among others, rivers, roads and places.
MCE and implementation
MCE is a large group of decision-making methods handling various relevant data for a given objective which,
mostly, is to compute a potential map that may thematically signify suitability or vulnerability. The authors
rely on Eastman et al.’s (1993) and Yager’s (1988) technique, splitting criteria into constraints and factors.
First, masking space, are Boolean and map whether or not the objective is possible. The latter expresses a con-
tinuous variation of the amount of vulnerability (0 means no vulnerability while 1 shows maximally vulnerable
territories). In the sense of Eastman et al. (1993) and Yager (1988), implemented in TerrSet software, MCE is
a three-step procedure (Paegelow, 2018):
• Factor standardization: each factor, mapped in original units such as metres, degrees or $, will be converted into
a vulnerability index (0 to 1) using various fussy membership functions.
• Factor weighting: once standardized, each factor is weighted by various techniques such as the Saaty matrix
(Saaty, 1987) leading to the factor eigenvector.
Downloaded from http://iwaponline.com/wp/article-pdf/24/1/159/1003739/024010159.pdf
by guestWater Policy Vol 24 No 1, 165
Table 2. | Criteria and data used at RMS and Chacabuco scale.
Metacriteria and criteria RMS scale Chacabuco scale
Lack of water
Drought severity District average Pixel value
(Benson index) Source: Sarricolea and Meseguer-Ruiz (2015)
Number of declarations of Declaration of water depletion is weighted three times more important than water
water shortage and shortage. Data from 2008 to 2017
depletion Source: IDE Chile
% of irrigated crops/total Source: Censo agropecuario Chile 2007
cultivated land
Population growth rate At district level; census 2002 and 2017 (the 2012 census has errors; infra municipality
2002–2017 (%) data not available for 2002/different spatial division)
Source: Census 2002 and 2017, INE (Instituto Nacional de Estadísticas)
Flooding
% flood area in Source: PRMS – IDE Chile (2017)
municipality
Ravines Number of ravines per district Material stake (2) or human stake
(3¼isolated housings/4) in case of
grouped settlement
Analysis based on ortho photographs
Source: PRMS – IDE Chile (2017)
Type of flood (aquifer District average Exact map extent
rise¼1/other¼2/both¼3) Source: PRMS – IDE Chile (2017)
Pollution
Water quality (%) Average of bacteriology, turbidity, free chlorine, control parameters
Missing data: quality¼100%
Source: SiSS (Superintendencia de Servicios Sanitarios) 2018
Potentially polluting Mining, tailing dams, quarries, nuclear centre, Distance to: mining and industrial
activities thermal power station, industrial activities activities, waste centres, wastewater
Sum per district discharges
Source: IDE Chile, Open Street Map (OSM) Source: IDE Chile, OSM
Hazard sensitivity
Population density District average Average per house block or rural
(hab/km2) Source: Census 2017 district
Source: Census 2017
% immigrants % of born abroad (district) % of born abroad (house block/rural
Source: Census 2017 district)
Source: Census 2017
% children and seniors % of less than 15 years and more than 64 % of less than 15 years and more than
years (district average) 64 years (house block/rural district)
Source: Census 2017 Source: Census 2017
(Continued.)
• OWA: it allows different scenarios of vulnerability maps by graduating the trade-off and risk level (Wurtz et al.,
2019). To do so, a virtual table of all map locations computes the ascending sorting of factors followed by apply-
ing a so-called lot of order weights to each sorting level.
Downloaded from http://iwaponline.com/wp/article-pdf/24/1/159/1003739/024010159.pdf
by guestWater Policy Vol 24 No 1, 166
Table 2. | Continued
Metacriteria and criteria RMS scale Chacabuco scale
Social and economic fragility Index of multidimensional poverty (including % of households without drink water
access to water, income and educational access (water carried by truck or
level) providing directly from river)
Source: CASEN (Caracterización Source: Censo 2017
Socioeconómica Nacional) Observatorio % buildings whose state is deemed
Social, 2015 unrecoverable
Source: Censo 2017
Years of schooling
Source: Censo 2017
Coping capacity
Health centres and Number of public hospitals, private clinics and Distance to public hospitals, private
firefighters fire stations clinics and fire stations
Source: IDE Source: IDE
Number of associations in District average
activity for 1,000 habitants Source: https://www.portaltransparencia.cl/PortalPdT/pdtta/-/ta/AK002/OA/PJSFL
District budget/habitant ($) District average
Source: https://chiledescentralizado.cl/presupuesto-por-habitante-comunas-tienen-
diferencias-de-hasta-ocho-veces/
Unless there are justified reasons, we implement MCE techniques the same way to all criteria on both scales.
• Factor standardization: criteria transformation into factors was achieved with linear fuzzy membership func-
tions. Control points (minimum/maximum vulnerability) is either data-specific values or 0 and 100% (for
instance the rate of vulnerable population). For details, see Table 3. If not mentioned, the indicated implemen-
tation is valid for both scales. Without specific mention, the linear membership function is increasing. An
example for different control points when transforming criteria into vulnerability factors, expressed on a uni-
form scale reaching from 0 (no vulnerability) to 1 (maximum vulnerability) resulting from same data, is
criteria type of flood which is the nature of flood. At the RMS scale, we computed the municipal average of
the danger reaching from 0 to 0.92, while interval bounds are 0 and 3 at the pixel level (Chacabuco scale).
Other differences result from the pre-processing of the data. So, we only summed up the number of ravines
at the RMS scale while analysing the material or human stake downstream of the ravine.
• Factor weighting: in the absence of significant data, the authors give the same weight to each metacriterion
(20%). Inside, we split the eight equally. A minor exception was operated inside the meat criterium ‘coping
capacity’ where health centres and fire stations get a weight slightly higher than associative fabric and the finan-
cial power of the townships.
• OWA: the authors computed three vulnerability maps.
o The strictest one considers only the, locally, most vulnerable factor. This scenario is called minimum risk
without trade-off.
o The second vulnerability map makes the average of all individual factors. This means that a factor showing,
locally, a high vulnerability may be compensated by another, at the same location low vulnerability factor.
This scenario is called: medium risk full trade-off.
Downloaded from http://iwaponline.com/wp/article-pdf/24/1/159/1003739/024010159.pdf
by guestWater Policy Vol 24 No 1, 167
Table 3. | MCE implementation on criteria.
Metacriteria and criteria Standardization Weight (%)
Lack of water 20%
Drought severity (Benson index) 0.3 to 0.7 5
Number of declarations of water shortage and depletion 0 to 4 5
% of irrigated crops/total cultivated land 0 to 100 5
Population growth rate 2002–2017 (%) 0 to153 5
Flooding 20%
% flood area in district 0 to 100 6.66
Ravines 0 to 208 (RMS)/0 to 4 (Chacabuco) 6.66
Type of flood (aquifer rise¼1/other¼2/both¼3) 0 to 0.92 (RMS)/0 to 3 (Chacabuco 6.66
Pollution 20%
Water quality (%) 100 to 0 (–) 10
Potentially polluting activities 10
Hazard sensitivity 20%
Population density (hab/km2) 0 to 17,500 (RMS) 3.33
0 to 77,000 (Chacabuco)
% immigrants 0 to 100 3.33
% children and seniors 0 to 100 3.33
RMS 10
Social and economic fragility (%) 0 to 100 (RMS)
Chacabuco
Households without drink water (%) 0 to 100 3.33
Unrecoverable buildings (%) 0 to 100 3.33
Years of schooling 9 to 0 (–) 3.33
Coping capacity 20%
Health centres and firefighters (number/distance 0 to 109 (RMS)/0 to 16,500 m 7
Number of associations in activity for 1, 000 habitants 30 to 0 (–) 6
District budget/habitant ($) 1, 000,000 to 100,000 (–) 7
o A third scenario of vulnerability is intermediate to twice. Locally, we apply a higher-order weight to factors
showing more vulnerability than factors presenting a lesser vulnerability and the same place. We called it
little risk, little trade-off.
RESULTS
Before showing the global vulnerability maps, we present first the specific vulnerability for each of the five con-
sidered vulnerability dimensions. Figure 2 shows these maps which express the average of the weighted criteria
(cf., Table 3) for each scope.
At the regional scale (RMS), differences are pronounced as on the census district level for Chacabuco. This is
related, on the one hand, to differences between the municipalities and, on the other hand, to either spatially finer
resolution data, or to the employed technique using more continuous maps as distance maps for Chacabuco while
Downloaded from http://iwaponline.com/wp/article-pdf/24/1/159/1003739/024010159.pdf
by guestWater Policy Vol 24 No 1, 168
Fig. 2. | Vulnerability maps for each vulnerability dimension and scale.
Downloaded from http://iwaponline.com/wp/article-pdf/24/1/159/1003739/024010159.pdf
by guestWater Policy Vol 24 No 1, 169
summing up and averaging at the RMS scale, or to both. We have to remember that the reproduction scale does
not allow us to show full details: some urban census house blocks are too small to be represented at this scale.
Generally, we notice an important gain in detail when using census units or 10 m pixel cells.
For global vulnerability, we present three scenarios (Figure 3).
Scenario 1 is the worst-case scenario. Among 16 (18 for Chacabuco) factors, the locally most vulnerable is
selected. This is clearly a risk-avoiding strategy but with the consequence that only one factor is retained for
each spatial unit without any trade-off.
Scenario 2 shows the most balanced maps because of the map elaboration process: maps show the average of
all, weighted, factors. This means full trade-off between critical and less critical factors.
Fig. 3. | Different vulnerability scenarios for RMS and Chacabuco.
Downloaded from http://iwaponline.com/wp/article-pdf/24/1/159/1003739/024010159.pdf
by guestWater Policy Vol 24 No 1, 170
Scenario 3: While scenario 2 works without any trade-off limit, compensation between factors, especially the
most critical ones, is limited but order weights give more importance to critical factors as factors without danger
when considering the specific ranking in each spatial unit. For these reasons, scenario 3 is a compromise between
the first two preserving some trade-off between factors but, mainly limiting the risk-taking.
DISCUSSION
Particular vulnerability in Chacabuco
At the RMS level, one can notice that the districts forming the Chacabuco Province (Tiltil in the NW, Lampa in
the SW and Colina in the eastern part) are much more vulnerable to lack of water, flooding and pollution than the
average of the 52 districts forming the Metropolitan Region. Regarding hazard sensitivity and the ability to face
the hazard, we notice no significant difference. Table 4 quantifies what we can notice visually in Figures 2 and 3.
To do this, we computed the average vulnerability of all 52 RMS districts compared to that of the three Chaca-
buco districts. These differences also affect the vulnerability scenarios, especially scenarios 2 and 3 allowing full
or limited trade-off.
The Chacabuco Province therefore appears to be particularly vulnerable. Accordingly, a more detailed study of
this area is warranted.
Chacabuco scale: benefits of a more detailed analysis
Does a more in-depth analysis provide more and more detailed information about Chacabuco’s vulnerability? We
recall that the MCE at the Chacabuco level was achieved at a higher census resolution, implementing a more
detailed data processing, especially distance analysis and manual interpretation of ravines vulnerability and
data selection for hazard sensitivity.
Because of the lack of more precise and easily available data for the water dimension, the vulnerability map at
the Chacabuco scale gives us only a few more details compared to the RMS scale. Among the four criteria, only
the drought severity index provides more details, while the three other criteria are the same as at the RMS scale.
The situation is different for the metacriteria flooding: two of three criteria are more detailed (ravines and type
of flood; cf., Table 2) leading to a much more contrasted map.
Table 4. | Average vulnerability scores at the RMS and Chacabuco scales.
RMS Chacabuco Difference %
Vulnerability dimensions
Lack of water 0.176 0.418 24.21
Flooding 0.120 0.408 28.75
Pollution 0.100 0.278 17.88
Hazard sensitivity 0.220 0.207 1.35
Coping capacity 0.722 0.719 0.27
Vulnerability scenarios
Scenario 1: Min. risk 0.891 0.971 8.00
Scenario 2: Average risk, full trade-off 0.268 0.406 13.81
Scenario 3: Limited risk & trade-off 0.487 0.617 12.93
Downloaded from http://iwaponline.com/wp/article-pdf/24/1/159/1003739/024010159.pdf
by guestWater Policy Vol 24 No 1, 171
The pollution dimension shows an intermediate situation: one of the two criteria is the same (water quality),
while potentially polluting activities are not only listed but measured by distance.
Hazard sensitivity has, for all criteria, a more detailed resolution: the most detailed census resolution (house
block in urban areas, rural districts). Also, one rather general criterion (multidimensional poverty) is split into
three more precise criteria. Both changes lead to a much more detailed and instructive map.
Coping capacity: due to data availability, only one criterion (health centres and firefighters) brings more
information.
In regard to the three overall vulnerability maps (Figure 3), the minimum risk strategy – forbidding any trade-off
between weighted criteria – impoverishes the diversity of criteria information at only the most vulnerable one;
consequently, the resulting map brings only a little more knowledge compared to that made at the RMS scale.
The finding is different for both scenarios allowing partial or complete trade-off. These vulnerability maps
allow a more local interpretation of vulnerability.
Table 5 confirms the visual comparison: for each vulnerability dimension and scenario, the authors calculated
the average vulnerability at the RMS scale and the Chacabuco scale. The right column expresses the proportional
difference between both. The first observation we can make is that if we analyse vulnerability with better spatially
resolved data, the average vulnerability level is much lower than at the RMS level using municipal data. This aver-
age decrease in vulnerability is even greater than the criteria are more finely resolved and their processing is
elaborated (cf., differences between RMS and Chacabuco scales in Table 2) or the ordered weighted averring tech-
nique allows more trade-off.
The lower average vulnerability level at the Chacabuco scale and the benefits in detail may be illustrated by
maps showing the difference between the vulnerability maps (Figure 2). For example, Figure 4 shows the differ-
ence (vulnerability calculated at the Chacabuco scale minus vulnerability at the RMS scale) for two vulnerability
dimensions: flooding (left) and hazard sensitivity. The maps show both the lower scores for the majority of ter-
ritories and the local vulnerability spots.
A more detailed analysis not only allows us to get a more detailed map and to circumscribe the vulnerability at
a local level much more in line with decision support on the ground but also shows us, on average, a less alarming
vulnerability level.
Table 5. | Chacabuco average vulnerability computed on the municipal level and census units.
RMS Chacabuco Difference %
Vulnerability dimensions
Lack of water 0.418 0.4025 1.55
Flooding 0.408 0.1687 23.91
Pollution 0.278 0.1570 12.14
Hazard sensitivity 0.207 0.1033 10.36
Coping capacity 0.719 0.5160 20.30
Vulnerability scenarios
Scenario 1: Min. risk 0.971 0.9073 6.34
Scenario 2: Average risk, full trade-off 0.406 0.2698 13.63
Scenario 3: Limited risk & trade-off 0.617 0.4246 19.22
Downloaded from http://iwaponline.com/wp/article-pdf/24/1/159/1003739/024010159.pdf
by guestWater Policy Vol 24 No 1, 172
Fig. 4. | Difference (Chacabuco scale minus RMS scale) in vulnerability for flooding (left) and hazard sensitivity (right). Please
refer to the online version of this paper to see this figure in colour: http://dx.doi.org/10.2166/wp.2021.116.
Importance of data processing
The presented results may be considered as exploratory for several reasons. First, the authors underline the
lack of comparable studies in the sense of giving full insight to technical details – from data selection through
pre-processing to weighing and OWA strategies. In the context of water poverty indices, we can quote Garriga
& Foguet (2010) and especially Wurtz et al. (2019) implementing the same MCE approach. Plummer et al.
(2012) offer a compilation of about 50 water vulnerability assessment tools, a paper underlining the diversity
of approaches.
In the absence of more precise data justifying a more specific standardization criteria weighing, the authors
used for each criterion the same membership functions and assigned the same weights to criteria as well as to
metacriteria. If we had scientifically more robust arguments allowing a more specific handling of criteria, result-
ing vulnerability maps could be different. The principal merit of this study is giving full insight to get transparently
to reproducible – and objectionable – results.
A second reason concerns the final, OWA step, allowing various scenarios of risk-taking and trade-off. As the
maps shown in Figure 3 underline, the global vulnerability depends essentially on data processing. Among
the calculated scenarios, scenario 2 offering a full trade-off leading to medium risk may be considered as the
business-as-usual scenario. It is the average of the five metacriteria. An extremely risk-avoiding approach is scen-
ario 1 considering, locally, only the most vulnerable criteria, while scenario 3 shows an intermediate approach. In
other words, there is not the only right map, we have to handle a diversity of vulnerability visions but it is still
necessary to explain these.
A third bias is introduced by scale and, linked to it, the data processing. We have already analysed the differ-
ences resulting from a regional scale and a more local scale based mainly on census limits. It is likely that an even
more local analysis, for example a participatory one, will lead us to even more contrasting results.
Downloaded from http://iwaponline.com/wp/article-pdf/24/1/159/1003739/024010159.pdf
by guestWater Policy Vol 24 No 1, 173
Questioning on data quality and availability plus the strategy to only consider Internet available data
Only free access data were used in this study. Local data coming from inquests or participative workshops
(bottom-up) are the subject of a parallel study and will be confronted shortly to those exposed in this paper.
In this context, another important issue is data: data availability, data quality, data actuality and its spatial resolution:
• Data availability: depending on the other mentioned data characteristics, Chilean data, both statistics and inter-
active and downloadable maps, are generally accessible. Spatial data infrastructures are almost free and
metadata available. However, some data, for example those on water consumption, are not easy to find without
professional knowledge and time-consuming data processing.
• Data quality: confidence in available data is high, particularly for the 2017 census for which error margins are
mentioned.
• Data actuality: like in other countries, data availability is regulated by census intervals.
• Data resolution: statistic data are available mostly up to the district scale, some of them – especially from the
2017 population census – almost up to census units (cf., Chacabuco scale). Other census data like agriculture
are mostly available at a municipal scale, while infrastructures such as buildings or factories are located in maps
or can be located by geographic coordinates.
Illegal and makeshift slums
To illustrate the limits of used data, but also the time shift, especially between population census data (last: 2017)
and territorial dynamics, we will have a look at camps: makeshift and illegal housings. Populations in these slums
are more affected by poverty, educational level is more basic, unemployment higher and jobs more precarious
(MINVU, 2019). The rate of immigrants is high, particularly in northern regions.
The authors use data published by the Ministry of Housing and Urbanism (MINVU, 2019), providing socioe-
conomic statistics at the regional level and the location of slums as shapefile.
Table 6 shows the magnitude of this housing form, the number of which (housings and persons) is increasing.
In this context, we will check if this irregular, unplanned and very dynamic phenomenon appears in the com-
puted vulnerability maps. Latest statistics (Techo para Chile, 2021) show that the number of families living in
slums increased from 2019 to 2020 rapidly: 360% in Colina, 482% in Lampa and 52% in Tiltil. The district of
Tiltil has the lowest incomes of the province but probably because of its geographical distance to the capital
has a lower concentration of slums than the other districts.
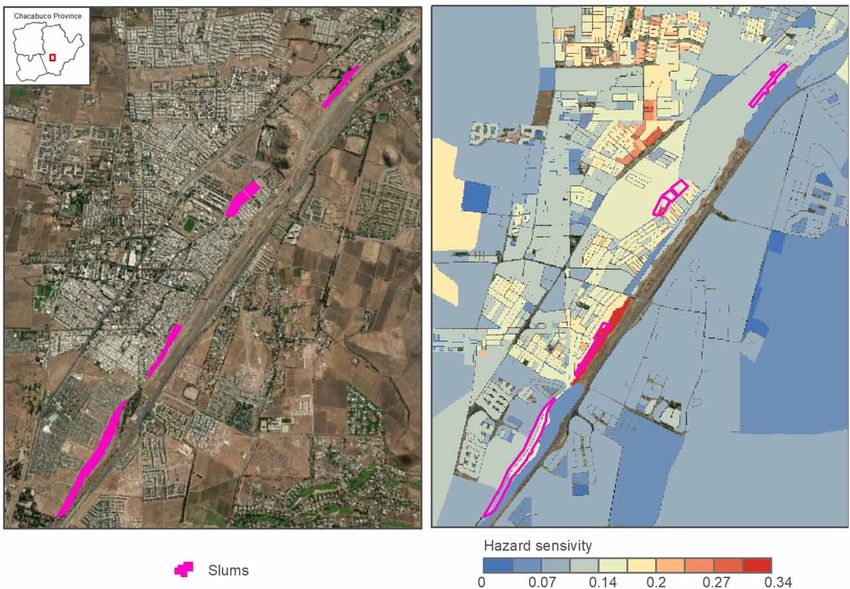
Figure 5 compares the location of slums in the city of Colina (MINVU, 2019) (left) and the vulnerability to
hazard sensitivity of these territories (outlined in cyan) (right). The colour palette of vulnerability is set in a
way that vulnerability scores below the average (0.1033, cf., Table 5) appear in shades of blue and vulnerability
scores above the average warm shades. As we can see, Colina slums vulnerability for hazard sensitivity is higher
than the Chacabuco average. They are located in or near the Colina river; therefore, their flooding vulnerability is
significantly higher than the average (cf., Table 7). However, the average of slums located near Colina river hides
Table 6. | Number of camps, housings and persons in Chacabuco Province (2019).
Districts Colina Lampa Tiltil Total
Slums 6 8 6 20
Housings 747 637 185 1,569
Persons 2,039 1,613 500 4,152
Downloaded from http://iwaponline.com/wp/article-pdf/24/1/159/1003739/024010159.pdf
by guestWater Policy Vol 24 No 1, 174
Fig. 5. | Location of slums in Colina (left) and hazard sensitivity map.
strong inequalities (from simple to triple) which can be linked to the origin of the inhabitants, their demographic
composition and unequal access via informal networks to drinking water.
Table 7 shows the average vulnerability for Chacabuco territory based on census units (equal to the third
column in Table 5) and the average vulnerability of 20 in Chacabuco located slums. The difference (%) is
Table 7. | Chacabuco average vulnerability computed on census units compared to slums average vulnerability.
Chacabuco Slums Difference %
Vulnerability dimensions
Lack of water 0.4025 0.4073 0.48
Flooding 0.1687 0.2731 10.44
Pollution 0.1570 0.1312 2.58
Hazard sensitivity 0.1033 0.1628 5.95
Coping capacity 0.5160 0.4943 2.17
Vulnerability scenarios
Scenario 1: Min risk 0.9073 0.9394 3.21
Scenario 2: Average risk, full trade-off 0.2698 0.2942 2.44
Scenario 3: Limited risk & trade-off 0.4246 0.4510 2.64
Downloaded from http://iwaponline.com/wp/article-pdf/24/1/159/1003739/024010159.pdf
by guestWater Policy Vol 24 No 1, 175
generally positive. This means that the vulnerability is higher in slums than the average in Chacabuco except for
pollution and ability to face the hazard. In all vulnerability scenarios, slums appear as more vulnerable than the
average vulnerability. For each scenario, 14 of the 20 slums have vulnerability scores higher than the average
(three equal and three camps lower scores).
This example, trying to link a multicriteria evaluation based on easily open access data to recent and dynamic
changes in the territories, shows that the particularity of slums is sent back by the vulnerability maps but, prob-
ably, not enough. This may be explained by two factors: boundaries of slums do not match census boundaries. In
addition, the authors used census data from 2017, while the slums map is from the end of 2019 and irregular hous-
ings is a very dynamic phenomenon, exacerbated by COVID impacts which have led to an increase in
unemployment and precarious living conditions. Also, to go further we would need more local socioeconomic
data in order to characterize the specific population in slums compared to the rest of the population.
On the other hand, the ‘Study of Territorial Risk Analysis associated with Disasters in the Province of Chaca-
buco’, led by the Government of Chacabuco and carried out by UNDP within the framework of a Public-Private
Table for risk reduction, identified and analysed the physical, economic, environmental and sociocultural vulner-
abilities in the Chacabuco Province. The study highlights that the most vulnerable social groups correspond to the
migrant population (Haiti, Peru and Bolivia), which has been increasing steadily especially in recent years. Most
of them have precarious jobs, live in overcrowded conditions and lack the resources and networks to face threats
(PNUD, 2018; UNDP, 2019). Since 2020, these processes of precariousness and increase in camps have been
accentuated by the economic effects of the pandemic, especially in the sectors of Colina, Esmeralda, Lampa,
Batuco and Huertos Familiares.
Despite all mentioned restrictions about data selection and data processing, our concern for robust results
indirectly led us to a sensitivity analysis. First, we compute three scenarios (OWA procedure) that encompass
a wide variety of weighting and risk-taking options. Second, we work on complementary levels: the regional
scale using municipal data and the local scale (Chacabuco province) using intra-municipal data. So, some data
and data processing techniques change but despite more detailed results at the local level, the trends are the
same. Third, we underline the importance of local high-speed dynamics such as illegal and makeshift slums show-
ing the importance of complementary data.
CONCLUSION AND POLICY RECOMMENDATIONS
This study shows that the Chacabuco Province is particularly vulnerable to water-related risks. This confirms the
feelings of some of the province’s inhabitants, particularly in Tiltil, that they are experiencing a combination of
environmental difficulties. Although the maps we have drawn up certainly reflect the concentration of environ-
mental threats (polluting infrastructures, strong pressure on water resources), they also show a greater than
average fragility in Tiltil, a poor municipality with few health infrastructures. This analysis therefore reinforces
the idea that Tiltil represents an environmental ‘sacrifice zone’ on the scale of the Metropolitan Region.
The two-scale analysis does not only carry out the particular water vulnerability of Chacabuco province.
For Chacabuco, the analysis with higher resolution data and more intensive data processing shows, on the one
hand, on average lower vulnerability than at the RMS scale and, on the other hand, more detailed results. The
higher the resolution, the closer the analysis is to the inhabitants but the more intensive the data research
processing.
As for any multivariate statistics – and particularly spatial multi-criteria analysis – the quality and the signifi-
cance of the data and their processing are important, and obtained results may vary widely. For this reason,
the necessary sensitivity analysis was carried out twice: by varying the scale and the amount of trade-off and
risk-taking.
Downloaded from http://iwaponline.com/wp/article-pdf/24/1/159/1003739/024010159.pdf
by guestWater Policy Vol 24 No 1, 176
For high-resolution studies, our analysis shows also that the exclusive use of statistical data cannot be sufficient
to take into account very localized and rapidly evolving phenomena such as makeshift slums.
The results may help the stakeholders in the assessment of vulnerability and show in particular the dimensions
of vulnerability that can be directly influenced by them, such as the coping capacity. Thus, the inhabitants can
influence, on the one hand, local politics and, on the other hand, increase, if necessary, the associative fabric
by comparing their local ‘score’ to that of other localities and the local government may request improvements
based on this decision-making supply.
At this stage, due to the stated limitations of this study, it is therefore necessary to complete this work with a
social survey based on the creation of participatory maps in order to explain the differences observed between the
sectors of the districts. The analysis of these maps will also make it possible to identify whether there are differ-
ences between the vulnerable areas identified by the statistical approach and those perceived by the inhabitants,
which could lead us to refine our mapping and attempt to interpret the differences observed. Finally, a general-
ization of this approach to the whole country could anchor the results obtained for only one region, although
unique.
ACKNOWLEDGEMENTS
The authors are grateful to CNRS for supporting this research through the French-Chilean research project PICS
(Programme International de Coopération Scientifique) INEG’EAU. CNRS had no role in the conduct of the
study. The authors gratefully acknowledge the research support provided by CEDEUS, ANID/FONDAP
15110020.
DATA AVAILABILITY STATEMENT
All relevant data are included in the paper or its Supplementary Information.
REFERENCES
Armijo, G. (2000). The rural facet of the metropolitan region: between the peasant suburbanization and the urbanization of the
elite. EURE 26(78), 131–135.
Birkmann, J. & Wisner, B. (2006). Measuring the Unmeasurable: the Challenge of Vulnerability. UNU-EHS SOURCE, Bonn,
Germany, p. 64.
Blaikie, P., Cannon, T., Davis, I. & Wisner, B. (2004). At Risk. People’s Vulnerability and Disasters. Routledge, London & New
York, p. 496.
Boissier, L. (2013). La mortalité liée aux crues torrentielles dans le Sud de la France: une approche de la vulnérabilité humaine
face à l’inondation – Mortality Linked to Torrential Floods in the South of France: An Approach to Human Vulnerability to
Flooding. PhD in Geography, Université Paul Valéry – Montpellier III.
Budds, J. (2020). Securing the market: water security and the internal contradictions of Chile’s Water Code. Geoforum 113,
165–175.
Bullard, R. (1999). Dismantling environmental racism in the USA. Local Environment 4(1), 5–19.
Cardona, O. D., van Aalst, M. K., Birkmann, J., Fordham, M., McGregor, G., Perez, R., Pulwarty, R. S., Schipper, E. L. F. & Sinh,
B. T. (2012). Determinants of risk: exposure and vulnerability. In: Managing the Risks of Extreme Events and Disasters to
Advance Climate Change Adaptation, A Special Report of Working Groups I and II of the Intergovernmental Panel on
Climate Change (IPCC). Field, C. B., Barros, V., Stocker, T. F., Qin, D., Dokken, D. J., Ebi, K. L., Mastrandrea, M. D., Mach,
K. J., Plattner, G.-K., Allen, S. K., Tignor, M. & Midgley, P. M. (eds). Cambridge University Press, Cambridge, UK and
New York, NY, USA, pp. 65–108.
Carrão, H., Naumann, G. & Barbosa, P. (2016). Mapping global patterns of drought risk: an empirical framework based on sub-
national estimates of hazard, exposure and vulnerability. Global Environmental Change 39, 108–124.
Downloaded from http://iwaponline.com/wp/article-pdf/24/1/159/1003739/024010159.pdf
by guestWater Policy Vol 24 No 1, 177
Cutter, S. L. & Finch, C. (2008). Temporal and spatial changes in social vulnerability to natural hazards. PNAS 105(7),
2301–2306. https://doi.org/10.1073/pnas.0710375105.
Cutter, S. L., Emrich, C. T., Webb, J. J. & Morath, D. (2009). Social Vulnerability to Climate Variability Hazards: A Review of the
Literature. Final Report to Oxfam America.
Dong, X., Jiang, L., Zng, S., Guo, R. & Zng, Y. (2020). Vulnerability of urban water infrastructures to climate change at city level,
resources. Conservation & Recycling 161(2020), 104918. https://doi.org/10.1016/j.resconrec.2020.104918.
Eastman, J. R., Kyem, P., Toledano, J. & Weigen, J. (1993). Explorations in Geographic Systems Technology, vol. 4. GIS and
Decision Making, UNITAR, Geneva.
EJSCREEN (2021). EPA’s Environmental Justice Screening and Mapping Tool. Available at: https://www.epa.gov/ejscreen.
Gaillard, J. C., Liamzon, C. C. & Villanueva, J. D. (2007). ‘Natural’ disaster? A retrospect into the causes of the late-2004
typhoon disaster in Eastern Luzon, Philippines. Environmental Hazards 7(4), 257–270.
Garriga, R. G. & Foguet, A. P. (2010). Improved method to calculate a water poverty index at local scale. Journal of
Environmental Engineering 136, 1287–1298. http://doi.org/10.1061/(ASCE)EE.1943-7870.0000255.
Gilbert, C. (2009). La vulnérabilité: une notion vulnérablea propos des risques naturels. Vulnerability: a vulnerable concept?
About natural hazards. In: Risques et environnement: recherches interdisciplinaires sur la vulnérabilité des sociétés.
Becerra, S. & Peltier, A. (eds). L’Harmattan, Paris, pp. 23–40.
Gobierno regional Región metropolitana de Santiago (1997). Resolución 39, apruebammodificación de Plan regulador
metropolitano de Santiago, Biblioteca del CongresomNacional de Chile. Available at: http://bcn.cl/2m1o0.
Gong, L., Jin, C. L., Li, Y. X. & Zhou, Z. L. (2017). A novel water poverty index model for evaluation of Chinese regional water
security. In: International Conference on Water Resource and Environment. Available at: https://iopscience.iop.org/article/
10.1088/1755-1315/82/1/012029/pdf.
González Tanago, I., Urquijo, J., Blauhut, V., Villarroya, F. & De Stefano, L. (2015). Learning from experience: a systematic
review of assessments of vulnerability to drought. Natural Hazards 80, 951–973.
Hidalgo, R., De Mattos, C. & Arenas, F. (eds.) (2009). Chile: From the Urban Country to the Metropolitan Country. GEOlibros
Series 12, Institute of Geography and Collection EURE Books, Institute of Urban and Territorial Studies, PUC, Santiago,
p. 469.
INE (2017). Censo de Población y Vivienda. Available at: https://www.ine.cl/estadisticas/sociales/censos-de-poblacion-y-
vivienda.
Joerin, F. & Musy, A. (2000). Land management with GIS and multicriteria analysis. International Transactions on Operation
Research 7, 67–68.
Jorge, P., Chia, E., Torre, A., Stamm, C., Bustos, B. & Lukas, M. (2020). Justice spatiale et conflits territoriaux dans un contexte
néoliberal. Le cas du Plan stratégique de Til Til dans la Région métropolitaine de Santiago du Chili. Spatial justice and
territorial conflicts in a neoliberal context. The case of the Til Til Strategic Plan in the Santiago Metropolitan Region of
Chile. Annales de géographie (731), 33–61. Available at: https://www.cairn.info/revue-annales-de-geographie-2020-1-page-
33.htm.
Lerner, S. (2010). Sacrifice Zones: The Front Lines of Toxic Chemical Exposure in the United States. MIT Press, Cambridge, MA,
p. 346.
Lukas, M., Fragkou, M. C. & Vásquez, A. (2020). Towards a political ecology of the new urban peripheries: soil, water and
power in Santiago de Chile. Revista de Geografía Norte Grande (76), 95–119. https://dx.doi.org/10.4067/S0718-
34022020000200095.
McGurty, E. (1997). From NIMBY to civil rights: the origins of the environmental justice movement. Environmental History
2(3), 301–323. https://doi.org/10.2307/3985352.
MEJ (Mapping for Environmental Justice) (2021). Available at: https://mappingforej.berkeley.edu/.
Ministerio de Vivienda y Urbanismo (2018). Methodology to measure the urban growth of the cities of Chile/CEHU – Minvu,
Department of Geography INE – Santiago: Minvu, 2018 - 61 p.: planos – Colección Monografías y Ensayos; | Serie IX
Ciudad y Territorio, N° 360.
MINVU (2019). Catastro Nacional de Campamentos. Available at: https://www.minvu.cl/catastro-de-campamentos/.
Paegelow, M. (2018). Multi criteria evaluation. In: Geomatic Appoaches for Modeling Land Change Scenarios. A Review and
Comparison of Modeling Techniques. Lecture Notes in Geoinformation and Cartography. Camacho, Olmedo, M.T.,
Paegelow, M., Mas, J. F. & Escobar, F. (eds). Springer, Cham, Switzerland, pp. 447–449.
Pellow, D. (2000). Environmental inequality formation: toward a theory of environmental injustice. American Behavior Scientist
43(4), 581–601.
Downloaded from http://iwaponline.com/wp/article-pdf/24/1/159/1003739/024010159.pdf
by guestYou can also read