Wood Anatomy of Douglas-Fir in Eastern Arizona and Its Relationship With Pacific Basin Climate - Diva Portal
←
→
Page content transcription
If your browser does not render page correctly, please read the page content below
ORIGINAL RESEARCH
                                                                                                                                        published: 01 September 2021
                                                                                                                                       doi: 10.3389/fpls.2021.702442

                                              Wood Anatomy of Douglas-Fir in
                                              Eastern Arizona and Its Relationship
                                              With Pacific Basin Climate
                                              Daniel Balanzategui 1,2,3, Henry Nordhauß 1, Ingo Heinrich 1,2,3, Franco Biondi 4,
                                              Nicholas Miley 4, Alexander G. Hurley 1 and Emanuele Ziaco 1,5*
                                              1
                                               GFZ German Research Centre for Geosciences, Potsdam, Germany, 2Institute of Geography, Humboldt-University, Berlin,
                                              Germany, 3Department of Natural Sciences, DAI German Archaeological Institute, Berlin, Germany, 4DendroLab, Department
                                              of Natural Resources & Environmental Science, University of Nevada, Reno, NV, United States, 5Department of Ecology and
                                              Genetics, Plant Ecology and Evolution, University of Uppsala, Uppsala, Sweden

                                              Dendroclimatic reconstructions, which are a well-known tool for extending records of
                                              climatic variability, have recently been expanded by using wood anatomical parameters.
                                              However, the relationships between wood cellular structures and large-scale climatic
                            Edited by:
                         Marco Carrer,        patterns, such as El Niño-Southern Oscillation (ENSO) and the Pacific Decadal Oscillation
              University of Padua, Italy      (PDO), are still not completely understood, hindering the potential for wood anatomy as
                      Reviewed by:            a paleoclimatic proxy. To better understand the teleconnection between regional and local
                 Daniele Castagneri,
            University of Padua, Italy        climate processes in the western United States, our main objective was to assess the
                           Bao Yang,          value of these emerging tree-ring parameters for reconstructing climate dynamics. Using
Cold and Arid Regions Environmental
                                              Confocal Laser Scanning Microscopy, we measured cell lumen diameter and cell wall
 and Engineering Research Institute,
Chinese Academy of Sciences, China            thickness (CWT) for the period 1966 to 2015 in five Douglas-firs [Pseudotsuga menziesii
                *Correspondence:              (Mirb.) Franco] from two sites in eastern Arizona (United States). Dendroclimatic analysis
                     Emanuele Ziaco           was performed using chronologies developed for 10 equally distributed sectors of the
           emanuele.ziaco@ebc.uu.se
                                              ring and daily climatic records to identify the strongest climatic signal for each sector.
                   Specialty section:         We found that lumen diameter in the first ring sector was sensitive to previous fall–winter
         This article was submitted to        temperature (September 25th to January 23rd), while a precipitation signal (October 27th
             Functional Plant Ecology,
               a section of the journal       to February 13th) persisted for the entire first half of the ring. The lack of synchronous
            Frontiers in Plant Science        patterns between trees for CWT prevented conducting meaningful climate-response
           Received: 29 April 2021            analysis for that anatomical parameter. Time series of lumen diameter showed an anti-
        Accepted: 02 August 2021
     Published: 01 September 2021
                                              phase relationship with the Southern Oscillation Index (a proxy for ENSO) at 10 to 14 year
                              Citation:
                                              periodicity and particularly in 1980–2005, suggesting that chronologies of wood anatomical
        Balanzategui D, Nordhauß H,           parameters respond to multidecadal variability of regional climatic modes. Our findings
          Heinrich I, Biondi F, Miley N,      demonstrate the potential of cell structural characteristics of southwestern United States
 Hurley AG and Ziaco E (2021) Wood
   Anatomy of Douglas-Fir in Eastern          conifers for reconstructing past climatic variability, while also improving our understanding
    Arizona and Its Relationship With         of how large-scale ocean–atmosphere interactions impact local hydroclimatic patterns.
                Pacific Basin Climate.
         Front. Plant Sci. 12:702442.         Keywords: quantitative wood anatomy, Pseudotsuga menziesii, El Niño/Southern Oscillation, Pacific Decadal
      doi: 10.3389/fpls.2021.702442           Oscillation, paleoclimate, western United States

Frontiers in Plant Science | www.frontiersin.org                                    1                                      September 2021 | Volume 12 | Article 702442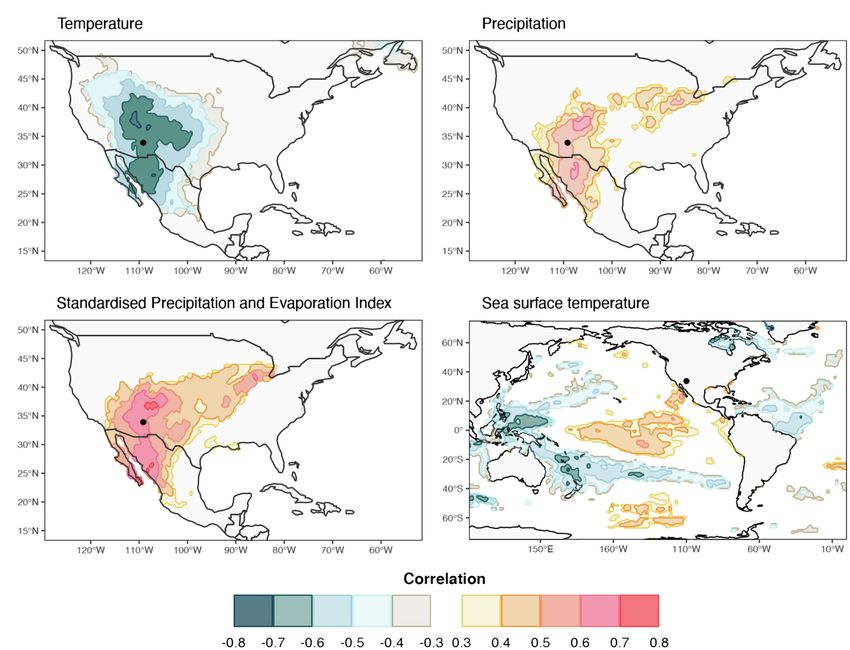
Balanzategui et al.                                                                                                  Wood Anatomy of Douglas-Fir

INTRODUCTION                                                             tree-ring-based paleoclimatic reconstructions, such as the
                                                                         minimum sample size (Pearl et al., 2020). For instance, multi-
The climate of the North American West is closely connected              centennial reconstructions of summer (Panyushkina et al., 2003)
with ocean–atmosphere variability in the Pacific Basin, which            and winter temperature (Pritzkow et al., 2016) have been
is often defined through indices, such as the El Niño-Southern           produced using wood anatomical parameters extracted from
Oscillation (ENSO) index (Barnett et al., 1991) and the Pacific          a limited number of samples otherwise deemed insufficient
Decadal Oscillation (PDO) index (Mantua and Hare, 2002).                 for standard ring-width analysis. Furthermore, the partitioning
Both climatic modes play a fundamental role in determining               of tree rings into sub-sections (herein referred to as “sectors”)
interannual variability of ecohydrological conditions, affecting         is a rapidly growing technique with the potential to improve
water resources, particularly in the moisture-limited environments       the temporal resolution of the climatic signal encoded in intra-
of the western United States (Corringham and Cayan, 2019;                annual xylem cellular structures (Carrer et al., 2017). Tree-ring
White et al., 2019), and long-term vegetation dynamics (Viglizzo         partitioning, either in equal parts (Castagneri et al., 2017) or
et al., 2015). Over the western United States, the southward             between earlywood and latewood (Fonti and García-González,
shift of convective air masses that occurs over the ocean during         2004; Torbenson et al., 2016), better characterizes intra-seasonal
an El Niño (La Niña) event often results in above (below)                changes in wood anatomical features along the tree ring and
average winter rainfall over the southwest (Sheppard et al.,             is expected to enhance the temporal resolution of climate-
2002). Similarly, warm (cold) PDO phases are positively                  anatomy relationships while also clarifying and expanding the
(negatively) correlated with winter precipitation along the coast        amount and quality of environmental information obtainable
of southern California, Arizona, and New Mexico (Mantua                  from trees (Ziaco and Liang, 2019).
et al., 1997). Recently, model predictions based on large-scale             Douglas-fir [Pseudotsuga menziesii (Mirb.) Franco] is one
atmospheric circulation patterns have been shown to                      of the most widely used species for dendroclimatic research
unsatisfactorily reproduce observed precipitation dynamics (Jong         in the western United States. It is widely distributed along
et al., 2018). This is because linking ENSO- and PDO-driven              the coast of the American northwest and western Canada,
regional climatic conditions with local hydroclimatic variability        and from Mexico to the Rocky Mountains (Li and Adams,
requires properly accounting for additional site-specific factors.       1989), it can reach ages greater than 1,000 years (Contributors
For example, wind direction and local topography can cause               of the International Tree-Ring Data Bank, 2020) and its ring-
abnormally high rainfalls to occur, contrary to expectation,             width chronologies are typically sensitive to climate. It is
during La Niña events in the southwest United States                     therefore an ideal target for testing the potential of cellular-
(Feldl and Roe, 2010).                                                   level dendroclimatology. The main goal of this explorative study
   Since instrumental records of ENSO and PDO begin in                   was to assess the utility of wood anatomy of P. menziesii for
the late 19th century, the range of local climate variability that       dendroclimatic reconstructions with particular focus on Pacific
can be expected during different modes of ENSO and PDO                   Basin climate, and specifically, 1) to test the temporal and
can be better estimated by extending instrumental observations           spatial climate relationships of intra-annual xylem anatomical
using proxy records, such as climate-sensitive tree-ring                 parameters in P. menziesii and 2) to evaluate the potential
chronologies (Biondi et al., 2001; Stahle et al., 2009; Woodhouse        contribution of these proxies for bridging the gap between
et al., 2013; Ziaco et al., 2020). The inclusion of cellular-level       large-scale atmospheric circulation modes (such as ENSO and
wood anatomical traits in dendroclimatological studies has the           PDO) and local hydroclimatic variability. To achieve these
potential to improve the spatiotemporal coverage of hydroclimatic        goals, we developed ring-sector chronologies and assessed the
reconstructions (González-Cásares et al., 2019; Seftigen et al.,         strength of the climatic signal encoded in their wood
2020). Quantitative wood anatomy (QWA) in dendroclimatology,             anatomical structures.
namely, the response between woody cell structures and climatic
variability (von Arx et al. 2016), has been applied to angiosperm
(García-González and Eckstein, 2003; Tardif and Conciatori,              MATERIALS AND METHODS
2006; Fonti and García-Gonzalez, 2008; Campelo et al., 2010)
and conifer species (Wang et al., 2002; Panyushkina et al.,              Study Area
2003; DeSoto et al., 2011; Liang et al., 2013b), but cellular-           The study site, located in the White Mountains of eastern
level dendroclimatology in the western United States is still            Arizona on the southern edge of the Colorado Plateau
relatively new (Ziaco et al., 2016; Edwards et al., 2020). Intra-        (Figure 1A), was preselected based on a preliminary analysis
annual variability of xylem structures depends on resource               of the site characteristics performed with the web-based tool
allocation and trade-offs between plant growth and reproduction          Dendrobox (Zang, 2015). Despite falling within the core region
that are driven by local hydroclimatic variability (Lauder et al.,       of the North American Monsoon (NAM), where precipitation
2019) at short (sub-seasonal) time scales (Bouriaud et al., 2005).       is mostly concentrated in the summer months (Griffin et al.,
Hence, annually resolved time series of cellular parameters              2013), mountain areas in this part of the southwestern
often present stronger or different relationships with seasonal          United States are also sensitive to cool-season conditions linked
climate compared to their ring-width counterpart (Castagneri             to ENSO, and the Dendrobox tool allowed us to search the
et al., 2017), offering studies with limited wood material the           International Tree-Ring Data Bank (Grissino-Mayer and
potential to overcome some of the restrictions of                        Fritts, 1997) for existing sites with ring-width chronologies

Frontiers in Plant Science | www.frontiersin.org                     2                                 September 2021 | Volume 12 | Article 702442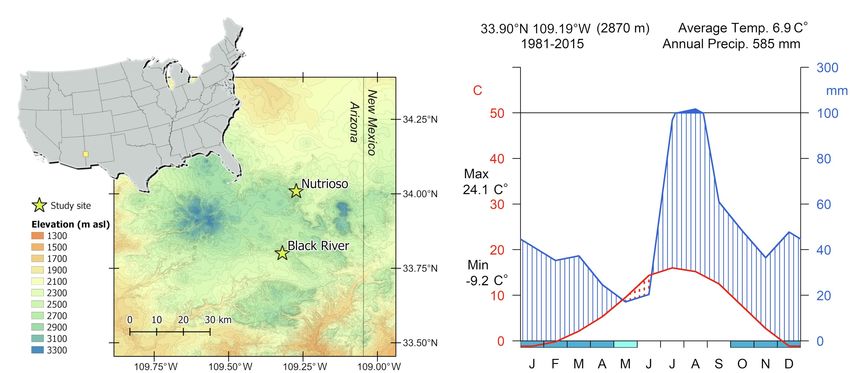
Balanzategui et al.                                                                                                                   Wood Anatomy of Douglas-Fir

    A                                                                                 B

  FIGURE 1 | (A) Geographical location of the two study sites. (B) Walter-Lieth climatic diagram for the period 1981–2015 based on PRISM data.

sensitive to winter precipitation. Tree samples were collected                      increment borer in a direction parallel to topographic contours
in forest stands dominated by P. menziesii near the village of                      to avoid compression wood produced by gymnosperms on
Alpine, Arizona. Trees were located at altitudes between 2,500                      the downhill side of the stem (Speer, 2010). Increment cores
and 2,900 m a.s.l. on south- to southeast-facing slopes with                        were mounted with wood tracheids oriented vertically, sanded
25–52% steepness.                                                                   with progressively finer sandpaper, and finally hand polished
    The topographically complex landscape of the White                              until individual cells were visible under 10-50x magnification.
Mountains is influenced by multiple climatic patterns linked                        Individual series were cross-dated and measured on a Velmex
to the Pacific Ocean, including the Gulf of California, and                         sliding-scale micrometer table interfaced with a video camera
the Atlantic Ocean, including the Gulf of Mexico (Jana et al.,                      with the Measure J2X software (VoorTech Consulting), and
2018). The precipitation regime reflects the typical bimodal                        finally averaged to develop a ring-width chronology
pattern found in the southwestern United States (Figure 1B),                        (Supplementary Figure S1a). Trees from Nutrioso were on
with a peak in late winter derived from large-scale frontal                         average 118 ± 35 years old with minimum and maximum ages
storms originating over the eastern Pacific, followed by summer                     of 92 and 250 years, respectively, while trees sampled at Black
rainfall carried inland by the NAM (Sheppard et al., 2002).                         River were 142 ± 35 years old on average and ranging from 83
Daily time series of maximum temperature (Tmax) and total                           to 174 years. The mean ring width was 1.47 ± 0.37 mm at Nutrioso
precipitation for the years 1981–2015 were obtained from the                        and 1.62 ± 0.41 mm at Black River. Raw ring-width series were
PRISM (Parameter-elevation Relationships on Independent                             standardized using a 50-year smoothing spline with 0.5 frequency
Slopes Model) 4 km dataset (Daly et al., 2008) at the grid                          cutoff and pre-whitened to remove first-order autocorrelation.
point 33.90° N 109.19°W. The climate during this period was                         As a preliminary step, we tested climate-growth relationships
characterized by a mean annual temperature of 6.9 ± 3.2°C,                          for the period 1950–2015 using monthly data of Tmax and
with January and July being the coldest (−1.2 ± 3.8°C) and                          precipitation. Response functions showed that P. menziesii radial
warmest months (16.0 ± 1.8°C), respectively. Total annual                           growth at these sites is positively influenced by previous
precipitation was 585 ± 113 mm, with a substantial amount                           December to current January precipitation, while also negatively
falling from July to August (37% of the annual total), and                          affected by July temperature (Supplementary Figure S1b).
snowpack lasting on average from November to March                                      The wood anatomical analysis was conducted on a subset
(Figure 1B).                                                                        of five trees (three from Nutrioso and two from Black River)
                                                                                    by selecting cores with high-quality intra-annual xylem structures,
Tree-Ring Chronologies and Anatomical                                               and absence of surface cracks or other alteration of the woody
Measurements                                                                        tissue. For the extraction of resinous compounds, samples were
In April 2016, a total of 31 increment cores were collected                         separated from their mounts, divided into 5-cm long pieces,
from two sites (Nutrioso and Black River; Figure 1A) from                           and submerged in glass vessels filled with 99.9% isopropanol
healthy P. menziesii trees with diameters at breast height (~1.3 m                  for 48 h in a 70° C ultrasonic water bath operating at a frequency
from the ground) ranging from 45 cm to 93 cm, and an average                        of 37 kHz. Samples were then air dried, remounted, and stabilized
height of 35 m. Increment cores were taken with a 4 mm                              using non-Newtonian fluid to avoid cell wall breakage during

Frontiers in Plant Science | www.frontiersin.org                                3                                       September 2021 | Volume 12 | Article 702442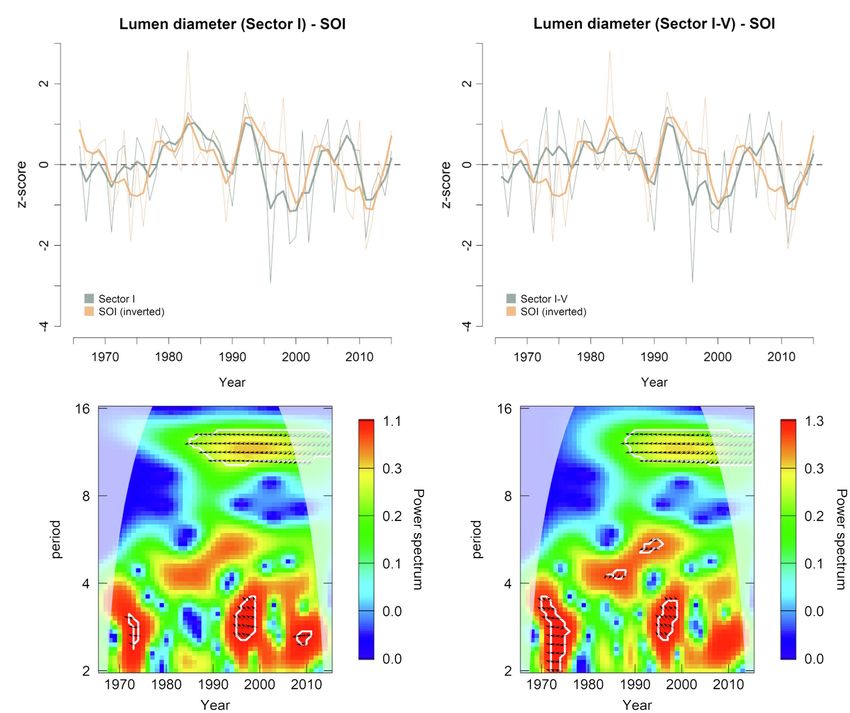
Balanzategui et al. Wood Anatomy of Douglas-Fir
(Seo et al., 2014). While the distance across each ring was
mostly homogenous the number of cells within each cell row
showed some variation, therefore standardized profiles
(tracheidograms) for each cell file were produced to better
illustrate intra-seasonal and year-to-year site-wide growth patterns
along the tree ring (Vaganov, 1990; Ziaco, 2020). Tracheidograms
for each radial file, year, and tree were divided into 10 equal
sized sectors (from I to X). While tree-ring partitioning is
generally performed by visually dividing the ring into 10 equally
spaced portions based on ring width, in our approach the
location of each sector boundary was determined for each
analyzed row in relation to the total number of cells found
in that row – an analytical step made possible with the inclusion
of the RAPTOR algorithms. With this approach, the cells of
each radial file could be precisely assigned to their respective
sectors. The simple average of LD or CWT measurements for
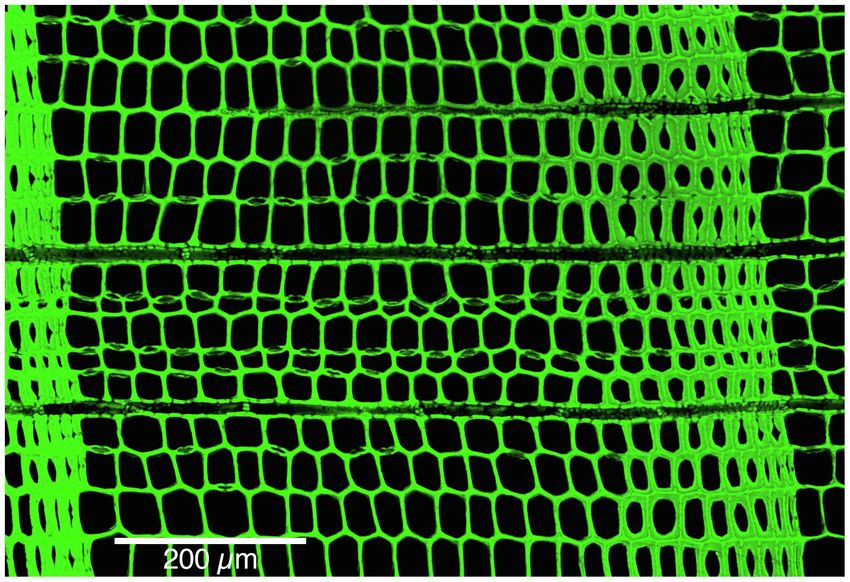
FIGURE 2 | Microscopic composite (merged) image of Pseudotsuga
menziesii at 300x magnification with brightness correction.
all cells falling within a specific sector within the row and
ring was then calculated to produce 10 sectorial chronologies
for each anatomical parameter. Finally, the 10 sector chronologies
the cutting procedure (Schneider and Gartner, 2013). Micro of each tree were normalized (zero mean and unit standard
sections (~20 μm) were cut from the transversal surface with deviation) across the common period 1966–2015, and the
an advanced core-microtome (Gartner and Nievergelt, 2010). average taken across all trees to obtain sector chronologies
Thin sections were then stained with 1% safranin diluted in revealing site-wide, intra-seasonal anatomical variability. Due
distilled water, dehydrated with alcohol, and temporarily fixed to lack of a long-term trend, which usually occurs in ring-
in glycerol between two glass microscope slides (Gärtner and width series because of inherent non-climatic trends interfering
Schweingruber, 2013). Sequential micro-images were taken at with the climatic signal, no detrending procedure was applied
100x magnification following the procedures and settings (Carrer et al., 2017). Chronology descriptive statistics commonly
described by Liang et al. (2013a) using an Olympus FluoView employed in tree-ring studies were used to gage the quality
FV300 Confocal Laser Scanning Microscope (CLSM) that of the common variance (i.e., climatic signal) shared among
displays cell wall (green) and lumen (black) in strong contrast trees (Hughes et al., 2011). These included mean inter-series
(Figure 2). Large, single frame images derived from composite correlation (rbar), expressed population signal (EPS), and signal-
CLSM micrographs (25 to 30 images) were processed with to-noise ratio (SNR). Descriptive statistics were calculated using
the quantitative wood anatomical program, ROXAS 3.0.1 (von the R package dplR (Bunn et al., 2014).
Arx and Carrer, 2014 and supporting software Image-Pro Plus
v6.1 Media Cybernetics, Silver Spring, MA, United States), to
identify, date, edit, and measure all cell structures. Although Dendroclimatic Analysis
CLSM allows to acquire images directly on the wood surface, Each sector chronology was compared with daily Tmax and
in our set of samples we found the wood properties of the total precipitation (PPT) from 1981 to 2015 using the Climate
inner part of the tree, where the rings are darker, to be more Impact on Tree Growth (CLIMTREG) program (Beck et al.,
suitable for direct surface scanning, whereas the lighter sap 2013). CLIMTREG initially calculates correlations between
wood rings were not, requiring additional steps of staining climate and anatomical parameters for a 21-day-long period,
and thin sectioning to allow CLSM imaging to enhance the then iteratively adds one day to the correlation window until
contrast between cell structures. As in this study we focused a maximum interval length of 121 days is reached. The moving
on the outermost, light-colored sapwood rings, we preferred correlation procedure starts on July first of the previous year
to use thin sections, which provided better results although and stops on October 31st of the current year, resulting in
more time-consuming. 42,218 correlations calculated per run. Hence, the starting and
From the QWA data produced by ROXAS, our analysis ending date of climate-anatomy correlations could be identified
focused on the intra- and inter-annual variability in radial with daily resolution, summarized for each climatic parameter
diameter of cell lumen (LD) and tangential cell wall thickness (temperature and precipitation), and visualized for each tree-
(CWT). The QWA specific search algorithms of the R package, ring sector. Since our interest was in evaluating the potential
RAPTOR 1.0.1 (Row and Position Tracheid Organizer in R), of wood anatomy for dendroclimatic reconstructions, whenever
were used to locate cell rows and assign each cell (tracheid) multiple significant correlations with climate emerged
and corresponding QWA measurements to the correct position we identified and retained only the period most strongly
within its respective radial file (Peters et al., 2018). Depending correlated with a given parameter and used only that respective
on the quality of the scanned material and the number of window for further analyses and visualization.
resin ducts within each tree ring, between 10 to 25 cell rows The sectors that showed acceptable chronology statistics
were identified, exceeding the number usually recommended (Wigley et al., 1984) and relationships with daily climate
Frontiers in Plant Science | www.frontiersin.org 4 September 2021 | Volume 12 | Article 702442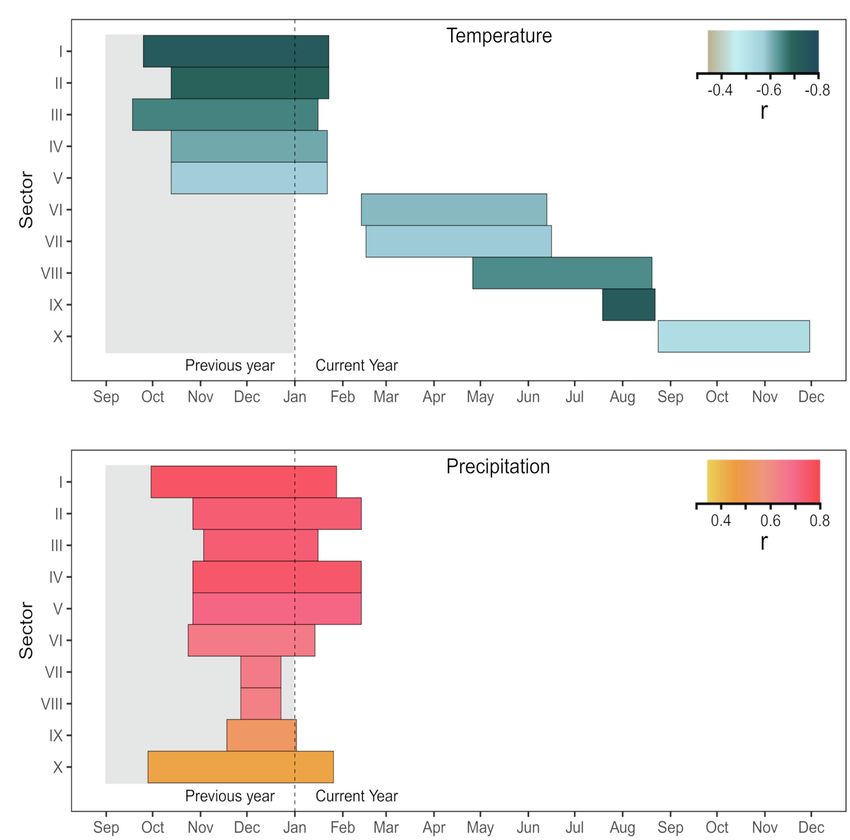
Balanzategui et al.                                                                                                                     Wood Anatomy of Douglas-Fir

                                                                                          Ropelewski and Jones, 1987) and PDO (Mantua et al., 1997)
          A                                                                               indices over the period 1966–2015. The SOI is a measure of
                                                                                          fluctuations in air pressure occurring between the western and
                                                                                          eastern tropical Pacific and is one of the most commonly used
                                                                                          proxy indicators to describe anomalies in ENSO behavior
                                                                                          (Ropelewski and Jones, 1987). Negative (positive) phases of
                                                                                          the SOI are associated with El Niño (La Niña) conditions that
                                                                                          often result in above (below) average precipitation in the
                                                                                          southwestern United States. Cross-wavelet analysis highlights
                                                                                          common time frequency phase variations, phase cyclicity, and
                                                                                          links between different bio-geophysical proxies (Wang et al.,
                                                                                          2011; Land et al., 2020). Explanatory monthly variables of SOI
                                                                                          and PDO series were pre-determined based on the outcomes
                                                                                          of the dendroclimatic calibration. Cross-wavelet analysis was
          B
                                                                                          performed using the package WaveletComp (Roesch and
                                                                                          Schmidbauer, 2018) for the R statistical environment (R Core
                                                                                          Team, 2021).

                                                                                          RESULTS
                                                                                          Cell Structure and Sector Chronologies
                                                                                          From the start to the end of the tree ring, lumen diameter
                                                                                          (LD) decreased from 41.3 ± 4.7 μm in the first part of the ring
                                                                                          (sector I) to 4.0 ± 0.4 μm in the last part (sector X; Figure 3A;
                                                                                          Table 1). CWT instead increased from about 2.2 ± 0.2 μm in
                                                                                          the first sector (I) to 4.7 ± 0.5 μm in the last sector (X; Figure 3B;
     FIGURE 3 | Annual (gray solid lines) and mean (black dashed lines)                   Table 1). Site-averaged sector chronologies of LD had negligible
     standardized tracheidograms of (A) lumen diameter and (B) cell wall                  first-order autocorrelation ranging from 0.07 to 0.32, whereas
     thickness (CWT) for the five sampled trees at Nutrioso and Black River for the
     years 1966–2015. Roman numerals indicate tree-ring sectors, from the
                                                                                          first-order autocorrelation was higher for CWT chronologies,
     beginning (sector I) to the end of the ring (sector X).                              ranging between 0.62 and 0.73 (Table 1). Inter-annual variability
                                                                                          of LD between the five trees generally showed stronger
                                                                                          synchronization in the earlier sectors compared to the later
parameters were chosen to assess spatial field correlations. The                          ones (Table 1, Figure 4A). These common growth patterns
spatial signature of the growth response to climate was                                   from the first to the fifth sector were shown by rbar values
investigated using the web-based KNMI Climate Explorer tool1                              from 0.438 to 0.658, EPS from 0.796 to 0.906, and SNR from
(Trouet and Van Oldenborgh, 2013) to generate correlation                                 3.496 to 6.368. On the other hand, CWT series were noisy
fields over the United States and Mexico, as well as the Pacific,                         along the entire ring (rbar from 0.004 to 0.166, EPS from
Gulf of Mexico, and Atlantic regions. Because daily data are                              0.026 to 0.501, and SNR from 0.012 to 1.314) and generally
not available for spatial field correlation in KNMI Climate                               lacked common variability between trees (Table 1, Figure 4B).
Explorer, this analysis was done using monthly climate data.                              For this reason, CWT chronologies were excluded from
Temperature and precipitation were taken from the CRU TS4.03                              further analysis.
dataset with 50 km x 50-km grid cells (Mitchell and Jones,
2005). Sector chronologies were also correlated against 1-month
Standardized Precipitation and Evaporation Index (SPEI-1; CSIC                            Correlations Between Anatomical
2.6; Beguería et al., 2014) and sea surface temperature (SST;                             Chronologies and Daily Climate
NOAA/NCEP Reynolds OI.v2; Reynolds et al., 2002) to investigate                           Several significant (p < 0.05) climate-anatomy relationships were
the influence of interdecadal or decadal climatic oscillations                            found between all LD sectors and daily Tmax and precipitation.
patterns derived from ENSO and PDO.                                                       The strongest correlations for the first five sectors were with
    Finally, the relationship between wood anatomy in P. menziesii                        previous mid-September to current mid-February, and generally
and supra-regional climatic modes was quantified by applying                              decreased in strength toward the transition zone between earlywood
a cross-wavelet transform (Grinsted et al., 2004) to annually                             and latewood cells. Temperature was negatively correlated with
resolved time series of anatomical parameters for selected                                LD, with Pearson’s correlation coefficient r between −0.56 and − 0.72
sectors against the Southern Oscillation Index (SOI;                                      (Figure 5A), whereas precipitation had a positive correlation,
                                                                                          ranging between 0.7 and 0.75 (Figure 5B). For sectors six to 10,
                                                                                          the relationship between LD and temperature remained negative,
 https://climexp.knmi.nl/
1                                                                                        but the temporal window of maximum correlation progressively

Frontiers in Plant Science | www.frontiersin.org                                      5                                   September 2021 | Volume 12 | Article 702442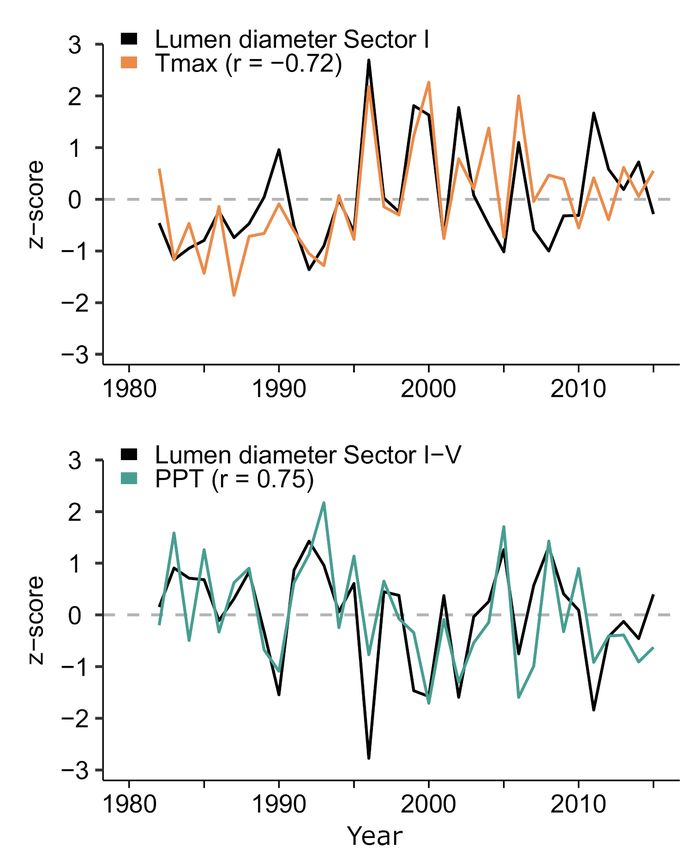
Balanzategui et al.                                                                                                                                  Wood Anatomy of Douglas-Fir

TABLE 1 | Summary statistics of cell lumen diameter and cell wall thickness chronologies.

                                             Lumen diameter (LD)                                                            Cell wall thickness (CWT)

Sector            Mean ± SD           AC1              rbar            EPS             SNR          Mean ± SD           AC1              rbar            EPS              SNR

I                 41.3 ± 4.7          0.07            0.658            0.906          6.368          2.2 ± 0.2           0.73            0.004            0.026           0.012
II                35.3 ± 3.8          0.04            0.623            0.893          5.755          2.5 ± 0.2           0.76            0.108            0.379           0.634
III               32.1 ± 3.5          0.05            0.504            0.836          4.193          2.7 ± 0.2           0.72            0.166            0.501           1.314
IV                29.5 ± 3.3          0.10            0.447            0.802          4.051          2.9 ± 0.3           0.67            0.137            0.444           0.837
V                 26.9 ± 3.1          0.14            0.438            0.796          3.496          3.0 ± 0.3           0.65            0.115            0.397           0.962
VI                24.0 ± 3.0          0.16            0.243            0.616          1.697          3.2 ± 0.3           0.62            0.089            0.332           0.829
VII               20.3 ± 2.7          0.16            0.119            0.402          0.632          3.4 ± 0.3           0.62            0.066            0.263           0.698
VIII              15.0 ± 2.0          0.17            0.093            0.338          0.531          3.8 ± 0.4           0.63            0.045            0.194           0.508
IX                 8.8 ± 1.0          0.32            0.108            0.375          0.602          4.1 ± 0.4           0.62            0.015            0.076           0.158
X                  4.0 ± 0.4          0.22            0.159            0.486          0.893          4.7 ± 0.5           0.62            0.011            0.062           0.172

Mean and standard deviation (SD = ± one standard deviation, both shown in μm), one-year lag autocorrelation (AC1), series inter-correlation (rbar), expressed population signal
(EPS), and signal-to-noise ratio (SNR) were calculated for the period 1966 to 2015, moving from the start of the earlywood (sector I) to the end of the latewood (sector X).

shifted toward the spring and summer of the current growing                                   the typical pattern of SST anomalies associated with ENSO
season as sector number increased. In the second half of the                                  events (Figure 7D). Correlations between LD in the first
tree ring, LD maintained a positive linkage with previous-September                           half of the ring and SST were positive in the eastern Pacific
to current-February precipitation. Maximum dendroclimatic                                     (r from 0.34 to 0.57), and negative in the western and
correlations in the latter half of the tree ring were usually weaker                          southern Pacific (r from −0.34 to −0.69).
than those in the first half. However, sector IX, despite showing                                The October–January SOI index and LD were correlated between
poor signal quality (rbar = 0.108, EPS = 0.375, SNR = 0.602), had                             1966 and 2015 (Figure 8A). This relationship was higher during
a strong negative correlation with mid-July to mid-August                                     the period 1980–2005, when the cross-wavelet power showed a
temperature (r = −0.72). Overall, the first sector (I) carried the                            significant anti-phase relationship on the 10-14-year band
strongest signal, responding to Tmax from previous September                                  (Figure 8B). Since El Niño episodes, characterized by above
25th to current January 23rd (Supplementary Figure S2). The                                   average precipitation and cooler temperatures in the southwestern
average of sectors I-V showed high correlation (r = 0.75) with                                United States, are associated with negative SOI phases, the emergence
rainfall between previous October 27th and current February 13th                              of such anti-phase relationships highlighted the potential of wood
(Figure 6 and Supplementary Figure S3). Based on these results,                               anatomical structures to record large-scale climatic variability,
sector I and the mean of sectors I-V were chosen for further                                  confirming at the same time the outcomes of the dendroclimatic
calibration analysis.                                                                         analysis performed with local temperature and precipitation data.
                                                                                              On the other hand, no clear connections were observed between
                                                                                              PDO and LD series (Supplementary Figures S4a,b).
Spatial Field Correlations and
Cross-Wavelet Analysis
Spatial field correlations were performed between lumen
diameter chronologies for sector I and for the average of                                     DISCUSSION
sectors I-V against October–January average Tmax, SPEI-1,
SST, and November–January total PPT. The negative correlation                                 Intra-annual Wood Cellular Dendroclimatic
between Tmax and LD in sector I was spatially consistent                                      Relationships
and significant throughout the entire southwestern                                            Xylem cellular features of P. menziesii were not equally suitable
United States and northern Mexico, with correlations ranging                                  as paleoclimatic proxies. In this study, lumen diameter and
from r = −0.34 to r = −0.71 (Figure 7A). A similar geographical                               CWT differed at both the inter- and intra-annual level in
pattern, but positive and with an extension reaching into                                     terms of common signal among trees and sensitivity to climate.
the American mid-west, was found between sector I-V LD                                        In contrast to LD, CWT time series lacked common variability
and PPT during previous November to current January                                           (low rbar, EPS, and SNR) and showed high serial autocorrelation
(Figure 7B) with correlations ranging between r = 0.34 and                                    (AC1). The high values of AC1 in the chronologies of CWT,
r = 0.70. Spatial correlations between sector I-V LD and                                      particularly in the first sectors (i.e., I and II), might be due
SPEI-1 were almost identical in terms of geographical                                         to complex dynamics of carbon assimilation and allocation,
distribution to those with PPT (r from 0.34 to 0.75) but                                      whose description is beyond the scope of this work, that can
were slightly higher and more homogeneously distributed                                       be further complicated by external factors, such as disturbance
over the southwestern United States, especially Arizona, New                                  events like drought (Peltier and Ogle, 2020). The low agreement
Mexico, and southern Colorado (Figure 7C). The sector                                         between CWT series observed here and in previous studies
I-V LD chronology showed widespread significant relationships                                 (Ziaco et al., 2016), suggests that in drought-prone locations
with October to January SSTs in the Pacific Ocean, resembling                                 of the Southwest, sub-seasonal internal processes responsible

Frontiers in Plant Science | www.frontiersin.org                                         6                                           September 2021 | Volume 12 | Article 702442
Balanzategui et al. Wood Anatomy of Douglas-Fir
A B
FIGURE 4 | Standardized sector chronologies for the period 1966–-2015 for lumen radial diameter (A) and CWT (B) moving from the beginning (sector I) to the
end (sector X) of the ring.
for partitioning of carbohydrates between structural and maintain hydraulic integrity as observed for other conifer species
non-structural sinks (i.e., primary and secondary productivity, (Carvalho et al., 2015), which makes lumen diameter a valuable
storage; Carbone et al., 2013) remains highly variable between paleoclimatic proxy.
trees (Herrera-Ramirez, 2020). On the other hand, the effect Tree-ring sectoring allowed us to enhance the overall quality
of climatic conditions on growth and carbon dynamics in of dendroclimatic relationships with lumen diameter in
P. menziesii (Peltier et al., 2018), as well as in other western P. menziesii by targeting the most signal-rich sectors of the
United States conifers (Szejner et al., 2018), is known to last ring. This was possible because sampled trees had wide rings
for several years. Plant-dependent controls acting on the timing, and enough cells to make numerous meaningful subdivisions.
rate, and duration of cell wall thickening generally reflect a Intra-annual variability characterized each anatomical parameter
conservative strategy adapted to aridity for maintaining hydraulic at all positions along the ring, especially in the first sectors
integrity (Cuny et al., 2015; Cuny and Rathgeber, 2016). However, (i.e., I to V), roughly corresponding to the earlywood. Intra-
under water-limited conditions, P. menziesii seems to respond annual patterns of LD and CWT, as illustrated by 1966–2015
to climatic variability primarily by adjusting lumen size to standardized tracheidograms, were characterized by a constant
Frontiers in Plant Science | www.frontiersin.org 7 September 2021 | Volume 12 | Article 702442Balanzategui et al. Wood Anatomy of Douglas-Fir
A
B
FIGURE 5 | Correlations of sector chronologies of lumen diameter with daily (A) maximum temperature (Tmax) and (B) precipitation for the period 1981 to 2015.
The horizontal length of each bar corresponds to the strongest optimal period identified by the moving window correlation analysis. All correlations, whose value is
given by the color, are significant at p < 0.05.
decrease of lumen diameter and gradual thickening of cell and lumen diameter found for sectors I to V was with a
walls, without any major, stand-wide intra-annual density period ranging from October to January, while it transitioned
fluctuations. LD chronologies showed a consistent inter-annual to a spring–summer signal starting with sector VI (Figure 5).
pattern of synchronous variability among trees in the earlywood, In the southwestern United States, winter temperature may
but the common signal gradually decreased approaching the affect snowpack dynamics by favoring snow sublimation, reducing
earlywood/latewood transition zone approximately around the amount of water penetrating the ground at the time of
sector V or VI and disappeared in the later sectors. snow melting (Sheppard et al., 2002). Furthermore, air
Climate-anatomy correlations established for lumen diameter temperature is tightly related to cloudiness and inversely related
of P. menziesii showed the predominant cold-season signal in to snowy precipitation during the cold season. Hence,
the first half of the ring, while the contribution of spring previous winter temperature influences the morphogenesis of
climate, although present (see Supplementary Figures S2, S3), the first ring cells of each ring (Wang et al., 2002;
was lower. The strongest correlation between daily temperature Martin-Benito et al., 2013; Novak et al., 2013), while summer
Frontiers in Plant Science | www.frontiersin.org 8 September 2021 | Volume 12 | Article 702442Balanzategui et al. Wood Anatomy of Douglas-Fir
inversion in the sign of correlation between precipitation and
A lumen size (Supplementary Figures S2, S3). However, these
two temporal windows showed an overall weaker correlation
strength and were not considered useful for further
dendroclimatic investigation. In addition to site-specific
differences, particularly in seasonal dynamics of moisture
availability, it should be noted that discrepancies in the temporal
window of climatic responses between our study and previous
ones could also be a consequence of parameter selection, i.e.,
tree-ring partitioning versus a whole ring approach, that in
this case allowed us to focus on the climatic signal recorded
in specific, signal-rich portions of the ring.
Under limiting conditions, the cellular response of tree
B species to changing moisture conditions is expected to act on
lumen size rather than their quantity (Olano et al., 2012).
Furthermore, tracheid dimensions are directly dependent on
the hydration status of the tree stem during the time of cell
formation when water is needed to maintain adequate turgor
during the cell enlargement phase (Arzac et al., 2018; Cabon
et al., 2020). We observed sensitivity to drought in P. menziesii,
although the strongest relationship was with previous cold-
season climate, which is far from contemporaneous with the
timing of the cell enlargement phase, and got weaker with
spring conditions. It should be noted that in the mountain
ranges of the western United States, winter October–April
precipitation falls mainly as snow, contributing to the formation
of the snowpack, which in turn determines soil moisture at
FIGURE 6 | Normalized time series of radial lumen diameter chronologies for the beginning of the growing season and the amount of water
sector I and for the average between sectors I-V plotted against available for the resumption of cambial processes (Maurer and
(A) temperature and (B) precipitation. Climate data are the average daily
Tmax from September 25th to January 23rd, and the sum of daily precipitation
Bowling, 2014). Hence, snowpack dynamics can affect inter-
from previous October 27th to current February 13th. The sector I chronology annual variability of cellular structures and explain a large
of lumen diameter is shown with opposite sign for easier comparison with the proportion of the observed variance in earlywood tracheids
temperature time series. (Ziaco, 2020). A drought signal in xylem anatomy of P. menziesii
was demonstrated by the correlation between LD in the earlywood
and the SPEI-1 for the months October to January. This
temperature conditions, and their control on evaporative demand correlation is particularly relevant, as the SPEI-1
and drought stress in particular, become more important later includes potential evapotranspiration, possibly capturing the
in the growing season especially around sectors VIII and IX effect of water deficit/surplus on tree growth and xylem features
(Cuny and Rathgeber, 2016; Cuny et al., 2019). The similar (Vicente-Serrano et al., 2010).
temporal response to temperature across LD sectors in the
first half of the ring suggests that these trees experience fast
rates of xylem production in the spring, aimed at maximizing Correlations With Supra-Regional Climatic
radial growth when evapotranspiration is less demanding, and to Patterns
avoid the negative effects of spring temperature We have shown that annually resolved time series of lumen
(Supplementary Figures S2, S3). The previous cold-season diameter (LD) hold great potential for linking local temperature
precipitation signal persisted, although decreasing in strength, and precipitation patterns with large-scale climatic modes in
throughout the entire ring. This consistent pattern of correlation the southwestern United States. This was possible due to the
across the tree ring confirms the importance of winter strong climatic signal encoded in cellular structures, and the
precipitation for western conifers (Kerhoulas et al., 2013) and possibility to enhance the temporal resolution of dendroclimatic
its footprint on wood anatomy even in the core area of the correlations using tree-ring partitioning and daily climatic
NAM (Ziaco et al., 2018), whereas under non-monsoonal records. Regional correlation fields suggested that the climatic
climatic regimes other species tend to show a predominant signal encoded in P. menziesii tracheids accurately reproduced
response to current year precipitation (Ziaco et al., 2016). In the same hydroclimatic pattern over the entire American
line with this, we also found that positive effects of precipitation southwest typically shaped by large-scale winter climatic modes
on lumen diameter persisted until May in sectors I, and within (St. George et al., 2010). Weather conditions along western
the average of sectors I-V. However, in a short temporal window North America are associated with ocean–atmosphere variability
of 23 days (from June 28th to July 20th), we observed a temporary over the Pacific Basin, which is responsible for regulating
Frontiers in Plant Science | www.frontiersin.org 9 September 2021 | Volume 12 | Article 702442Balanzategui et al. Wood Anatomy of Douglas-Fir
A B
C D
FIGURE 7 | Spatial field correlation maps between selected radial lumen diameter sector chronologies and climate parameters for the period 1981–2015. Sector
I chronology was correlated against (A) mean October to January temperature (C) October to January one-month Standardized Precipitation and Evaporation Index,
and (D) October to January sea surface temperature. Mean chronology for sectors I-V was correlated against (B) November to January precipitation. The location of
the study site is identified by a black dot. Colored areas show correlations significant at p < 0.05.
moisture transport at intra-annual to multidecadal time scales on winter precipitation in the southwest (Gershunov and Barnett,
(Cook et al., 2004; Potito and MacDonald, 2008; Li et al., 1998). Instrumental records (Mantua et al., 1997) indicate the
2014). LD in the first half of the tree ring showed positive beginning of a warm phase of the PDO in 1977 with several
correlations with winter SST over the central-eastern Pacific, ENSO events starting right after that period and typically
and negative ones over the western and southern Pacific. This peaking in activity during the northern hemisphere winter.
correlation pattern reflects the typical conditions leading to This warm PDO phase leads to wetter than normal conditions
El Niño episodes in the United States southwest (Feldl and over the American southwest, including southern California,
Roe, 2010). This kind of signal is found in earlywood ring- Arizona, and New Mexico (Sheppard et al., 2002). By applying
width chronologies of several conifer species of the southwestern a cross-wavelet transform, we found a significant inverse
United States, including P. menziesii (Stahle et al., 1998), but relationship between time series of LD in sector I and I-V
it has not been observed in time series of wood with SOI for the period 1980–2005, which corresponds with
anatomical parameters. the last warm PDO phase.
Teleconnections between different modes of atmospheric We found no significant LD correlations with climatic parameters
circulation over the Pacific Ocean are responsible for a well that would suggest an influence of the NAM on tracheid size.
pronounced NW/SW dipole of precipitation patterns (Brown This was an unexpected result because the NAM is extremely
and Comrie, 2004). Hence, when the PDO is in its constructive important for relieving summer drought in the southwestern
(warm) phase, it can strengthen the influence of ENSO and United States, and previous tree-ring network studies indicated
lead to stronger El Niño events, which can amplify the effect a direct NAM effect on the annual variability of P. menziesii
Frontiers in Plant Science | www.frontiersin.org 10 September 2021 | Volume 12 | Article 702442Balanzategui et al. Wood Anatomy of Douglas-Fir
A
B
FIGURE 8 | (A) Normalized time series of earlywood lumen diameter (sectors I and I-V) plotted against previous October-current January Southern Oscillation Index
(SOI) for the period 1966 to 2015 (bold lines are 5-year cubic smoothing splines). The sign of SOI has been inverted for easier interpretation. (B) Cross-wavelet
transform of lumen diameter (sectors I and I-V) and SOI index. White contours represent 95% significance level. The relative phase relationship is shown as arrows
(in-phase pointing right, anti-phase pointing left, and SOI leading lumen diameter by 90° pointing down). Results falling outside the cone of influence (white shaded
area) might be distorted by edge effect.
latewood width (Griffin et al., 2013). The short, intense, and be noted that these sites were selected for their cold-season signal
localized nature of NAM thunderstorms mitigates (see Supplementary Figure S1), therefore it is possible that winter,
evapotranspiration demands of trees exposed to summer drought, and to a lesser extent early spring precipitation, is generally
reduces tree water deficit, and by increasing cell turgor potentially enough to support growth in this species, making it insensitive
promotes the temporal reactivation of cambial activity (Vieira to summer precipitation; in fact, decreased sensitivity to monsoonal
et al., 2014), resulting in cell division and wider latewood bands precipitation after a wet winter has been documented in other
(Griffin et al., 2013). However, it is likely that on the sloping western conifers (Ziaco et al., 2018). A recent dendroclimatic
terrain that dominates the topography of our sites, large volumes reconstruction of seasonal hydroclimate based on earlywood and
of monsoonal rainwater might be lost as runoff instead of latewood chronologies has demonstrated that ENSO-driven winter
recharging soil water storage, limiting the beneficial effects of climate is the main driver of precipitation anomalies in this
summer precipitation on tree hydration status (i.e., on cell turgor), region, also highlighting the weaker signal recorded in latewood
and thus reducing its footprint on xylem anatomy, in particular chronologies of Pinus ponderosa at our study sites
on the radial diameter of newly formed cells, compared to the (Ziaco et al., 2020). Finally, it should be noted that latewood
observed winter-dominant correlation. Furthermore, it should chronologies of P. menziesii from the four corners region show
Frontiers in Plant Science | www.frontiersin.org 11 September 2021 | Volume 12 | Article 702442Balanzategui et al. Wood Anatomy of Douglas-Fir
a high correlation with previous earlywood width (Torbenson DATA AVAILABILITY STATEMENT
et al., 2016). In our study, we noticed the absence of first-order
autocorrelation for both earlywood and latewood time series of The raw data supporting the conclusions of this article will
lumen diameter, which may therefore augment precipitation be made available by the authors, without undue reservation.
reconstructions based on earlywood and latewood widths without All codes for the analyses presented in this document will be
the need to deal with autocorrelation of anatomical parameters
made available upon request.
(Carrillo et al., 2016).
CONCLUSION AUTHORS CONTRIBUTIONS
Wood anatomical analysis of Douglas-fir growing at high DB, IH, FB, and EZ conceived the research design and the
elevations in eastern Arizona showed the dendroclimatic potential sampling procedures. NM and EZ conducted the sample collection.
of lumen radial diameter. Correlation analyses between intra- NM developed the ring-width chronologies. DB, HN, and AH
annual cell features and climatic conditions suggested that performed the wood anatomical sample preparation,
intra-annual cell morphogenesis is driven by climatic conditions measurements, and elaboration of raw data. DB, HN, IH, FB,
during the winter. Cold-season temperature and precipitation and EZ performed the dendroclimatic analysis, developed the
were related to radial lumen diameter, while precipitation during
hypotheses, and wrote the initial draft of the manuscript. All
the current growing season did not have a significant effect
on tracheid dimensions. Snowpack formation during the dormant authors contributed to the final version.
period and cool-season temperature, affecting the amount of
water available at the beginning of the growing season, appeared
to be a more relevant limiting factor for intra-annual xylem FUNDING
adjustment than summertime precipitation events and their
relieving effect on evapotranspiration demands. This research was funded, in part, by the US National Science
Our findings are species specific and further investigation into Foundation under grants AGS-P2C2-1502379 to FB and EZ.
the timing and kinetics of cell formation in this species at a FB was also supported, in part, by NSF grant AGS-P2C2-
similar topographically extreme site would help to refine the strong 1903561. The views and conclusions contained in this document
link observed between lumen size and winter climate and also are those of the authors and should not be interpreted as
assist in explaining the missing summer precipitation signal. Spatial
representing the opinions or policies of the funding agencies
field correlations indicated a significant influence of ENSO and,
and supporting institutions.
to a lesser extent, PDO patterns on the precipitation regime,
particularly when in their “constructive” (warm) phases. By
combining high-resolution climatic data and new analytical
techniques, we uncovered the potential of cell structural SUPPLEMENTARY MATERIAL
characteristics for reconstructing climatic conditions in mountainous
environments with the intention to improve our understanding The Supplementary Material for this article can be found online
of teleconnections between climate dynamics in the Pacific region at: https://www.frontiersin.org/articles/10.3389/fpls.2021.702442/
and local hydroclimatic variability in the southwestern United States. full#supplementary-material
Bouriaud, O., Leban, J. M., Bert, D., and Deleuze, C. (2005). Intra-annual
REFERENCES variations in climate influence growth and wood density of Norway spruce.
Tree Physiol. 25, 651–660. doi: 10.1093/treephys/25.6.651
Arzac, A., Babushkina, E. A., Fonti, P., Slobodchikova, V., Sviderskaya, I. V.,
and Vaganov, E. A. (2018). Evidences of wider latewood in Pinus sylvestris Brown, D. P., and Comrie, A. C. (2004). A winter precipitation ‘dipole’ in the
from a forest-steppe of southern Siberia. Dendrochronologia 49, 1–8. doi: western United States associated with multidecadal ENSO variability. Geophys.
10.1016/j.dendro.2018.02.007 Res. Lett. 31, L09203. doi: 10.1029/2003GL018726
Barnett, T. P., Latif, M., Kirk, E., and Roeckner, E. (1991). On ENSO physics. Bunn, A.G., Korpela, M., Biondi, F., Campelo, F., Mérian, P., Mudelsee, M.,
J. Clim. 4, 487–515. doi: 10.1175/1520-0442(1991)0042.0.CO;2 et al. (2014). “dplR: Dendrochronology Program Library in R.” R package
Beck, W., Sanders, T. G. M., and Pofahl, U. (2013). CLIMTREG: detecting version 1.5.9 ed: http://CRAN.R-project.org/package=dplR.
temporal changes in climate-growth reactions - a computer program using Cabon, A., Peters, R. L., Fonti, P., Martínez-Vilalta, J., and De Cáceres, M.
intra-annual daily and yearly moving time intervals of variable width. (2020). Temperature and water potential co-limit stem cambial activity along
Dendrochronologia 31, 232–241. doi: 10.1016/j.dendro.2013.02.003 a steep elevational gradient. New Phytol. 226, 1325–1340. doi: 10.1111/
Beguería, S., Vicente-Serrano, S. M., Reig, F., and Latorre, B. (2014). Standardized nph.16456
precipitation evapotranspiration index (SPEI) revisited: parameter fitting, Campelo, F., Nabais, C., Gutiérrez, E., Freitas, H., and García-González, I.
evapotranspiration models, tools, datasets and drought monitoring. Int. J. (2010). Vessel features of quercus ilex L. growing under Mediterranean
Climatol. 34, 3001–3023. doi: 10.1002/joc.3887 climate have a better climatic signal than tree-ring width. Trees 24, 463–470.
Biondi, F., Gershunov, A., and Cayan, D. R. (2001). North Pacific decadal doi: 10.1007/s00468-010-0414-0
climate variability since 1661. J. Clim. 14, 5–10. doi: Carbone, M. S., Czimczik, C. I., Keenan, T. F., Murakami, P. F., Pederson, N.,
10.1175/1520-0442(2001)0142.0.CO;2 Schaberg, P. G., et al. (2013). Age, allocation and availability of nonstructural
Frontiers in Plant Science | www.frontiersin.org 12 September 2021 | Volume 12 | Article 702442Balanzategui et al. Wood Anatomy of Douglas-Fir carbon in mature red maple trees. New Phytol. 200, 1145–1155. doi: 10.1111/ González-Cásares, M., Camarero, J. J., Colangelo, M., Rita, A., and nph.12448 Pompa-García, M. (2019). High responsiveness of wood anatomy to water Carrer, M., Castagneri, D., Prendin, A. L., Petit, G., and von Arx, G. (2017). availability and drought near the equatorial rear edge of Douglas-fir. Can. Retrospective analysis of wood anatomical traits reveals a recent extension J. For. Res. 49, 1114–1123. doi: 10.1139/cjfr-2019-0120 in tree cambial activity in two high-elevation conifers. Front. Plant Sci. Griffin, D., Woodhouse, C. A., Meko, D. M., Stahle, D. W., Faulstich, H. L., 8:737. doi: 10.3389/fpls.2017.00737 Carrillo, C., et al. (2013). North American monsoon precipitation reconstructed Carrillo, C. M., Castro, C. L., Woodhouse, C. A., and Griffin, D. (2016). Low- from tree-ring latewood. Geophys. Res. Lett. 40, 954–958. doi: 10.1002/grl.50184 frequency variability of precipitation in the North American monsoon region Grinsted, A., Moore, J. C., and Jevrejeva, S. (2004). Application of the cross as diagnosed through earlywood and latewood tree-ring chronologies in wavelet transform and wavelet coherence to geophysical time series. Nonlin. the southwestern US. Int. J. Climatol. 36, 2254–2272. doi: 10.1002/joc.4493 Processes. Geophys. 11, 561–566. doi: 10.5194/npg-11-561-2004 Carvalho, A., Nabais, C., Vieira, J., Rossi, S., and Campelo, F. (2015). Plastic Grissino-Mayer, H. D., and Fritts, H. C. (1997). The international tree-ring response of tracheids in Pinus pinaster in a water-limited environment: data bank: an enhanced global database serving the global scientific community. adjusting lumen size instead of wall thickness. PLoS One 10:e0136305. The Holocene 7, 235–238. doi: 10.1177/095968369700700212 doi:10.1371/journal.pone.0136305, PMID: 26305893. Herrera-Ramirez, D., Muhr, J., Hartmann, H., Roemermann, C., Trumbore, S., Castagneri, D., Fonti, P., von Arx, G., and Carrer, M. (2017). How does climate and Sierra, C. A. (2020). Probability distributions of nonstructural carbon influence xylem morphogenesis over the growing season? Insights from ages and transit times provide insights into carbon allocation dynamics of long-term intra-ring anatomy in Picea abies. Ann. Bot. 119, 1011–1020. mature trees. New Phytol. 226, 1299–1311. doi: 10.1111/nph.16461 doi: 10.1093/aob/mcw274 Hughes, M.K., Swetnam, T.W., and Diaz, H.F. (2011). Dendroclimatology. Springer Contributors of the International Tree-Ring Data Bank (2020). International Netherlands: Progress and Prospects. Tree-Ring Data Bank (ITRDB) [Online]. Available at: https://www.ncei.noaa. Jana, S., Rajagopalan, B., Alexander, M. A., and Ray, A. J. (2018). Understanding gov/products/paleoclimatology/tree-ring. (Accessed March 2021). the dominant sources and tracks of moisture for summer rainfall in the Southwest Cook, E. R., Woodhouse, C. A., Eakin, C. M., Meko, D. M., and Stahle, D. W. United States. J Geophys Res Atmo 123, 4850–4870. doi: 10.1029/2017JD027652 (2004). Long-term aridity changes in the Western United States. Science Jong, B.-T., Ting, M., Seager, R., Henderson, N., and Lee, D. E. (2018). Role of 306, 1015–1018. doi: 10.1126/science.1102586 equatorial Pacific SST forecast error in the late winter California precipitation Core Team, R (2021). R: A Language and Environment for Statistical Computing. forecast for the 2015/16 El Niño. J. Clim. 31, 839–852. doi: 10.1175/JCLI-D-17-0145.1 Vienna, Austria: R Foundation for Statistical Computing. Kerhoulas, L. P., Kolb, T. E., and Koch, G. W. (2013). Tree size, stand density, and Corringham, T. W., and Cayan, D. R. (2019). The effect of El Niño on flood the source of water used across seasons by ponderosa pine in northern Arizona. damages in the Western United States. Weather. Clim. Soc. 11, 489–504. For. Ecol. Manag. 289(Supplement C), 425–433. doi: 10.1016/j.foreco.2012.10.036 doi: 10.1175/WCAS-D-18-0071.1 Land, A., Kromer, B., Remmele, S., Brehm, N., and Wacker, L. (2020). Complex Cuny, H. E., Fonti, P., Rathgeber, C. B. K., von Arx, G., Peters, R. L., and Frank, D. C. imprint of solar variability on tree rings. Env Res Comm 2:101003. doi: (2019). Couplings in cell differentiation kinetics mitigate air temperature influence 10.1088/2515-7620/abc063 on conifer wood anatomy. Plant Cell Env 42, 1222–1232. doi: 10.1111/pce.13464 Lauder, J. D., Moran, E. V., and Hart, S. C. (2019). Fight or flight? Potential Cuny, H. E., and Rathgeber, C. B. K. (2016). Xylogenesis: coniferous trees of tradeoffs between drought defense and reproduction in conifers. Tree Phys temperate forests are listening to the climate tale during the growing season 39, 1071–1085. doi: 10.1093/treephys/tpz031 But only remember the last words! Plant Phys 171, 306–317. doi: 10.1104/ Li, P., and Adams, W. T. (1989). Range-wide patterns of allozyme variation in pp.16.00037 Douglas-fir (Pseudotsuga menziesii). Can. J. For. Res. 19, 149–161. doi: Cuny, H. E., Rathgeber, C. B. K., Frank, D., Fonti, P., Mäkinen, H., Prislan, P., 10.1139/x89-022 et al. (2015). Woody biomass production lags stem-girth increase by over one Li, J., Xie, S.-P., and Cook, E. R. (2014). El Niño phases embedded in Asian month in coniferous forests. Nat. Plants. 1:15160. doi: 10.1038/nplants.2015.160 and North American drought reconstructions. Quat Sci Rew 85, 20–34. doi: Daly, C., Halbleib, M., Smith, J. I., Gibson, W. P., Doggett, M. K., Taylor, G. H., 10.1016/j.quascirev.2013.11.014 et al. (2008). Physiographically sensitive mapping of climatological temperature Liang, W., Heinrich, I., Helle, G., Liñán, I. D., and Heinken, T. (2013a). Applying and precipitation across the conterminous United States. Int. J. Climatol. CLSM to increment core surfaces for histometric analyses: a novel advance 28, 2031–2064. doi: 10.1002/joc.1688 in quantitative wood anatomy. Dendrochronologia 31, 140–145. doi: 10.1016/j. DeSoto, L., De la Cruz, M., and Fonti, P. (2011). Intra-annual patterns of tracheid dendro.2012.09.002 size in the Mediterranean tree Juniperus thurifera as an indicator of seasonal Liang, W., Heinrich, I., Simard, S., Helle, G., Linan, I. D., and Heinken, T. water stress. Can. J. For. Res. 41, 1280–1294. doi: 10.1139/x11-045 (2013b). Climate signals derived from cell anatomy of scots pine in NE Edwards, J., Anchukaitis, K. J., Zambri, B., Andreu-Hayles, L., Oelkers, R., Germany. Tree Phys 33, 833–844. doi: 10.1093/treephys/tpt059 D'Arrigo, R., et al. (2020). Intra-annual climate anomalies in northwestern Mantua, N. J., and Hare, S. R. (2002). The Pacific decadal oscillation. J Ocean North America following the 1783-1784 CE Laki eruption. J. Geophys. Res. 58, 35–44. doi: 10.1023/A:1015820616384 Atmo. 126:e2020JD033544. doi: 10.1029/2020JD033544 Mantua, N. J., Hare, S. R., Zhang, Y., Wallace, J. M., and Francis, R. C. (1997). Feldl, N., and Roe, G. H. (2010). Synoptic weather patterns associated with A Pacific interdecadal climate oscillation with impacts on Salmon production*. intense ENSO rainfall in the Southwest United States. Geophys. Res. Lett. Bull. Am. Meteorol. Soc. 78, 1069–1080. doi: 10.1175/1520-0477(1997)0782.0.co;2 Fonti, P., and García-González, I. (2004). Suitability of chestnut earlywood Martin-Benito, D., Beeckman, H., and Canellas, I. (2013). Influence of drought on vessel chronologies for ecological studies. New Phytol. 163, 77–86. doi: tree rings and tracheid features of Pinus nigra and Pinus sylvestris in a Mesic 10.1111/j.1469-8137.2004.01089.x Mediterranean forest. Eur. J. For. Res. 132, 33–45. doi: 10.1007/s10342-012-0652-3 Fonti, P., and García-Gonzalez, I. (2008). Earlywood vessel size of oak as a Maurer, G. E., and Bowling, D. R. (2014). Seasonal snowpack characteristics influence potential proxy for spring precipitation in mesic sites. J. Biogeogr. 35, soil temperature and water content at multiple scales in interior western U.S. 2249–2257. doi: 10.1111/j.1365-2699.2008.01961.x mountain ecosystems. Water Resour. Res. 50, 5216–5234. doi: 10.1002/2013WR014452 García-González, I., and Eckstein, D. (2003). Climatic signal of earlywood vessels Mitchell, T. D., and Jones, P. D. (2005). An improved method of constructing of oak on a maritime site. Tree Phys 23, 497–504. doi: 10.1093/treephys/23.7.497 a database of monthly climate observations and associated high-resolution Gartner, H., and Nievergelt, D. (2010). The core-microtome: a new tool for grids. Int. J. Climatol. 25, 693–712. doi: 10.1002/joc.1181 surface preparation on cores and time series analysis of varying cell parameters. Novak, K., de Luis, M., Raventos, J., and Cufar, K. (2013). Climatic signals Dendrochronologia 28, 85–92. doi: 10.1016/j.dendro.2009.09.002 in tree-ring widths and wood structure of Pinus halepensis in contrasted Gärtner, H., and Schweingruber, F. (2013). Microscopic Preparation Techniques environmental conditions. Trees 27, 927–936. doi: 10.1007/s00468-013-0845-5 for Plant Stem Analysis. Remagen, Germany: Verlag Kessel. Olano, J. M., Eugenio, M., Garcia-Cervigon, A. I., Folch, M., and Rozas, V. Gershunov, A., and Barnett, T. P. (1998). Interdecadal modulation of ENSO (2012). Quantitative tracheid anatomy reveals a complex environmental teleconnections. Bull. Am. Meteorol. Soc. 79, 2715–2726. doi: control of wood structure in continental mediterranean climate. Intl J Plant 10.1175/1520-0477(1998)0792.0.co;2 Sci 173, 137–149. doi: 10.1086/663165 Frontiers in Plant Science | www.frontiersin.org 13 September 2021 | Volume 12 | Article 702442
You can also read