2021 Operating Year Irrigation and 2022 Crop Management Plan - Richland Facility Lamb Weston, Inc. Richland, Washington February 2022
←
→
Page content transcription
If your browser does not render page correctly, please read the page content below
2021 Operating Year Irrigation and
2022 Crop Management Plan
Richland Facility

Lamb Weston, Inc.
Richland, Washington
February 2022

2021 Operating Year Irrigation and
   2022 Crop Management Plan
   Lamb Weston, Inc.
   Richland, Washington

   Prepared For:                                               Lamb Weston, Inc.
                                                               2013 Saint Street
                                                               Richland, Washington 99354
                                                               (509) 375-4181

   Prepared By:                                                Cascade Earth Sciences
                                                               12720 E Nora Avenue, Suite A
                                                               Spokane Valley, Washington 99216
                                                               (509) 921-0290

                                                               Steven L. Venner, Managing Scientist                      02/21/22
                                                               Cascade Earth Sciences

Disclaimer: The contents of this document are confidential to the intended recipient at the location to which it is addressed. The
contents may not be changed, edited, and/or deleted. The information contained in this document is only valid on the date indicated
on the original project file report retained by CES. By accepting this document, you understand that neither CES nor its parent
company, Valmont Industries, Inc. (Valmont) accepts any responsibility for liability resulting from unauthorized changes, edits, and/or
deletions to the information in this document.
CONTENTS
EXECUTIVE SUMMARY ........................................................................................................... iv
1.0     INTRODUCTION AND OBJECTIVES ................................................................................1
2.0 ANNUAL SUMMARY OF FARM OPERATIONS FOR THE 2021 OPERATING
YEAR ...............................................................................................................................................1
    2.1 Process Water Quantity and Quality .................................................................................. 1
    2.2 Hydraulic Loading .............................................................................................................. 2
    2.3 Constituent Loadings .......................................................................................................... 2
    2.4 Monitoring .......................................................................................................................... 3
            2.4.1 Crop Monitoring..................................................................................................... 3
            2.4.2 Soil Hydraulic Budgets .......................................................................................... 3
            2.4.3 Soil Moisture Monitoring....................................................................................... 3
            2.4.4 Soil Chemistry ........................................................................................................ 3
            2.4.5 Groundwater Monitoring ....................................................................................... 5
    2.5 Evaluation of System Performance .................................................................................... 5
            2.5.1 Crop Performance .................................................................................................. 6
            2.5.2 Hydraulic Performance .......................................................................................... 6
            2.5.3 Groundwater Evaluation ........................................................................................ 6
3.0     CROPPING AND IRRIGATION SCHEDULE FOR THE 2022 OPERATING YEAR .......6
        3.1 Cropping ............................................................................................................................. 6
        3.2 Process Water Flow and Irrigation Loadings ..................................................................... 6
        3.3 Constituent Loadings .......................................................................................................... 7
REFERENCES ................................................................................................................................8

                                                                   TABLES
Table 1.              Process Water Volume Summary
Table 2.              Irrigated Process Water Quality Summary
Table 3.              Monthly Summary of Irrigated Process and Fresh Water
Table 4.              Annual Constituent Loading Summary
Table 5.              Crop Yield and Nitrogen Removal
Table 6.              Nutrient Balances
Table 7.              Summary of Field-Specific Soil Hydraulic Budgets
Table 8.              Soil Analyses Results – Spring 2021
Table 9.              Soil Analyses Results – Fall 2021
Table 10.             Average Groundwater Monitoring Data Summary
Table 11.             Projected 2022 Operating Year Irrigation Water Distribution
Table 12.             Projected 2022 Operating Year Soil Hydraulic Budget – Pivot 1
Table 13.             Projected 2022 Operating Year Soil Hydraulic Budget – Pivot 2
Table 14.             Projected 2022 Operating Year Soil Hydraulic Budget – Pivot 3
Table 15.             2022 Operating Year Projection Summary

Lamb Weston – Richland, WA                                                                                           2022 Operating Year ICMP
Doc: 2021210032 LWR 2022 ICMP.docx                                                                                     February 2022 | Page ii
CONTENTS (continued)
FIGURES
Figure 1. Site Location Map
Figure 2. Site Detail
CHARTS
Chart 1. Groundwater Chloride and Nitrate-Nitrogen Trends – Monitoring Wells 1, 3, and 5
Chart 2. Groundwater Chloride and Nitrate-Nitrogen Trends – Monitoring Wells 1, 2, and 4
Chart 3. Groundwater Chloride and Nitrate-Nitrogen Trends – Monitoring Wells 1 and 6 and
Center Well
APPENDICES
Appendix A. 2021 Operating Year Fertilizer Application
Appendix B. Crop Harvest, Plant Tissue Analysis, and Nutrient Uptake Data
Appendix C1. Calculated Field Soil Hydraulic Budgets – Pivot 1 and Pivot 2
Appendix C2. Calculated Field Soil Hydraulic Budgets – Pivot 3
Lamb Weston – Richland, WA 2022 Operating Year ICMP
Doc: 2021210032 LWR 2022 ICMP.docx February 2022 | Page iiiEXECUTIVE SUMMARY During the 2021 operating year (November 1, 2020, through October 31, 2021), Lamb Weston, Inc. in Richland, Washington managed 859.92 million gallons of treated process water by discharging either to the Yakima River outfall and/or land applying as irrigation for forage crops under National Pollutant Discharge Elimination System Waste Discharge Permit No. WA0052141 (Permit). This annual Irrigation and Crop Management Plan is required by March 1 each year per Permit Special Condition S7. In the 2021 operating year, a total of 735.17 million gallons of treated process water was discharged to the Yakima River outfall and 124.75 million gallons of treated process water was irrigated to forage crops. Crop water demand was supplemented with a total of 271.25 million gallons of fresh irrigation water supplied by the City of Richland. Irrigation management was practiced using an irrigation scheduling program and soil moisture monitoring. Field-specific calculated leaching fractions were less than the salts management leaching requirement on all fields. The fields produced an alfalfa forage crop, wheat grain, and wheat straw. Field-specific nitrogen balances ranged from deficits of -1 pound per acre in Pivot 3 to a surplus of 200 pounds per acre in Pivot 2. Fall soil test results indicate a moderate amount of residual nitrogen in the profile for all fields. Downgradient groundwater monitoring indicated decreasing chloride trends in the majority of monitoring wells during the 2021 operating year, and increasing nitrate-nitrogen trends in the majority of monitoring wells when comparing beginning and end of year nitrate-nitrogen concentrations. The Cropping and Irrigation Schedule for the 2022 operating year has been prepared to manage process and fresh irrigation water to meet site capacities and maximize crop performance for effective process water recycling. The proposed Irrigation and Crop Management Plan projects a site-wide balance of nitrogen loadings on all fields during the 2022 operating year. Actual irrigation loadings will be managed and adjusted throughout the year according to process water constituent concentrations, calculated and measured soil moisture, and nitrogen balances for each field. Lamb Weston – Richland, WA 2022 Operating Year ICMP Doc: 2021210032 LWR 2022 ICMP.docx February 2022 | Page iv
1.0 INTRODUCTION AND OBJECTIVES
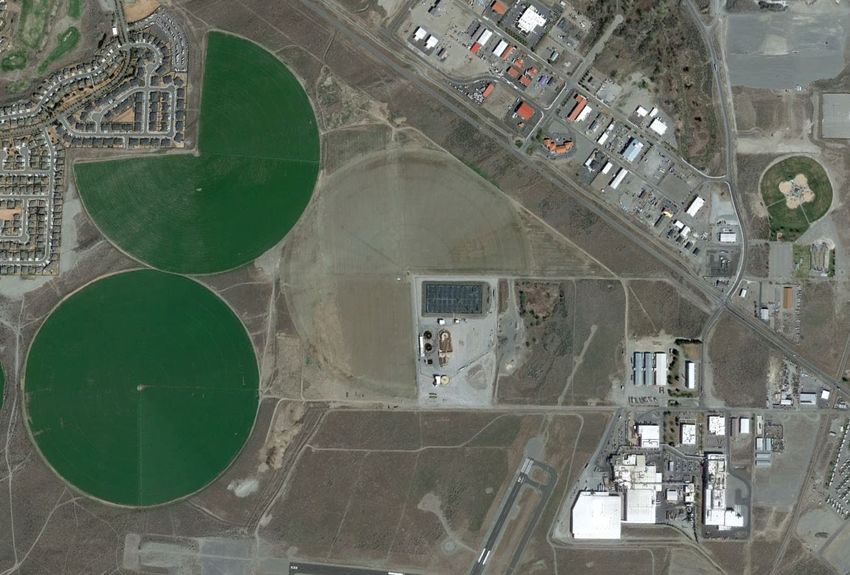
Lamb Weston, Inc. (Lamb Weston) operates a potato processing facility (Facility) in Richland,
Washington (Figure 1). The process wastewater generated during potato processing is managed
under National Pollutant Discharge Elimination System Waste Discharge Permit No. WA0052141
(Permit) (State of Washington Department of Ecology, 2017). This annual Irrigation and Crop
Management Plan (ICMP) is required by March 1 of each year per Permit Special Condition S7. It
includes an Annual Summary of Farm Operations for the 2021 operating year and a Cropping and
Irrigation Schedule for the 2022 operating year to meet the requirements of Permit Special
Conditions S7.A and S7.B, respectively.
Following treatment, the treated process water (process water) is discharged to the Yakima River
outfall #001 (Yakima River outfall) or land applied as irrigation for forage crops (i.e., land
application treatment farm; Figure 2). Discharge at the river outfall is permitted year round per the
July 2017 Permit modification, while discharge to the sprayfields as irrigation for forage crop
production is permitted from March through November. Discharge to the sprayfields during
December, January, and February may be allowed on a limited basis when complying with the
bypass provisions of Permit Special Condition S4.B (State of Washington Department of Ecology,
2017, p. 7).
This ICMP addresses the performance of the land application treatment farm (Site) including
process water flow and quality, crop nitrogen uptake, soil fertility status, and groundwater quality. It
includes a brief summary of river discharge volumes because they are part of the total Facility flow.
It also summarizes the land application data collected during the 2021 operating year.
2.0 ANNUAL SUMMARY OF FARM OPERATIONS FOR THE 2021 OPERATING
YEAR
The Annual Summary of Farm Operations for the 2021 operating year covers data from
November 1, 2020, through October 31, 2021.
2.1 Process Water Quantity and Quality
A total of 859.92 million gallons (MG) of treated process water was either discharged to the
Yakima River outfall and/or land applied to the Site for irrigating crops (Table 1). Total process
water volume discharge to the Yakima River outfall was 735.17 MG (85% of total flow). Total
irrigated process water volume was 124.75 MG.
During the 2021 operating year, the average monthly process water discharge to the Yakima River
outfall was less than the Permit limit of 3.0 million gallons per day (MGD; Table 1). Average
monthly process water discharge to the Yakima River outfall ranged from 1.29 to 2.30 MGD. Daily
maximum discharge to the Yakima River outfall ranged from 2.52 to 2.93 MGD and was less than
the Permit limit of 4.02 MGD (Table 1).
In accordance with Permit Special Condition S2.B, process water applied to the sprayfields is
monitored for quality after the sand filters. Samples are collected over a composite 24-hour period.
Table 2 shows a summary of the monthly average irrigated process water quality for the 2021
Lamb Weston – Richland, WA 2022 Operating Year ICMP
Doc: 2021210032 LWR 2022 ICMP.docx February 2022 | Page 1operating year, which are used to calculate nutrient loadings. Detailed information can be obtained from the monthly Discharge Monitoring Reports (DMRs) submitted to the State of Washington Department of Ecology (Ecology). Annual flow weighted average concentrations of five-day biochemical oxygen demand (BOD5) and total nitrogen were 2.6 and 136.6 milligrams per liter (mg/L), respectively (Table 2). Annual flow weighted average concentration of fixed dissolved solids (FDS) was 1,619 mg/L. 2.2 Hydraulic Loading Process water supplied 32% (124.75 MG) of the total applied irrigation (396.00 MG) with the annual total irrigated process water ranging from 3.5 inches on Pivot 3 to 25.0 inches on Pivot 1 (Table 3). The annual total irrigated process water volume of 124.75 MG was more than the projected total of 71.92 MG (Table 3). In addition, 271.25 MG of supplemental fresh irrigation water was supplied from the City of Richland. The annual total irrigated fresh water ranged from 30.5 inches on Pivot 1 to 46.6 inches on Pivot 3 (Table 3). The annual total irrigated fresh water volume of 271.25 MG was less than the projected total of 370.48 MG (Table 3). Per Permit Special Condition S4.B.2.a. “Bypass Procedures”, Lamb Weston land applied 1.62 MG of process water during December 2020, and 1.49 MG during January 2021. The flows were spread across Pivot 1 and Pivot 2 with monthly totals ranging from 0.2 to 0.4 inches per month (Table 3). 2.3 Constituent Loadings Table 4 presents the annual loading results for net nitrogen, salts, and BOD5. Constituent loadings presented in Table 4 are based on the acreage weighted average water quality of the 2021 operating year presented in Table 2. Process water provided a range of 109 to 723 pounds available nitrogen per acre (lb N/ac, Table 4). The process water nitrogen load on Pivot 1 and Pivot 2 was higher than their projected loads of 378 and 379 lb N/ac, whereas actual process water nitrogen load for Pivot 3 was lower than the projected load of 380 lb N/ac (Cascade Earth Sciences, 2021). Nitrogen and sulfur fertilizer was only applied to Pivot 3 during the 2021 operational year (Table 4 and Appendix A). The source of fresh water is from the Columbia River, which is provided by the City of Richland and contributes no nitrogen. The process and fresh water contributed an acreage weighted average of 7,989 pounds (lb) of salts per acre across the Site (Table 4). The highest annual process water BOD5 load during the 2021 operating year was 15 lb/ac on Pivot 1 (a seasonal average of less than 0.1 lb/ac/day based on 275 primary irrigation days per year), which is below the 50 lb chemical oxygen demand per acre per day recommended by the Idaho Department of Environmental Quality (Idaho Department of Environmental Quality, 2007). Under the highly treated conditions of the process water at this Site, chemical oxygen demand and BOD5 concentrations are very low, and therefore, their loading rates are also low. Lamb Weston – Richland, WA 2022 Operating Year ICMP Doc: 2021210032 LWR 2022 ICMP.docx February 2022 | Page 2
2.4     Monitoring
The following section describes crop tissue, soil, and groundwater monitoring at the Site.

2.4.1 Crop Monitoring
Alfalfa was grown on Pivot 1 and Pivot 2 during the 2021 operating year (Table 5). Alfalfa yields
were 7.8 tons per acre (Pivot 2) and 9.3 tons per acre (Pivot 1). Wheat was grown on Pivot 3 during
the 2021 operating year, with harvests of both grain and straw. Crop nitrogen removals were
calculated from crop tissue sample analyses and crop yields (Table 5 and Appendix B). Alfalfa
tissue nitrogen content was 2.88% (Pivot 2) and 3.23% (Pivot 3). The crop tissue nitrogen content
acreage weighted average was 2.9%, which reflects the combined yields of all crops at the Site. A
total of 104,253 lb of nitrogen was removed by the crops.

During the 2021 operating year, the acreage weighted average nitrogen balance was 138 lb N/ac,
ranging from -1 lb N/ac for Pivot 3 to 200 lb N/ac for Pivot 2 (Table 6). The overall Site total
nitrogen removal of 104,253 lb (Table 5) was less than the Site total net nitrogen load of 139,080 lb
(Table 4).

2.4.2 Soil Hydraulic Budgets
Soil hydraulic budgets including net irrigation, evapotranspiration (ET), soil moisture content, and
estimated percolate volumes are shown in Appendix C and are summarized in Table 7. Soil
moisture content is measured by laboratory analysis of soil samples collected each spring and fall
from each field to provide data for both the irrigation scheduling program and the annual hydraulic
budgets. The measured values are used to calibrate the budgets and verify the soil moisture readings
from the moisture probes.

The ratio of percolate loss to gross water input is referred to as the leaching fraction. The leaching
requirement is the calculated leaching fraction required to remove soluble salts from the root zone
and maintain favorable soil salinity levels. According to the hydraulic budgets, percolate loss
occurred only on Pivot 3, the majority of which was associated with fresh water irrigation
(Appendix C). The leaching factor of 17.7% exceeded the 2.4% leaching requirement for Pivot 3.
The leaching requirements for each field were 9.1% (Pivot 1), 7.0% (Pivot 2), and 2.4% (Pivot 3;
Table 7).

2.4.3 Soil Moisture Monitoring
In September 2018, Lamb Weston initiated an irrigation management program called Valley
Scheduling™, which included the installation of soil moisture monitoring probes in 3 locations
(Figure 2). The location of each Valley Scheduling probe monitors the soil moisture content at each
of their respective locations. Lamb Weston uses Valley Scheduling to guide irrigation rates and
timing to meet crop water demands.

2.4.4 Soil Chemistry
Soil samples from each of the 9 monitoring locations (Figure 2) were collected March 2, 2021
(spring) and November 5, 2021 (fall) and analyzed for Permit required parameters (Tables 8 and 9).
The samples were collected in 1-foot increments to a depth of 5 feet.

Lamb Weston – Richland, WA                                                        2022 Operating Year ICMP
Doc: 2021210032 LWR 2022 ICMP.docx                                                  February 2022 | Page 3
The Oregon State University Extension Service has published a Soil Test Interpretation Guide
(Horneck, Sullivan, Owen, & Hart, 2011) that provides a consistent reference for evaluating soil
test results and guiding general fertility recommendations in Oregon and Washington. This
document was used to evaluate the soil test results.

Spring 2021 test results indicate that some soil nitrogen was available for crop growth on all fields.
The soil ammonium-nitrogen (NH4-N) ranged from 1.6 milligrams per kilogram (mg/kg) in the fifth
foot (48-60 inches below ground surface [bgs]) of Pivot 1 to 5.1 mg/kg in the first foot (0-12 inches
bgs) of Pivot 3 (Table 8). Soil nitrate-nitrogen (NO3-N) ranged from 2.0 to 4.1 mg/kg in the fifth
foot (48-60 inches bgs) across all fields, which is below the 15 mg/kg maximum limited by the
Permit (State of Washington Department of Ecology, 2017, p. 7).

Fall 2021 soil NH4-N ranged from 0.1 mg/kg in the fifth foot (48-60 inches bgs) of Pivot 1 to 2.2
mg/kg in the first foot (0-12 inches bgs) of Pivot 2 (Table 9). Soil NO3-N ranged from 2.1 to 4.2
mg/kg in the fifth foot (48-60 inches bgs) across all fields, which is below the 15 mg/kg maximum
limited by the Permit (State of Washington Department of Ecology, 2017, p. 7). The residual
nitrogen is available for crop uptake next spring.

Soil organic matter (OM) is important in soil chemical reactions and soil-water relations.
Maintaining or increasing soil OM is beneficial in sandy soils, such as at this Site. Soil OM levels
have been generally consistent at the Site since 1995. Soil OM in the first foot (0-12 inches bgs) of
soil across the Site ranged from 0.6 % to 1.0% in fall 2021 (Table 9). The soil OM levels are likely
at a relative equilibrium, being maintained by the primary rotation of perennial and annual forage
crops (alfalfa and grasses).

Phosphorus (31 to 109 mg/kg) and potassium (544 to 660 mg/kg) measured in the first foot (0-12
inches bgs) of soil during fall 2021 are at levels that do not require addition from commercial
fertilizers. Both plant available phosphorus and extractable potassium concentrations are at high to
excessive levels in all fields and fertilizers containing either constituent can be avoided.

Of the secondary nutrients, magnesium concentrations (1.6 to 2.3 meq/100g) are at moderate levels
across all fields. Sulfate-sulfur concentrations are moderate in Pivot 1 (12 mg/kg) and Pivot 2 (11
mg/kg), and high in Pivot 3 (118 mg/kg). Calcium concentrations are similar for all fields (3.3 to 5.0
milliequivalents per 100 grams of soil) and considered adequate.

Chloride levels in the first foot (0-12 inches bgs) of soil were low in Pivot 3 (8 mg/kg) and moderate
in Pivot 1 (15 mg/kg) and Pivot 2 (13 mg/kg). Soil chloride concentrations at the Site are not at
levels that would affect crop productivity.

Soluble salts (ECe) concentrations in the first foot (0-12 inches bgs) of soil are within acceptable
levels. Values between 1.0 and 2.5 millimhos per centimeter (mmhos/cm) are considered moderate.
During the fall of 2021, Pivot 1, Pivot 2, and Pivot 3 had ECe values in the first foot (0-12 inches
bgs) of soil of 0.7, 0.5, and 1.7 mmhos/cm, respectively. Since soluble salts by nature move with
water, ECe values can fluctuate rather quickly in response to variables such as irrigation water
quality and evaporation related to the elapsed time since the last irrigation or rainfall event. Alfalfa

Lamb Weston – Richland, WA                                                        2022 Operating Year ICMP
Doc: 2021210032 LWR 2022 ICMP.docx                                                  February 2022 | Page 4
is somewhat sensitive to soil salinity with yield decreases of 10% expected when ECe values reach
2.5 to 3.0 mmhos/cm, respectively (Bohn, McNeal, & O'Connor, 1979).

2.4.5 Groundwater Monitoring
Average groundwater quality data for the 2021 operating year is summarized in Table 10. Trends in
NO3-N and chloride are shown in Charts 1 through 3. Detailed information can be obtained from the
monthly DMRs. Monitoring well MW-1 can be considered hydraulically upgradient of the Site.
Monitoring wells MW-2 through MW-6 are considered downgradient of one or more fields
(Cascade Earth Sciences, 1992). Table 10 presents a summary of the groundwater monitoring data
required by the Permit.

Average groundwater NO3-N concentrations in all downgradient wells ranged from 14.9 mg/L in
MW-5 to 46.6 mg/L in MW-6, while upgradient well MW-1 was 4.3 mg/L (Table 10). The average
total dissolved solids concentrations in all downgradient wells ranged from 699 mg/L in MW-4 to
1,345 mg/L in MW-2 and was 317 mg/L in upgradient well MW-1. The average concentration of
potassium was 7 mg/L in upgradient MW-1 and downgradient well averages ranged from 12 mg/L
in MW-3 and MW-4 to 225 mg/L in MW-6. Average total phosphorous was 0.15 mg/L in
upgradient well MW-1 and downgradient well averages ranged from 0.07 mg/L in MW-3 to 3.51
mg/L in MW-6.

Chart 1 shows groundwater NO3-N and chloride concentrations by month since November 2000 for
MW-3 and MW-5 compared to MW-1. Chart 2 shows the same information for MW-2 and MW-4.
MW-6 is presented in Chart 3 along with the previous Site fresh water supply (Center Well) NO3-N
data.

Chloride concentrations decreased in the majority of downgradient wells when comparing
beginning and ending concentrations for the 2021 operating year as indicated in the charts.
Monitoring well MW-3 increased in chloride concentration (75 mg/L) during the 2021 operating
year.

Three anomalous data points were identified in the 2021 operating year NO3-N lab analyses: a value
of 2.3 mg/L in September for MW-2, a value of 122.0 mg/L in May for MW-4, and a value of 92.7
mg/L in May for MW-6. These 3 values were identified as laboratory errors based on information
received from KUO Testing in Othello, WA. These 3 anomalous data points were not used in the
annual average groundwater calculations (Table 10) or Charts 1 through 3.

Groundwater NO3-N concentrations increased 4 (MW-4) to 21 (MW-3) mg/L in the downgradient
wells when comparing beginning and ending concentrations for the 2021 operating year as shown in
the charts, except in MW-5 where it decreased 1 mg/L. Upgradient well MW-1 increased from 5.0
to 5.4 mg/L NO3-N when comparing beginning and ending concentrations for the 2021 operating
year.

2.5     Evaluation of System Performance
Process water hydraulic and nitrogen loadings were greater across the Site than projected for the
2021 operating year. Brief hydraulic loadings to the fields in December 2020 and January 2021

Lamb Weston – Richland, WA                                                      2022 Operating Year ICMP
Doc: 2021210032 LWR 2022 ICMP.docx                                                February 2022 | Page 5
were necessary to divert flow away from the Yakima River outfall to empty the treated process
water pipeline and allow unexpected pipeline repairs. Nitrogen loadings to the fields were greater
than expected due in part to higher than expected NO3-N concentrations in the process water during
a majority of the growing season. Higher NO3-N concentrations were caused from under
performance of the Carrousel Oxidation Ditch System (Carrousel) that is designed to promote
denitrification to remove nitrate-nitrogen (NO3-N). Lamb Weston is actively working to avoid these
issues in the future.

2.5.1 Crop Performance
Crop performance was not adequate to treat the 2021 operating year process water nitrogen
loadings. Process water loadings during the 2021 operating year resulted in a net positive nitrogen
balance across the Site. There was a net nitrogen load of 139,080 pounds compared to 104,253
pounds of nitrogen removed through crop harvest.

2.5.2 Hydraulic Performance
Process water hydraulic loadings resulted in a leaching fraction of 17.7% which is above the
leaching requirement of 2.4% for Pivot 3 during the 2021 operating year, the majority of which was
associated with fresh water irrigation. Calculated leaching in excess of the leaching requirement was
not observed for Pivot 1 and Pivot 2 during the 2021 operating year.

2.5.3 Groundwater Evaluation
Groundwater NO3-N increased in monitoring wells MW-2, MW-3, MW-4, and MW-6 during the
2021 operating year.

3.0     CROPPING AND IRRIGATION SCHEDULE FOR THE 2022 OPERATING
        YEAR
Upon Ecology approval, process wastewater will be applied to the land treatment system according
to the cropping and irrigation schedule for the 2022 operating year.

The Cropping and Irrigation Schedule for the 2022 operating year has been prepared for November
1, 2021, through October 31, 2022 to balance process and fresh water loadings with crop nitrogen
use and ET, and to control soil water percolate loss on each field.

3.1     Cropping
For the 2022 operating year, all fields will produce alfalfa and all of the fields will have an
established cover crop going into winter.

3.2     Process Water Flow and Irrigation Loadings
Gross process and fresh water distribution projections by month for each field are summarized in
Table 11. Actual process water flows for November 2021 are included. Fresh water irrigation
additions in March and April 2022 may be utilized to fill the soil profile prior to warmer
temperatures to minimize the degree of soil moisture depletion that typically occurs in July when

Lamb Weston – Richland, WA                                                         2022 Operating Year ICMP
Doc: 2021210032 LWR 2022 ICMP.docx                                                   February 2022 | Page 6
irrigation replenishment can be limited. Replenishment can be limited due to high crop water use, low soil water holding capacity, and lack of full time irrigation during crop harvesting. Total process water irrigation per month during the 2022 operating year ranges from 3.26 MG in November 2021 (actual) to 34.26 MG in July 2022 (Projected; Table 11) based on the projected crop ET and agronomic nitrogen capacity. Total projected process water irrigation for the 2022 operating year is 124.61 MG. Actual process water application will be determined by the actual process water quality and crop hydraulic and nitrogen capacity on a per-field basis. Process water may be used for irrigation during the months of March through November or discharged to river outfall #001 year round. The amount projected for irrigation to satisfy crop water demands is expected to be limited, with the majority of the process water scheduled to be discharged to river outfall #001. Process water may be applied in October to meet crop water demands without completely filling the soil profile. This practice will reserve a portion of the soil water holding capacity in anticipation of winter precipitation. Field-specific irrigation plans were developed within detailed soil hydraulic budgets (Tables 12-14). The soil hydraulic budgets account for precipitation, gross and net irrigation, potential and estimated ET, soil water content, soil water surplus, leaching requirement, crop nitrogen utilization, and gross nitrogen load. Actual irrigation will be managed by these criteria and adjusted appropriately throughout the year according to Valley Scheduling, which includes soil moisture monitoring probes. Crop cutting and drying cycles during the season will have an impact on scheduling so less fresh water will probably be used than projected. Valley Scheduling uses actual and projected precipitation and ET, and actual irrigation loadings and soil moisture content to forecast a 5-day irrigation schedule to meet the crop water demand and limit soil water percolate loss. The Valley Scheduling soil moisture probes measure soil moisture continuously and the soil moisture data is reviewed to direct irrigation scheduling to the most appropriate fields. Additionally, spring and fall soil samples are measured for soil water content and these values are used to calibrate the soil moisture estimates within soil hydraulic budgets. 3.3 Constituent Loadings Projected nitrogen, FDS, and BOD5 loading rates were calculated from monthly projected gross process water irrigation and the expected concentrations (Table 15). The concentrations are based on a 3-year average concentration of process water. Projected crop nitrogen removals are based on site-specific removal rates, typical removal rates expected for this area, or generally accepted agronomic application rates to meet crop needs. This proposed ICMP projects balanced nitrogen loadings on all fields during the 2022 operating year (Table 15). Lamb Weston – Richland, WA 2022 Operating Year ICMP Doc: 2021210032 LWR 2022 ICMP.docx February 2022 | Page 7
REFERENCES
Bohn, H. L., McNeal, B. L., & O'Connor, G. A. (1979). Soil chemistry. New York, NY: John Wiley
       and Sons.

Canessa, P., & Hermanson, R. E. (1994). Irrigation management practices to protect ground water
       and surface water quality state of Washington, (EM4885). WA: Washington State
       University Cooperative Extension and U.S. Department of Agriculture.

Cascade Earth Sciences. (1992). Monitoring well installations and initial sample results report -
      Lamb Weston, Inc. - Richland, Washington. Corbett, OR: Author.

Cascade Earth Sciences. (2021). 2021 operating year irrigation and crop management plan - Lamb
      Weston, Inc. - Richland, Washington. Spokane Valley, WA: Author.

Horneck, D. A., Sullivan, D. M., Owen, J. S., & Hart, J. M. (2011). Soil test interpretation guide.
      (EC 1478). Oregon State University Extension Service.

Idaho Department of Environmental Quality. (2007). Guidance for reclamation and reuse of
       municipal and industrial wastewater. ID: Idaho Department of Environmental Quality.

State of Washington Department of Ecology. (2017). National pollutant discharge elimination
        system waste discharge permit no. WA0052141. Union Gap, WA: Author.

Washington State University. (n.d.). Period of climate data - Richland, Washington, [Data file].
      Retrieved January 19, 2021, from AgWeatherNet: http://weather.wsu.edu

Lamb Weston – Richland, WA                                                       2022 Operating Year ICMP
Doc: 2021210032 LWR 2022 ICMP.docx                                                 February 2022 | Page 8
TABLES Table 1. Process Water Volume Summary Table 2. Irrigated Process Water Quality Summary Table 3. Monthly Summary of Irrigated Process and Fresh Water Table 4. Annual Constituent Loading Summary Table 5. Crop Yield and Nitrogen Removal Table 6. Nutrient Balances Table 7. Summary of Field-Specific Soil Hydraulic Budgets Table 8. Soil Analyses Results – Spring 2021 Table 9. Soil Analyses Results – Fall 2021 Table 10. Average Groundwater Monitoring Data Summary Table 11. Projected 2022 Operating Year Irrigation Water Distribution Table 12. Projected 2022 Operating Year Soil Hydraulic Budget – Pivot 1 Table 13. Projected 2022 Operating Year Soil Hydraulic Budget – Pivot 2 Table 14. Projected 2022 Operating Year Soil Hydraulic Budget – Pivot 3 Table 15. 2022 Operating Year Projection Summary
Table 1. Process Water Volume Summary

                                 Yakima River Outfall Discharge 1
                                                                                        Irrigated        Combined
                              Average           Daily
         Month                         2                     Total                       Total 4           Total
                              Monthly        Maximum 3
                               million gallons per day                              million gallons
        Nov-20                  2.28             2.89        68.53                         0.30             68.83
        Dec-20                  2.24             2.60        69.34                         1.62             70.96
        Jan-21                  2.27             2.60        70.30                         1.49             71.79
        Feb-21                  2.18             2.93        61.03                         0.00             61.03
        Mar-21                  2.10             2.73        64.95                         9.63             74.58
        Apr-21                  2.22             2.68        66.68                         5.02             71.70
       May-21                   1.79             2.53        55.45                        14.62             70.07
        Jun-21                  1.70             2.53        51.03                        19.39             70.42
        Jul-21                  1.29             2.61        39.98                        34.26             74.24
        Aug-21                  2.12             2.68        65.72                        10.20             75.92
        Sep-21                  2.00             2.52        60.08                        12.39             72.48
        Oct-21                  2.30             2.60        62.08                        15.84             77.92
         Total                    --              --        735.17                       124.75            859.92
     Permit Limit                3.0             4.02

 NOTES:
 Data is for the 2021 operating year of November 1, 2020, through October 31, 2021.
 Process water discharge volumes from the pretreatment system as reported to the State of Washington Department of
    Ecology in monthly discharge monitoring reports.
 1 Process water discharge to the Yakima River outfall is permitted year round (State of Washington Department
   of Ecology, 2017).
 2 Average monthly = average of daily discharges over a calendar month. Calculated as the sum of each daily discharge
    measured during a calendar month divided by the total number of days with discharge during that month.
 3 Maximum daily discharge measured during the calendar month.
 4 Per Section S4.B.2.a. “Bypass Procedures” of the permit, Lamb Weston land applied process water during
   December 2020, and January 2021 as necessary (State of Washington Department of Ecology, 2017).

Lamb Weston - Richland, WA                                                                    2022 Operating Year ICMP
CES Doc: 2021210032 LWR 2022 ICMP AS Tbls.xlsx | T1 PW Vol                                                February 2022
Table 2. Irrigated Process Water Quality Summary
Irrigated NO3 +
BOD5 NH4-N TKN Total N TDS FDS
Month PW Flow NO2-N
MG milligrams per liter
Nov-20 0.30 3.0 40.0 0.07Table 3. Monthly Summary of Irrigated Process and Fresh Water
Annual Projected
Field Acres Nov-20 Dec-20 Jan-21 Feb-21 Mar-21 Apr-21 May-21 Jun-21 Jul-21 Aug-21 Sep-21 Oct-21 1
Total Total
Irrigated Process Water (inches)
Pivot 1 101.9 0.0 0.4 0.3 0.0 1.1 1.8 3.7 1.9 7.6 2.3 2.8 3.0 25.0 10.8
Pivot 2 83.1 0.1 0.2 0.2 0.0 1.1 0.0 2.0 5.8 5.4 1.7 2.0 3.3 21.8 10.6
Pivot 3 67.0 0.0 0.0 0.0 0.0 2.4 0.0 0.0 0.5 0.6 0.0 0.0 0.0 3.5 10.0
Irrigated Fresh Water (inches)
Pivot 1 101.9 0.0 0.0 0.0 0.0 1.6 5.6 2.8 4.4 6.9 4.4 4.8 0.0 30.5 54.0
Pivot 2 83.1 0.0 0.0 0.0 0.0 2.4 7.1 3.7 6.0 8.6 9.0 8.4 0.0 45.3 54.0
Pivot 3 67.0 0.0 0.0 0.0 0.0 3.4 6.1 11.3 13.0 1.2 7.2 3.2 1.2 46.6 54.4
Irrigated Combined Water (inches)
Pivot 1 101.9 0.0 0.4 0.3 0.0 2.6 7.4 6.5 6.3 14.5 6.7 7.7 3.0 55.5 64.8
Pivot 2 83.1 0.1 0.2 0.2 0.0 3.5 7.1 5.7 11.8 14.1 10.6 10.4 3.3 67.1 64.6
Pivot 3 67.0 0.0 0.0 0.0 0.0 5.7 6.1 11.3 13.5 1.7 7.2 3.2 1.2 50.0 64.4
Irrigated Water (million gallons)
Process Water 0.30 1.62 1.49 0.00 9.63 5.02 14.62 19.39 34.26 10.20 12.39 15.84 124.75 71.92
Fresh Water 0.00 0.00 0.00 0.00 15.98 42.57 36.72 49.39 40.70 45.49 38.09 2.31 271.25 370.24
Total 0.30 1.62 1.49 0.00 25.61 47.59 51.33 68.78 74.96 55.69 50.48 18.15 396.00 442.16
NOTES:
Data is for the 2021 operating year of November 1, 2020, through October 31, 2021.
Sum of individual field loadings from daily field records compiled by Lamb Weston Richland.
1 Projected total from the 2021 Operating Year Irrigation and Crop Management Plan (Cascade Earth Sciences, 2021).
Lamb Weston - Richland, WA 2022 Operating Year ICMP
CES Doc: 2021210032 LWR 2022 ICMP AS Tbls.xlsx | T3 Irrig Sum February 2022Table 4. Annual Constituent Loading Summary
Net Nitrogen 1 Salts 2 BOD5
Field Acres PW FW Fertilizer Total Projected 3 PW FW Total Projected 3 Fertilizer PW Projected 3
pounds per acre pounds pounds per acre pounds per acre pounds per acre
Pivot 1 101.9 723 0 0 73,628 723 378 9,194 992 10,186 4,287 0 15 24
Pivot 2 83.1 603 0 0 50,123 603 379 8,019 1,472 9,491 4,232 0 13 23
Pivot 3 67.0 109 0 120 15,330 229 380 1,270 1,515 2,784 4,061 60 2 22
Total 252.0 139,080
Acreage Weighted
520 0 32 552 379 6,700 1,289 7,989 4,209 16 11 23
Average 4
NOTES:
Data is for the 2021 operating year of November 1, 2020, through October 31, 2021. Constituent loadings for each field are based on flow and water quality.
Abbreviations: BOD5 = five-day biochemical oxygen demand, FW = fresh water, PW = process water.
1 Assumes 70% of organic nitrogen (total Kjeldahl nitrogen minus ammonia-nitrogen) is available, 50% ammonia-nitrogen is volatilized, and 100% nitrate-nitrogen is available.
2 The PW salts is calculated with flow weighted fixed dissolved solids. The FW salts is calculated with a total dissolved solids of 143.3 milligrams per liter.
FW sample collected by the City of Richland and analyzed on July 12, 2021 by Anateck Labs in Spokane, Washington.
3 Projected total from the 2021 Operating Year Irrigation and Crop Management Plan (Cascade Earth Sciences, 2021).
4 Acreage weighted average = sum (field-specific acres × field-specific parameter) ÷ 252 total acres.
Lamb Weston - Richland, WA 2022 Operating Year ICMP
CES Doc: 2021210032 LWR 2022 ICMP AS Tbls.xlsx | T4 Load February 2022Table 5. Crop Yield and Nitrogen Removal
Crop
Number Crop Dry Matter Crop Tissue
Nitrogen
Field Acres Crop of Yield 1 Removed 2 Nitrogen 3
Removed 4
Cuttings
tons ton/ac tons ton/ac % pounds
Pivot 1 101.9 Alfalfa 4 951 9.3 856 8.4 3.23 55,328
Pivot 2 83.1 Alfalfa 4 646 7.8 581 7.0 2.88 33,522
Pivot 3 67.0 Wheat 2 403 6.0 362 5.4 2.12 15,402
Total 252.0 1,800 104,253
Weighted Average 5 7.9 7.1 2.90
NOTES:
Data is for the 2021 operating year of November 1, 2020, through October 31, 2021.
Abbreviations: ton/ac = tons per acre.
1 Weight of the crop as removed from the field.
2 Crop yield adjusted by 10% to account for the crop moisture content.
3 Crop tissue nitrogen concentration is yield weighted by field = sum (cutting-specific tons × cutting-specific field parameter) ÷ field-specific
total tons. Analyses by Kuo Testing Labs, Inc. in Othello, Washington.
4 Crop nitrogen removed = pounds of dry matter removed multiplied by the percent of crop tissue nitrogen.
5 Average crop yield and dry matter removed are acreage weighted = sum (field-specific acres × field-specific parameter) ÷ 252 total acres.
Average crop tissue nitrogen is yield weighted = sum (field-specific tons × field-specific parameter) ÷ 1800 total tons.
Lamb Weston - Richland, WA 2022 Operating Year ICMP
CES Doc: 2021210032 LWR 2022 ICMP AS Tbls.xlsx | T5 Crops February 2022Table 6. Nutrient Balances
Nitrogen Salts
Net Crop Crop
Field Acres Crop 1 Balance 4 Load 5 Balance 7
Load 2 Removal 3 Removal 6
pounds per acre
Pivot 1 101.9 Alfalfa 723 543 180 10,186 1,955 8,231
Pivot 2 83.1 Alfalfa 603 403 200 9,491 1,709 7,782
Pivot 3 67.0 Wheat 229 230 -1 2,844 1,251 1,593
Total 252.0
Acreage Weighted Average 8 552 414 138 8,005 1,687 6,318
NOTES:
Data is for the 2021 operating year of November 1, 2020, through October 31, 2021.
Annual nitrogen loadings calculated from monthly specific constituent concentrations and monthly specific water loadings.
1 Current crop or rotation showing crops grown or planted during the growing season.
2 Net load = sum of process water and fertilizer loadings minus gaseous losses.
3 Crop nitrogen removal calculated from crop dry matter and crop tissue nitrogen concentration.
4 Nitrogen balance = net load minus crop removal. Negative = more removed than applied. Positive = less removed than applied.
5 Load = sum of process water, fresh water, and fertilizer loadings.
6 Ash (salts) content are yield-weighted mean results from crop tissue testing. Crop salt removal calculated from ash content and dry matter harvested.
7 Salts balance = total load minus removal.
8 Acreage weighted average = sum (field-specific acres × field-specific parameter) ÷ 252 total acres.
Lamb Weston - Richland, WA 2022 Operating Year ICMP
CES Doc: 2021210032 LWR 2022 ICMP AS Tbls.xlsx | T6 Bal February 2022Table 7. Summary of Field-Specific Soil Hydraulic Budgets
3
Net Irrigation 4 7
Leaching Projected
Gross Gross Irrigation Total Projected Evapotranspiration
Leaching
Field Acres Crop 1 Precip 2 PW FW PW FW Input 5
Input 6
Potential Estimated Fraction 8 Req'mt 9 Fraction 10
inches percent
Pivot 1 101.9 Alfalfa 5.4 25.0 30.5 19.3 23.0 47.0 54.0 67.6 46.2 0.0 9.1 0.0
Pivot 2 83.1 Alfalfa 5.4 21.8 45.3 16.7 34.1 55.5 53.9 67.6 53.9 0.0 7.0 0.0
Pivot 3 67.0 Wheat 5.4 3.5 46.6 2.9 35.6 43.2 53.6 37.4 33.4 17.7 2.4 0.0
NOTES:
Data is for the 2021 operating year of November 1, 2020, through October 31, 2021.
Abbreviations: FW = fresh water, Precip = precipitation, PW = process water, Req'mt = requirement.
1 Current crop or rotation showing crops grown or planted during the growing season.
2 Gross precipitation data from the Washington State University AgWeatherNet Richland, Washington weather station (Washington State University, n.d.).
3 Gross irrigation = inches of process water and fresh water delivered at irrigation system discharge point (i.e., sprinkler heads).
4 Net irrigation = gross irrigation × irrigation efficiency (assumes: 90% for November through March and October; 80% for April, May, and September; and 70% for June through August).
5 Total input = net process water + net fresh water + net precipitation (assumes: 90% for November through March and October; 80% for April, May, and September;
and 70% for June through August).
6 Projected total is for the 2021 operating year of November 2020 through October 2021 from the 2021 Operating Year Irrigation and Crop Management Plan (Cascade Earth Sciences, 2021).
Actual values vary from projected values due to actual site conditions.
7 Potential evapotranspiration (ET) obtained from the Washington State University AgWeatherNet Richland, Washington weather station (Washington State University, n.d.).
Estimated ET calculated from potential ET and soil moisture content. Estimated ET calculated from potential ET and soil moisture content.
8 Leaching fraction = percent of gross input estimated to percolate beyond root zone (total percolate loss ÷ [precipitation + gross irrigation]).
9 Leaching requirement = percolate loss as a percentage of gross input required to manage soil salts to levels that do not impede crop productivity.
10 Projected leaching fractions are for the 2021 operational year of November 2020, through October 2021 from the 2021 Operating Year Irrigation and Crop Management Plan
(Cascade Earth Sciences, 2021). Actual values vary from projected values due to actual site conditions.
Lamb Weston - Richland, WA 2022 Operating Year ICMP
CES Doc: 2021210032 LWR 2022 ICMP AS Tbls.xlsx | T7 WB Sum February 2022Table 8. Soil Analyses Results - Spring 2021
Sample Soil Water
ECe NH4-N NO3-N
Field 1 Depth Content
inches bgs % wt. mmhos/cm mg/kg
Pivot 1 0-12 6.05 0.5 3.0 1.7
12-24 5.87 0.7 2.0 1.6
24-36 7.09 0.9 2.0 2.8
36-48 7.30 1.0 1.8 3.6
48-60 6.60 1.1 1.6 4.1
Pivot 2 0-12 5.50 0.6 3.0 2.0
12-24 7.78 0.9 2.4 3.9
24-36 5.79 0.9 2.0 5.9
36-48 5.61 0.9 2.1 5.5
48-60 5.46 0.9 1.8 3.1
Pivot 3 0-12 7.73 1.5 5.1 5.1
12-24 7.27 1.1 3.0 4.3
24-36 7.09 1.3 2.9 5.1
36-48 7.01 1.2 1.9 2.3
48-60 6.61 1.1 2.0 2.0
NOTES:
Samples collected by Cascade Earth Sciences on March 2, 2021. Analyses performed by Kuo Testing Labs, Inc. in
Othello, Washington using Washington State University Soil Testing Methods or appropriate equivalent methods.
Abbreviations: % wt. = percent weight, bgs = below ground surface, ECe = electrical conductivity
by saturation paste extract, mg/kg = milligrams per kilogram, mmhos/cm = millimhos per centimeter,
NH4-N = ammonium-nitrogen, NO3-N = nitrate-nitrogen.
1 Soil sampling locations are consistent monitoring points in each field.
Lamb Weston - Richland, WA 2022 Operating Year ICMP
CES Doc: 2021210032 LWR 2022 ICMP AS Tbls.xlsx | T8 Spring Soil February 2022Table 9. Soil Analyses Results - Fall 2021
Sample Soil Water Bases (Cations)
pH ECe OM NH4-N NO3-N SO4-S P Cl ESP
Field 1 Depth Content K Ca Mg Na
inches % wt. s.u. mmhos/cm % mg/kg meq/100g %
Pivot 1 0-12 9.12 8.5 0.7 0.6 2.0 5.7 12 31 15 615 5.0 1.6 0.18 3.2%
12-24 7.79 -- 0.7 -- 0.5 3.7 -- -- -- -- -- -- -- --
24-36 5.98 -- 1.1 -- 0.2 4.4 -- -- -- -- -- -- -- --
36-48 6.54 -- 1.2 -- 0.6 4.3 -- -- -- -- -- -- -- --
48-60 6.14 -- 1.0 -- 0.1 4.1 -- -- -- -- -- -- -- --
Pivot 2 0-12 10.09 8.3 0.5 0.8 2.2 8.2 11 46 13 541 3.3 1.6 0.17 2.9%
12-24 7.52 -- 0.5 -- 1.1 3.4 -- -- -- -- -- -- -- --
24-36 7.92 -- 0.4 -- 0.6 2.2 -- -- -- -- -- -- -- --
36-48 7.62 -- 0.5 -- 0.7 1.4 -- -- -- -- -- -- -- --
48-60 6.34 -- 0.6 -- 0.4 2.1 -- -- -- -- -- -- -- --
Pivot 3 0-12 10.01 7.8 1.7 1.0 1.5 3.2 118 109 8 660 3.4 2.3 0.23 3.0%
12-24 6.06 -- 1.2 -- 0.4 8.0 -- -- -- -- -- -- -- --
24-36 6.00 -- 1.2 -- 0.9 4.9 -- -- -- -- -- -- -- --
36-48 5.06 -- 0.8 -- 0.8 4.5 -- -- -- -- -- -- -- --
48-60 5.19 -- 0.5 -- 0.4 4.2 -- -- -- -- -- -- -- --
NOTES:
Samples were collected by Cascade Earth Sciences on November 5, 2021. Analyses was performed by Kuo Testing Labs, Inc. in Othello, Washington using
Washington State University Soil Testing Methods or appropriate equivalent methods.
Abbreviations: % wt. = percent weight, -- = not required by permit, Ca = calcium, Cl = chloride, ECe = electrical conductivity by saturation paste extract,
ESP = exchangeable sodium percentage, K = potassium, meq/100g = milliequivalents per 100 grams of soil, mmhos/cm = millimhos per centimeter,
Mg = magnesium, mg/kg = milligrams per kilogram, Na = sodium, NH4-N = ammonium-nitrogen, NO3-N = nitrate-nitrogen, OM = organic matter,
P = available phosphorus, s.u. = standard units, SO4-S = sulfate-sulfur.
1 Soil sampling locations are consistent monitoring points in each field.
Lamb Weston - Richland, WA 2022 Operating Year ICMP
CES Doc: 2021210032 LWR 2022 ICMP AS Tbls.xlsx | T9 Fall Soil February 2022Table 10. Average Groundwater Monitoring Data Summary
Total Total HCO3 Ferrous
Elevation pH Temp Cond DO TKN NH3-N NO3-N Cl TDS FDS Ca Mg Na K SO4 Mn TOC CO3 F
1 P Fe Alk Iron
Well
µmhos/ present/a
ft amsl s.u. °C milligrams per liter
cm bsent
MW-1 370.48 7.27 17.1 418 6.5 0.5Table 11. Projected 2022 Operating Year Irrigation Water Distribution
Pivot 1 Pivot 2 Pivot 3
Total
Month 101.9 acres 83.1 acres 67.0 acres
Million Gallons Inches
Process Water Irrigation
Nov-21 3.26 0.6 0.4 0.4
Dec-21 0.00 0.0 0.0 0.0
Jan-22 0.00 0.0 0.0 0.0
Feb-22 0.00 0.0 0.0 0.0
Mar-22 9.63 1.4 1.4 1.4
Apr-22 5.02 0.7 0.7 0.7
May-22 14.62 2.1 2.1 2.1
Jun-22 19.39 2.8 2.8 2.8
Jul-22 34.26 5.0 5.0 5.0
Aug-22 10.20 1.5 1.5 1.5
Sep-22 12.39 1.8 1.8 1.8
Oct-22 15.84 2.3 2.3 2.3
Annual Total 124.61 18.3 18.1 18.1
Fresh Columbia River Water Irrigation
Nov-21 0.00 0.0 0.0 0.0
Dec-21 0.00 0.0 0.0 0.0
Jan-22 0.00 0.0 0.0 0.0
Feb-22 0.00 0.0 0.0 0.0
Mar-22 23.73 4.0 4.0 2.0
Apr-22 39.24 6.0 6.0 5.0
May-22 42.44 6.5 6.0 6.0
Jun-22 66.61 10.0 10.0 9.0
Jul-22 61.59 9.0 9.0 9.0
Aug-22 53.36 7.0 7.0 10.0
Sep-22 33.30 5.0 5.0 4.5
Oct-22 5.93 1.0 1.0 0.5
Annual Total 326.20 48.5 48.0 46.0
Combined Water Irrigation
Nov-21 3.26 0.6 0.4 0.4
Dec-21 0.00 0.0 0.0 0.0
Jan-22 0.00 0.0 0.0 0.0
Feb-22 0.00 0.0 0.0 0.0
Mar-22 33.36 5.4 5.4 3.4
Apr-22 44.25 6.7 6.7 5.7
May-22 57.06 8.6 8.1 8.1
Jun-22 86.00 12.8 12.8 11.8
Jul-22 95.84 14.0 14.0 14.0
Aug-22 63.56 8.5 8.5 11.5
Sep-22 45.70 6.8 6.8 6.3
Oct-22 21.78 3.3 3.3 2.8
Combined Total 450.81 66.8 66.1 64.1
NOTES:
Based on Lamb Weston Richland's previous operating year process water flows and monthly water balances.
Actual values shown for November 2021.
Lamb Weston - Richland, WA 2022 Operating Year ICMP
CES Doc: 2021210032 LWR 2022 ICMP Crop Sch Tbls.xlsx | T11 Irrig February 2022Table 12. Projected 2022 Operating Year Soil Hydraulic Budget - Pivot 1
Field: Pivot 1 Acres: 101.9 N Removal 2: 400 Soil Water Holding Capacity 3: 9.8
1 4
Crop: Alfalfa Rooting Depth : 60 Initial Soil Water Content : 6.4
6
5 Gross Irrigation Net Irrigation 7 Total Net Evapotranspiration 9 Soil Water
Month Precipitation 8
Process Fresh Process Fresh Input Potential Estimate Content 10 Surplus 11
Nov-21 0.7 0.6 0.0 0.6 0.0 1.2 1.4 1.1 6.5 0.0
Dec-21 1.0 0.0 0.0 0.0 0.0 0.9 0.8 0.6 6.8 0.0
Jan-22 0.8 0.0 0.0 0.0 0.0 0.7 0.9 0.7 6.8 0.0
Feb-22 0.6 0.0 0.0 0.0 0.0 0.5 1.6 1.3 6.0 0.0
Mar-22 0.5 1.4 4.0 1.3 3.6 5.3 3.4 2.7 8.6 0.0
Apr-22 0.4 0.7 6.0 0.6 4.8 5.7 5.5 5.1 9.2 0.0
May-22 0.5 2.1 6.5 1.7 5.2 7.3 7.6 7.4 9.2 0.0
Jun-22 0.4 2.8 10.0 2.0 7.0 9.3 9.4 9.1 9.4 0.0
Jul-22 0.2 5.0 9.0 3.5 6.3 9.9 10.8 10.5 8.8 0.0
Aug-22 0.1 1.5 7.0 1.0 4.9 6.0 8.7 8.2 6.6 0.0
Sep-22 0.2 1.8 5.0 1.4 4.0 5.6 5.4 4.5 7.8 0.0
Oct-22 0.4 2.3 1.0 2.1 0.9 3.4 3.0 2.7 8.5 0.0
Inches 5.9 18.3 48.5 14.2 36.7 55.9 58.3 53.9 -- 0.0
MG 16.2 50.8 134.2 39.2 101.5 154.7 161.3 149.1 -- 0.0
Net Nitrogen Load (lb) 12
14
38,091 Net Nitrogen Load (lb/ac) 374 Leaching Fraction 0.0%
Nitrogen Capacity (lb) 13
15
40,760 Leaching Requirement 6.0%
NOTES:
All values in inches unless otherwise noted. Actual irrigation shown for November through January.
Abbreviations: lb = pound, lb/ac = pounds per acre, MG = million gallons, N = nitrogen.
1 Depth of root penetration expected and depth of soil profile used to manage nutrients and water. Depends on crop type.
2 Projected nitrogen removal (lb/ac) based on previously measured site performance.
3 Soil water holding capacity is a function of soil type and crop rooting depth.
4 Inches of water in soil profile rooting zone as of approximately November 1, 2021 based on fall soil tests.
5 Precipitation represents average monthly values since 1995 from the Washington State University AgWeatherNet Richland, Washington weather station (Washington State University, n.d.).
6 Projected gross irrigation water delivery to the sprinkler head.
7 Net irrigation = gross irrigation × irrigation efficiency (90% for November through March and October; 80% for April, May, and September; and 70% for June through August).
8 Total net input = net irrigation + precipitation × efficiency (90% for November through March and October; 80% for April, May, and September; and 70% for June through August).
9 Potential evapotranspiration (ET) represents average monthly values since 1995 from the Washington State University AgWeatherNet Richland, Washington weather station
(Washington State University, n.d.). Estimate = potential ET × square root of (previous month's soil water content ÷ soil water holding capacity).
10 Soil water content = previous month's soil water content + total water input - ET estimate (cannot exceed soil water holding capacity).
11 Surplus: calculated soil water in excess of the soil water holding capacity that is estimated to percolate beyond the root zone.
Surplus = previous month's soil water content + total net input - ET estimate - current month's soil water content.
12 Net nitrogen load projected from anticipated average monthly process water nitrogen (100% nitrate-nitrogen and 70% total Kjeldahl nitrogen) and gross irrigation projections.
13 Nitrogen capacity for the entire field = acres × projected nitrogen removal.
14 Leaching fraction = % of gross water input estimated to percolate beyond root zone = surplus ÷ (precipitation + gross irrigation).
15 Leaching requirement is the percentage of surplus required to move beyond the root zone to manage soil salts to levels that do not impede crop productivity (Canessa, P., & Hermanson, R. E.,1994).
Leaching Requirement = ECiw / ECdw. Where: ECiw = irrigation electrical conductivity, and ECdw = 5 × desired electrical conductivity of saturated extract (2.0 millimhos per centimeter) - ECiw.
Lamb Weston - Richland, WA 2022 Operating Year ICMP
CES Doc: 2021210032 LWR 2022 ICMP Crop Sch Tbls.xlsx | T12 Pivot 1 February 2022Table 13. Projected 2022 Operating Year Soil Hydraulic Budget - Pivot 2
Field: Pivot 2 Acres: 83.1 N Removal 2: 400 Soil Water Holding Capacity 3: 9.8
1 4
Crop: Alfalfa Rooting Depth : 60 Initial Soil Water Content : 7.2
6
5 Gross Irrigation Net Irrigation 7 Total Net Evapotranspiration 9 Soil Water
Month Precipitation 8
Process Fresh Process Fresh Input Potential Estimate Content 10 Surplus 11
Nov-21 0.7 0.4 0.0 0.3 0.0 0.9 1.4 1.2 6.9 0.0
Dec-21 1.0 0.0 0.0 0.0 0.0 0.9 0.8 0.6 7.2 0.0
Jan-22 0.8 0.0 0.0 0.0 0.0 0.7 0.9 0.7 7.2 0.0
Feb-22 0.6 0.0 0.0 0.0 0.0 0.5 1.6 1.3 6.4 0.0
Mar-22 0.5 1.4 4.0 1.3 3.6 5.3 3.4 2.8 8.9 0.0
Apr-22 0.4 0.7 6.0 0.6 4.8 5.7 5.5 5.2 9.4 0.0
May-22 0.5 2.1 6.0 1.7 4.8 6.9 7.6 7.5 8.9 0.0
Jun-22 0.4 2.8 10.0 2.0 7.0 9.3 9.4 9.0 9.2 0.0
Jul-22 0.2 5.0 9.0 3.5 6.3 9.9 10.8 10.4 8.7 0.0
Aug-22 0.1 1.5 7.0 1.0 4.9 6.0 8.7 8.2 6.6 0.0
Sep-22 0.2 1.8 5.0 1.4 4.0 5.6 5.4 4.5 7.7 0.0
Oct-22 0.4 2.3 1.0 2.1 0.9 3.4 3.0 2.7 8.4 0.0
Inches 5.9 18.1 48.0 14.0 36.3 55.3 58.3 54.0 -- 0.0
MG 13.2 40.9 108.3 31.5 81.9 124.7 131.6 121.8 -- 0.0
Net Nitrogen Load (lb) 12
15
30,879 Net Nitrogen Load (lb/ac) 372 Leaching Fraction 0.0%
Nitrogen Capacity (lb) 13
16
33,240 Leaching Requirement 6.0%
NOTES:
All values in inches unless otherwise noted. Actual irrigation shown for November through January.
Abbreviations: lb = pound, lb/ac = pounds per acre, MG = million gallons, N = nitrogen.
1 Depth of root penetration expected and depth of soil profile used to manage nutrients and water. Depends on crop type.
2 Projected nitrogen removal (lb/ac) based on previously measured site performance.
3 Soil water holding capacity is a function of soil type and crop rooting depth.
4 Inches of water in soil profile rooting zone as of approximately November 1, 2021 based on fall soil tests.
5 Precipitation represents average monthly values since 1995 from the Washington State University AgWeatherNet Richland, Washington weather station (Washington State University, n.d.).
6 Projected gross irrigation water delivery to the sprinkler head.
7 Net irrigation = gross irrigation × irrigation efficiency (90% for November through March and October; 80% for April, May, and September; and 70% for June through August).
8 Total net input = net irrigation + precipitation × efficiency (90% for November through March and October; 80% for April, May, and September; and 70% for June through August).
9 Potential evapotranspiration (ET) represents average monthly values since 1995 from the Washington State University AgWeatherNet Richland, Washington weather station
(Washington State University, n.d.). Estimate = potential ET × square root of (previous month's soil water content ÷ soil water holding capacity).
10 Soil water content = previous month's soil water content + total water input - ET estimate (cannot exceed soil water holding capacity).
11 Surplus: calculated soil water in excess of the soil water holding capacity that is estimated to percolate beyond the root zone.
Surplus = previous month's soil water content + total net input - ET estimate - current month's soil water content.
12 Net nitrogen load projected from anticipated average monthly process water nitrogen (100% nitrate-nitrogen and 70% total Kjeldahl nitrogen) and gross irrigation projections.
13 Nitrogen capacity for the entire field = acres × projected nitrogen removal.
14 Leaching fraction = % of gross water input estimated to percolate beyond root zone = surplus ÷ (precipitation + gross irrigation).
15 Leaching requirement is the percentage of surplus required to move beyond the root zone to manage soil salts to levels that do not impede crop productivity (Canessa, P., & Hermanson, R. E.,1994).
Leaching Requirement = ECiw / ECdw. Where: ECiw = irrigation electrical conductivity, and ECdw = 5 × desired electrical conductivity of saturated extract (2.0 millimhos per centimeter) - ECiw.
Lamb Weston - Richland, WA 2022 Operating Year ICMP
CES Doc: 2021210032 LWR 2022 ICMP Crop Sch Tbls.xlsx | T13 Pivot 2 February 2022Table 14. Projected 2022 Operating Year Soil Hydraulic Budget - Pivot 3
Field: Pivot 3 Acres: 67 N Removal 2: 400 Soil Water Holding Capacity 3: 3.7
1 4
Crop: Alfalfa Rooting Depth : 60 Initial Soil Water Content : 3.7
6
5 Gross Irrigation Net Irrigation 7 Total Net Evapotranspiration 9 Soil Water
Month Precipitation 8
Process Fresh Process Fresh Input Potential Estimate Content 10 Surplus 11
Nov-21 0.7 0.4 0.0 0.4 0.0 1.0 1.4 1.4 3.3 0.0
Dec-21 1.0 0.0 0.0 0.0 0.0 0.9 0.8 0.7 3.4 0.0
Jan-22 0.8 0.0 0.0 0.0 0.0 0.7 0.9 0.8 3.3 0.0
Feb-22 0.6 0.0 0.0 0.0 0.0 0.5 1.6 1.5 2.4 0.0
Mar-22 0.5 1.4 2.0 1.3 1.8 3.5 3.4 2.7 3.1 0.0
Apr-22 0.4 0.7 5.0 0.6 4.0 4.9 5.5 5.0 3.0 0.0
May-22 0.5 2.1 6.0 1.7 4.8 6.9 7.6 6.9 3.0 0.0
Jun-22 0.4 2.8 9.0 2.0 6.3 8.6 9.4 8.5 3.1 0.0
Jul-22 0.2 5.0 9.0 3.5 6.3 9.9 10.8 9.9 3.1 0.0
Aug-22 0.1 1.5 10.0 1.0 7.0 8.1 8.7 8.0 3.3 0.0
Sep-22 0.2 1.8 4.5 1.4 3.6 5.2 5.4 5.1 3.4 0.0
Oct-22 0.4 2.3 0.5 2.1 0.5 2.9 3.0 2.9 3.4 0.0
Inches 5.9 18.1 46.0 14.0 34.3 53.2 58.3 53.5 -- 0.0
MG 10.7 33.0 83.7 25.4 62.3 96.9 106.1 97.3 -- 0.0
Net Nitrogen Load (lb) 12
15
24,912 Net Nitrogen Load (lb/ac) 372 Leaching Fraction 0.0%
Nitrogen Capacity (lb) 13
16
26,800 Leaching Requirement 6.1%
NOTES:
All values in inches unless otherwise noted. Actual irrigation shown for November through January.
Abbreviations: lb = pound, lb/ac = pounds per acre, MG = million gallons, N = nitrogen.
1 Depth of root penetration expected and depth of soil profile used to manage nutrients and water. Depends on crop type.
2 Projected nitrogen removal (lb/ac) based on previously measured site performance.
3 Soil water holding capacity is a function of soil type and crop rooting depth.
4 Inches of water in soil profile rooting zone as of approximately November 1, 2021 based on fall soil tests.
5 Precipitation represents average monthly values since 1995 from the Washington State University AgWeatherNet Richland, Washington weather station (Washington State University, n.d.).
6 Projected gross irrigation water delivery to the sprinkler head.
7 Net irrigation = gross irrigation × irrigation efficiency (90% for November through March and October; 80% for April, May, and September; and 70% for June through August).
8 Total net input = net irrigation + precipitation × efficiency (90% for November through March and October; 80% for April, May, and September; and 70% for June through August).
9 Potential evapotranspiration (ET) represents average monthly values since 1995 from the Washington State University AgWeatherNet Richland, Washington weather station
(Washington State University, n.d.). Estimate = potential ET × square root of (previous month's soil water content ÷ soil water holding capacity).
10 Soil water content = previous month's soil water content + total water input - ET estimate (cannot exceed soil water holding capacity).
11 Surplus: calculated soil water in excess of the soil water holding capacity that is estimated to percolate beyond the root zone.
Surplus = previous month's soil water content + total net input - ET estimate - current month's soil water content.
12 Net nitrogen load projected from anticipated average monthly process water nitrogen (100% nitrate-nitrogen and 70% total Kjeldahl nitrogen) and gross irrigation projections.
13 Nitrogen capacity for the entire field = acres × projected nitrogen removal.
14 Leaching fraction = % of gross water input estimated to percolate beyond root zone = surplus ÷ (precipitation + gross irrigation).
15 Leaching requirement is the percentage of surplus required to move beyond the root zone to manage soil salts to levels that do not impede crop productivity (Canessa, P., & Hermanson, R. E.,1994).
Leaching Requirement = ECiw / ECdw. Where: ECiw = irrigation electrical conductivity, and ECdw = 5 × desired electrical conductivity of saturated extract (2.0 millimhos per centimeter) - ECiw.
Lamb Weston - Richland, WA 2022 Operating Year ICMP
CES Doc: 2021210032 LWR 2022 ICMP Crop Sch Tbls.xlsx | T14 Pivot 3 February 2022You can also read