A blood atlas of COVID-19 defines hallmarks of disease severity and specificity
←
→
Page content transcription
If your browser does not render page correctly, please read the page content below
Resource

A blood atlas of COVID-19 defines hallmarks of
disease severity and specificity
Graphical abstract                                                   Authors
                                                                     COvid-19 Multi-omics Blood ATlas
                                                                     (COMBAT) Consortium

                                                                     Correspondence
                                                                     julian.knight@well.ox.ac.uk

                                                                     In brief
                                                                     A multi-omic analysis of patient blood
                                                                     samples reveals both similarities and
                                                                     specific features of COVID-19 when
                                                                     compared with samples obtained from
                                                                     sepsis or influenza patients, which could
                                                                     yield better targeted therapies for severe
                                                                     COVID-19.

Highlights
d   Blood atlas delineating innate and adaptive immune
    dysregulation in COVID-19

d   Shared and specific immune signatures of COVID-19,
    influenza and all cause sepsis

d   Multi-omic immune profiling differentiates hospitalized
    patient severity in COVID-19

d   Immune activation and proliferation involving AP-1/
    p38MAPK associated with COVID-19

           COvid-19 Multi-omics Blood ATlas (COMBAT) Consortium, 2022, Cell 185,
           916–938
           March 3, 2022 ª 2022 The Author. Published by Elsevier Inc.
           https://doi.org/10.1016/j.cell.2022.01.012                                                ll
ll
     OPEN ACCESS

Resource
A blood atlas of COVID-19 defines hallmarks
of disease severity and specificity
COvid-19 Multi-omics Blood ATlas (COMBAT) Consortium1,2,*
1Further  details can be found in the supplemental information
2Lead  contact (Julian C. Knight)
*Correspondence: julian.knight@well.ox.ac.uk
 https://doi.org/10.1016/j.cell.2022.01.012

SUMMARY

Treatment of severe COVID-19 is currently limited by clinical heterogeneity and incomplete description of
specific immune biomarkers. We present here a comprehensive multi-omic blood atlas for patients with vary-
ing COVID-19 severity in an integrated comparison with influenza and sepsis patients versus healthy volun-
teers. We identify immune signatures and correlates of host response. Hallmarks of disease severity involved
cells, their inflammatory mediators and networks, including progenitor cells and specific myeloid and
lymphocyte subsets, features of the immune repertoire, acute phase response, metabolism, and coagulation.
Persisting immune activation involving AP-1/p38MAPK was a specific feature of COVID-19. The plasma pro-
teome enabled sub-phenotyping into patient clusters, predictive of severity and outcome. Systems-based
integrative analyses including tensor and matrix decomposition of all modalities revealed feature groupings
linked with severity and specificity compared to influenza and sepsis. Our approach and blood atlas will sup-
port future drug development, clinical trial design, and personalized medicine approaches for COVID-19.

INTRODUCTION                                                          2020). Features of cytokine hyperactivation and lymphocyte
                                                                      exhaustion are proposed as shared mechanisms of severe
The pathophysiology associated with severe acute respiratory          COVID-19 with sepsis (Arunachalam et al., 2020; Boomer
syndrome coronavirus 2 (SARS-CoV-2) reflects a complex inter-         et al., 2012; Diao et al., 2020). Here, we demonstrate the informa-
play between virus-induced lung pathology and maladaptive             tiveness of a multi-modal, integrative systems biology approach
host immune responses (Kuri-Cervantes et al., 2020; Mathew            through the COvid-19 Multi-omics Blood ATlas (COMBAT) con-
et al., 2020; Tay et al., 2020). Severe COVID-19 is characterized     sortium. We identify cells, mediators, and pathways in peripheral
by hypoxia, with risk of rapid deterioration, progression to acute    blood that are hallmarks of increasing COVID-19 severity;
respiratory distress syndrome, multiorgan failure, and death.         resolve shared and specific features with influenza and sepsis;
Predisposing factors include age, gender, ethnicity, obesity,         and define potential biomarkers of the variable individual
and comorbidities. Currently, opportunities for biomarker-led         response to SARS-CoV-2 infection to support a future personal-
timed and targeted precision medicine approaches are limited          ized medicine approach.
by an incomplete understanding of pathogenesis and heteroge-
neity among patients with severe disease (Wynants et al., 2020).      RESULTS
A dysregulated hyperinflammatory state occurs in some individ-
uals (Moore and June, 2020), consistent with reported benefits        Clinical features, severity metrics, and disease
from glucocorticoids (dexamethasone), inhibitors of the IL-6 re-      stratification in COVID-19
ceptor (tocilizumab/sarilumab), and Janus kinases (baricitinib)       We aimed to characterize the peripheral blood response in
(Gordon et al., 2021; Horby et al., 2021a, 2021b; Kalil et al.,       COVID-19. To do this, we analyzed a prospective cohort of adult
2021). Nevertheless, blood-derived signatures of severity are         patients with confirmed SARS-CoV-2 presenting to clinical ser-
diverse, including evidence of immune suppression, myeloid            vices at the start of the United Kingdom pandemic (February–
dysfunction, lymphopenia, interferon driven immunopathology,          March 2020). We recruited 116 hospitalized COVID-19 patients
T cell activation/exhaustion, and immune senescence (Bost             following informed consent at a single site (Oxford University
et al., 2021; Chen and John Wherry, 2020; Diao et al., 2020; Had-     Hospitals) through the Sepsis Immunomics study (ethics
jadj et al., 2020; Mann et al., 2020; Schulte-Schrepping et al.,      approval South Central - Oxford C Research Ethics Committee
2020). Comparison with other severe respiratory viruses such          in England Ref 19/SC/0296) (STAR Methods, Table S1). The
as influenza show differences in target cells and control of viral    overall mortality rate was 23.3%. Samples were collected during
replication but also shared mechanisms, notably a dysregulated        the acute admission and in survivors from 28 days after
host response (Flerlage et al., 2021; Lee et al., 2020; Zhu et al.,   discharge (convalescent samples). We compared these patients

916 Cell 185, 916–938, March 3, 2022 ª 2022 The Author. Published by Elsevier Inc.
This is an open access article under the CC BY license (http://creativecommons.org/licenses/by/4.0/).
ll
Resource                           OPEN ACCESS

A

B          D

C

           E               F

G          H

                                 (legend on next page)

               Cell 185, 916–938, March 3, 2022 917
ll
OPEN ACCESS Resource
with community COVID-19 cases in the recovery phase (never ences in abundance persisted. The frequency of neutrophils,
admitted to hospital), age-matched healthy volunteers, influenza plasmablasts, plasmacytoid DCs (pDC), and basophils contrib-
cases requiring mechanical ventilation (critically ill receiving uted significantly to the overall variance in cell composition be-
intensive care), and all-cause sepsis patients (hospitalized en- tween patient groups (Figure S2E).
compassing severe and critical disease) recruited prior to the We validated and further characterized these differences us-
pandemic (Figure 1A; STAR Methods; Table S1). ing CITE-seq. Cellular composition differed by patient group
To optimize our chances of identifying specific cellular and mo- and by severity in hospitalized COVID-19 patients (Figures 1E–
lecular biomarkers that might in future have clinical utility, we 1H and S2F). By reducing the dimensionality of the data, we
analyzed patient classifiers of illness severity derived from clinical found the highest proportion of the observed variance (principal
features in our hospitalized COVID-19 cohort (STAR Methods). component [PC] 1) was associated with comparator group (Pc =
This showed severity scores and surrogate markers of illness 2.0131015, ANOVA) (Figure 1E; Data S5). When hospitalized
response were highly correlated (Data S2) and that patient clus- COVID-19 cases were analyzed alone, the largest component
ters showed broad concordance to the first-released WHO cate- of variance (PC1) was associated with group membership,
gorical criteria, namely mild (no requirement for supplemental ox- oxygenation status (SaO2/FiO2 ratio, SOFA oxygenation, and
ygen), severe (oxygen saturation SaO2 % 93% on air but not ventilation and oxygen status), and lymphocyte count (all Pc <
requiring mechanical ventilation), and critical (requiring mechan- 0.05) (Figure 1F; Data S5). The cell subsets with higher abun-
ical ventilation) (Figure S1A). This clustering persisted when we dance in more severe disease that contributed most to this
restricted the analysis to acute measures of physiology and clin- component (largest negative loadings in PC1) were platelets/
ical biomarkers, where the main correlates of consensus clus- CD34 megakaryocyte progenitors, hematopoietic stem (and
tering related to ventilation status (Figures S1B and S1C). progenitor) cells (HSCs), and cycling classical monocytes
Accordingly, hereinafter we refer to WHO categorical criteria as (cMono) (Figure 1G). Differential abundance analysis with age-/
our primary hospitalized COVID-19 severity comparator groups. gender-matched healthy volunteers showed differences in the
same cell populations, together with reduced dendritic cells
COVID-19 severity is associated with differences in (DCs), T, and NK cell subsets, particularly in COVID-19 critical
abundance of diverse immune cell populations cases (Figure S2F). Among hospitalized COVID-19 cases, higher
We first investigated changes in cellular composition associated abundance of platelets/CD34 megakaryocyte progenitors and
with COVID-19 severity using mass cytometry of whole blood cycling cMono was associated with oxygenation status (SaO2/
(Figure 1A; STAR Methods; Data S3), and Cellular Indexing of FiO2, SOFA oxygenation score, ventilation status), severity
Transcriptomes and Epitopes by Sequencing (CITE-seq) to (WHO ordinal), and CRP (all Pc < 0.01). Higher platelet/CD34
annotate peripheral blood mononuclear cell (PBMC) types, sub- megakaryocyte progenitor abundance was also associated
sets, and clusters (Figures 1A–1C, S1D, S1E, S2A, and S2B; with the occurrence of thromboembolism during hospitalization
STAR Methods; Table S2; Data S3–S5). We defined a ‘‘prioritized (Pc = 0.036, ANOVA) (Figure 1H; Data S5), highlighting their po-
sample set’’ comprising for each patient a single sample closest tential pathophysiological significance in severe COVID-19.
to onset of maximal disease as defined by clinical features at the
time of sampling. Mass cytometry of whole blood showed Whole blood hallmarks of COVID-19 and severity
increased absolute and relative neutrophil abundance and involving neutrophils, progenitor cells, lymphocyte
reduced overall T and B lymphocyte, myeloid, dendritic, baso- exhaustion, clotting, immunoglobulins, and the
phil, and natural killer (NK) cells in more severe/critical disease; interferon response
differential abundance of specific cell populations included We next defined global transcriptomic signatures of the host
increased activated and cytotoxic CD8+ T cells and classical response to COVID-19 by performing whole blood total
monocytes (Figures 1D, S2C, and S2D; Data S3). In community RNA-sequencing (Figure 1A; STAR Methods). We investigated
and convalescent COVID-19 patients, the cell composition was overall variance in gene expression for all individuals using the
broadly comparable to healthy volunteers, although some differ- prioritized sample set and found clear separation by clinical
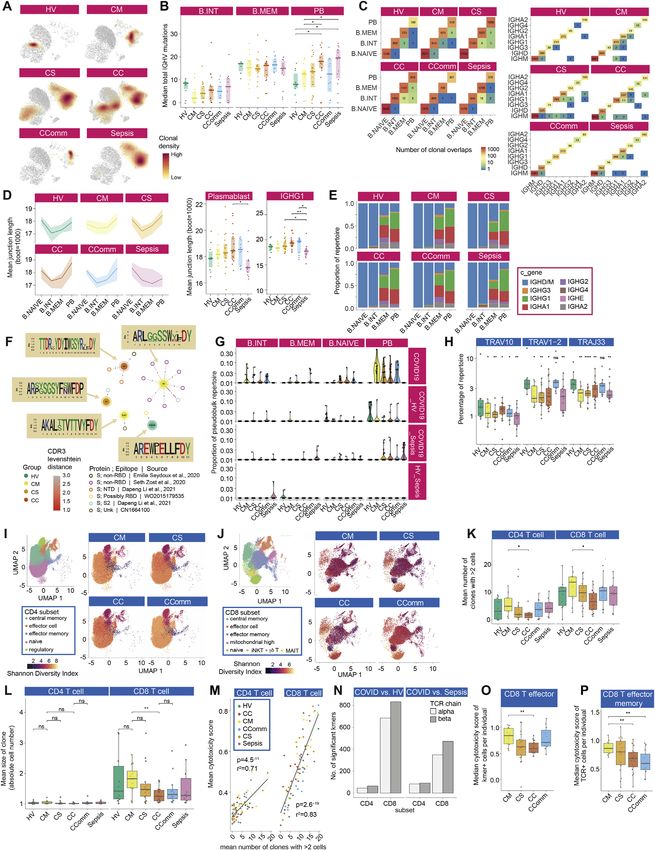
Figure 1. Single cell compositional analysis reveals variance in cell populations by clinical group and severity
(A) Study design, assay modalities, and workflow. Table shows number of patients assayed, with number of samples in brackets where more than one sample
assayed. *WHO severity categories show number of patients at time of sampling **single paired convalescent sample assayed for n = 16 COVID-19 and n = 3
sepsis patients; ***10 samples assayed (8 samples for paired acute-convalescent COVID-19 and 2 healthy).
(B) Summary of supervised multimodal annotation strategy for the CITE-seq data (described in STAR Methods; clustering of GEX modality shown in Figure S1E).
(C) Summary of cell populations identified by CITE-seq (phenotypes shown in Data S4).
(D) Differential abundance of major cell populations in granulocyte (CD66+) depleted whole blood where significant between comparator groups (7,118,158 cells
assayed using single cell mass cytometry).
(E–H) CITE-seq compositional analysis of minor cell subsets.
(E and F) Principal components analysis (PCA) showing PC1 versus PC2 with 95% data ellipses (assuming a multivariate t-distribution) of (E) all comparator
groups and (F) hospitalized COVID-19 cases.
(G) Loadings of minor cell subsets on PC1 for hospitalized COVID-19 cases.
(H) Covariate analysis for clinical, demographic, and experimental variables for hospitalized COVID-19 cases plotting significant minor cell subsets (BH adjusted
ANOVA for significance).
See Figures S1 and S2.
918 Cell 185, 916–938, March 3, 2022
ll
Resource                                                                                                                              OPEN ACCESS

A                                                           B                                                        C

D                                                                  E

                                                                                                           F

                                                                   G

H

                                                                     I

Figure 2. Signatures of COVID-19 response from transcriptomics
(A–F) Whole blood total RNA-seq.
(A and B) Principal component (PC) analysis of (A) all comparator groups and (B) hospitalized COVID-19 cases.
(C) Differential gene expression critical versus mild COVID-19.
(D) Pathway enrichment for COVID-19 severity as a quantitative trait ± inclusion cell proportion.
(E) Differential gene expression COVID-19 versus sepsis.
(F) Intramodular hub genes for weighted gene correlation network analysis module grey60.

                                                                                                                         (legend continued on next page)

                                                                                                                Cell 185, 916–938, March 3, 2022 919
ll
      OPEN ACCESS                                                                                                                         Resource

group, namely between healthy volunteers, increasing severity                    trophils) based on high expression of CD64 (Fc gamma receptor 1)
among COVID-19 cases and patients with sepsis (Figure 2A).                       and CD49d (integrin alpha 4), and decreased expression of CD10
Among hospitalized COVID-19 patients, the largest component                      (neutral endopeptidase) (Figure 2G) (Evrard et al., 2018; Kwok
of variance was associated with 28-day mortality (PC1, p =                       et al., 2020; Marini et al., 2017). CD64 expression was raised in se-
2.343106, Kruskal-Wallis test) (Figure 2B), which also corre-                   vere/critical COVID-19 and further elevated in sepsis, together
lated with other measures of severity and differential cell count                with increased PD-L1 (CD274) expression (Figure S4A). Using
(Figure S3A). We found that genes contributing to this component                 CD64:CD10 ratio as an index score for immature neutrophil pres-
(highest loadings for PC1) were strongly enriched for immune                     ence, we found association with the MEblue module eigengene
system function, notably neutrophil degranulation (fold change                   that correlated with neutrophil count and function (Figure S4B).
[FC] = 4.23, false discovery rate [FDR] = 2.431015), PD-1                       We further determined that neutrophil CD49d expression was
signaling (FC = 21.5, FDR = 9.231012) (consistent with lympho-                  elevated, while CD43 (leukosialin) was reduced, in COVID-19 pa-
cyte exhaustion), antimicrobial peptides (FC = 10.8, FDR =                       tients but was largely unchanged in sepsis (Figure 2G). The
9.23107), and clotting cascade (FC = 10.6, FDR = 2.13105).                     CD49d:CD43 ratio remained high in convalescence (Figure 2G).
The second largest component of variance in the data (PC2)
showed strong enrichment for genes involved in interferon                        Shared and cell-type-specific single-cell gene
signaling (FC = 10.7, FDR = 331033) including key viral response                expression signatures of COVID-19 involving ZFN,
network genes (IFI1-3, IFI6, IFI44, IFIT3, and OAS1-3) and spe-                  ribosomal and cell-cycle genes, and AP-1 and interferon
cific immunoglobulin heavy and lambda genes (Figure S3B).                        signaling
   We further analyzed genes differentially expressed according                  To further deconvolute biological pathways and cellular func-
to COVID-19 severity among hospitalized patients and found                       tions associated with COVID-19 we analyzed gene expression
greatest enrichment for T cell receptor (TCR) and PD-1 signaling,                at single-cell resolution (STAR Methods; Data S6; Table S3).
antimicrobial peptides, fibrin clot formation, integrin and immu-                Among hospitalized and community COVID-19 cases (prioritized
noregulatory interactions, and platelet and neutrophil degranula-                sample set), we found the principal components of variance in
tion. This was robust to inclusion of cell proportion as a covariate             gene expression involved cMono, naive B cells, plasmablasts,
(Figures 2C, 2D, and S3C). We found these aspects of the                         CD4+ T cells (naive, effector, and effector memory), and cycling
response to COVID-19 were largely distinct from non-SARS-                        NK cells (Figures 2H, 2I, and S4C). We performed pathway anal-
CoV-2 sepsis of comparable severity (Figure 2A). Specific fea-                   ysis for differentially expressed genes in major cell types (Fig-
tures of COVID-19 compared to sepsis included upregulation                       ure S4D; STAR Methods) (Liberzon et al., 2015). This showed
in COVID-19 of many immunoglobulin heavy/kappa/lambda                            enrichment for type I and II interferon pathways in the less severe
genes and unique pathway enrichments relating to cell prolifera-                 hospitalized COVID-19 patients across cell types. Redox state
tion and innate/adaptive immune function (Figures 2E and S3D).                   (reflected by MTORC1 signaling and oxidative phosphorylation)
   Next, we identified clusters of highly interconnected genes                   was enriched across mononuclear phagocytes (MNP), T cells,
(modules) correlated with COVID-19 severity using weighted                       NK cells, and plasmablasts in more severe COVID-19, as were
gene correlation network analysis (WGCNA) (Star Methods; Fig-                    cell cycle (MYC targets, E2F targets, G2M checkpoint) pathways
ure S3E). The three modules most significantly correlated with                   (except for MNP), while IL2-STAT5 pathway enrichment in T cells
severity (p < 131010) were enriched for, respectively, cellular                 was found in more severe disease. Interferon stimulated genes
and functional neutrophil gene signatures and neutrophil count                   showed enrichment in a range of cell subsets in COVID-19
(MEblue module); CD8+ T cell signatures and relative lymphope-                   cases, notably cDCs (Figure S4E–S4G).
nia (MEturquoise module); and granulocyte and common myeloid                        We then determined network modules for major cell subsets
progenitor cell gene signatures, neutrophil degranulation, antimi-               by WGCNA (Figures 3A and 3B; Star Methods; Data S6). Analysis
crobial peptides, and defensin pathways (MEGrey60 module)                        of module co-variation identified five distinct module sets. A set
(Figures S3F and S3G). The MEgrey60 module was more highly                       of type I IFN response modules was found across cell popula-
expressed in critical COVID-19 than sepsis (Figure S3H), and                     tions in which representative gene expression profiles (module
the ETS transcription factor related gene ERG, which regulates                   eigengenes) correlated with milder disease, better oxygenation
lineage plasticity, showed the highest intramodule connectivity                  status, and earlier sampling from symptom onset (Figures 3A
(Figure 2F). These features indicate the MEgrey60 module repre-                  and 3B). The second module set, discovered in all cell types
sents a variety of progenitor cells that associate with severity,                except plasmablasts, showed strong enrichment for activator
further supporting the importance of these cells.                                protein 1 (AP-1) (FOS, JUN, ATF family genes) and the
   To better characterize neutrophil populations in COVID-19, we                 p38MAPK cascade. The module eigengenes were highly ex-
applied a myeloid-marker enriched mass cytometry panel to the                    pressed in all COVID-19 patient groups, including recovery
same samples (STAR Methods). We found evidence for the pres-                     phase community cases; were distinct from influenza and
ence of immature neutrophils and neutrophil progenitors (pro-neu-                sepsis; and did not show a consistent relationship with severity

(G) Neutrophil cell surface proteins assayed by mass cytometry shown by marker or ratio of markers. Boxplots show median and first and third quartiles; whiskers
show 1.5x interquartile range.
(H and I) CITE-seq gene expression. (H) Association of PCs of expression variance within minor cell subsets in COVID-19 patients. (I) PC plots in classical
monocytes and naive CD4+ T cells.
See Figures S3 and S4.

920 Cell 185, 916–938, March 3, 2022
ll
Resource                                       OPEN ACCESS

A                      B

C

                           D

E          F   G   H

                                             (legend on next page)

                           Cell 185, 916–938, March 3, 2022 921
ll
      OPEN ACCESS                                                                                                                     Resource

or other clinical features (Figures 3A–3D). The third module set               variables relating to oxygenation and respiratory function in hos-
was enriched for classical (C2H2) zinc finger (ZNF) genes and                  pitalized cases (Figure 4D). Pathway enrichment analysis of
contained IRF2 and IL16; expression of these eigengenes was                    differentially expressed genes identified inflammatory
lower in COVID-19 and influenza compared with healthy volun-                   response/TNF signaling and interferon response in milder dis-
teers and sepsis cases (Figures 3A and 3B). The fourth set of                  ease including community cases (cMono, ncMono, and DC); hyp-
modules involved ribosomal proteins and inflammasome func-                     oxia (cMono, DC), and IL2_STAT5 pathways (cMono) across
tion (top genes by membership included NLRP1, MAP3K14,                         severity groups; and complement coagulation and cholesterol
and FOXP1) and was negatively correlated with COVID-19                         metabolism in more severe disease in cMono (Figures S5E–S5G).
severity in monocytes (Figures 3A, 3B, and 3E). Finally, we found                 To investigate epigenetic correlates of the COVID-19
a set of ‘‘cycling’’ modules, which in cMono correlated with                   response, we analyzed chromatin accessibility by single-cell
severity, and included S100A8/9 encoding calprotectin, a known                 ATAC-seq (Figures 1A, S5H, and S5I; STAR Methods). Overall,
severity biomarker (Silvin et al., 2020) (Figures 3A, 3B, and 3F).             750 and 303 accessible sites were up- and downregulated,
We also identified two cell-type-specific modules associated                   respectively, in COVID-19 patients compared to healthy volun-
with severe disease, a JAK-STAT/interleukin signaling module                   teers in myeloid cells (Figure S5J). Genes linked to top differen-
in CD4+ T cells, and an EGFR pathway-enriched module in                        tially open chromatin peaks included STK24 (MAPK promoting
cMono including the stress response gene FKBP5 and scav-                       apoptosis) and FGFRL1 (cell adhesion promoting fibroblast
enger receptor CD163 (Figures 3A, 3B, 3G, and 3H).                             growth factor receptor) (Figures S5J and S5K). We identified
                                                                               the most significant DNA binding motif enrichments in the differ-
Transcriptomic and epigenetic signatures of severity in                        entially accessible sites involved AP-1, SW1/SNF, and BACH
monocyte populations                                                           transcription factor family members, which regulate chromatin
We further investigated signatures of severity for specific mono-              remodeling and immunity (Figure 4E). Moreover, motif footprint
nuclear phagocyte populations (Figures 4A and 4B; STAR                         analysis revealed increased accessibility of genomic regions
Methods; Data S3–S6). Hospitalized COVID-19 patients with                      containing FOS and JUN motifs in COVID-19 patients relative
more severe disease had a relatively higher frequency of cMono                 to healthy volunteers in myeloid cells, a signal which was also
and fewer intermediate monocytes (CD16+CD14+), ncMono                          seen in convalescence (Figure 4F).
(CD14CD16+), and DCs (Figures 4A and S5A–S5C). With
increasing disease severity, we found a shift in the phenotype                 COVID-19 severity correlates with specific T and NK cell
of cMono to lower expression of HLA-DR, CD33, and CD11c,                       populations and features relating to cell cycle, redox
and evidence of proliferating monocytes based on expression                    state, and exhaustion
of Ki-67 and DNA abundance, with comparable changes in                         We proceeded to further characterize T and NK cell populations
sepsis patients (Figures 4C, S5A, and S5B). Lower levels of                    using mass and multicolor flow cytometry (STAR Methods; Data
pDCs and CD33lowcDC2 were found in sepsis compared with                        S3). We found activated CD4+ and CD8+ T cells were increased
severe/critical COVID-19 (Figure 4A).                                          in frequency in all COVID-19 patient groups and remained
  Further analysis of cMono using CITE-seq showed that a                       elevated in convalescence (Figures 4A and S6A). The proportion
cycling cluster, and a cluster with high expression of the anti-               of CD27+ activated CD4+ T cells was higher than in sepsis, while
oxidant metallothionein genes (MThi), were significantly elevated              the CD56+ cytotoxic CD8+ T cell frequency was reduced (Fig-
in critical COVID-19 cases, influenza and sepsis compared                      ure 4A). We investigated T cell subsets using markers of activa-
to healthy volunteers (Figures 4B and S5D). We found that                      tion, proliferation, and exhaustion. While comparably expressed
S100A8/9/12hi HMGB2-expressing cMono correlated with                           in activated CD4+ T cells across acute COVID-19 cases, these
COVID-19 severity and were also increased in sepsis. cMono ex-                 markers increased in CD8+ T cells with increasing disease
pressing VCAN, which is implicated in cytokine release, were                   severity (Figure 4G). We found differential chemokine receptor
specifically increased in COVID-19 and reduced in influenza,                   expression in the overall memory CD4+ T cell population (Figures
while complement component C1Q-expressing ncMono were                          S6B and S6C) and increased expression of the inhibitory recep-
increased in influenza and sepsis, but not in COVID-19. pDCs                   tor TIM3 in activated CD8+ T cells (Figure S6D). CLA+ HLADR+
showed reduced abundance in more severe COVID-19, influ-                       NK cells were increased in all COVID-19 cases including conva-
enza, and sepsis, as did CD1c+ cDCs. Consistent with the pro-                  lescence (Figure S6E). We also found evidence of changes in
gressive changes in abundance according to COVID-19 severity,                  innate-like lymphocytic cell populations with increasing
the frequencies of cycling cMono and S100A8/9/12hi HMGB2 ex-                   COVID-19 severity, including mucosal associated invariant T
pressing cMono, and CD1c+ cDCs, were associated with clinical                  (MAIT) cells, which showed a gradient of involvement across

Figure 3. Single cell gene expression modules identify hallmarks of COVID-19 response
(A–H) Weighted gene correlation network analysis (WGCNA) of CITE-seq gene expression for major cell types.
(A) Association of module eigengenes with disease contrasts, clinical severity scores and variables, survival and gene set scores (*all significant associa-
tions shown).
(B) Module pathway enrichment.
(C and D) p38MAPK.AP-1 module eigengene (C) correlation with AP-1 family genes (D) expression across patient groups.
(E–H) Eigengene expression and top eigengene-gene correlations for (E) ribosomal module in cMono (F) cycling module in cMono (G) JAK-STAT.interleukin
module in CD4 and (H) FKB5.CD163 module in cMono. For all violin plots, median indicated by horizontal bar.

922 Cell 185, 916–938, March 3, 2022
ll
Resource                                   OPEN ACCESS

 A             B

 C

 D
           E            F

 G                 H

                                         (legend on next page)

                       Cell 185, 916–938, March 3, 2022 923
ll
      OPEN ACCESS                                                                                                                           Resource

severity in terms of cell activation (higher % CD69+ MAIT cells in                clonal expansions appeared to predominate within the memory
more severe disease, Figure 4H).                                                  B cell population, while in COVID-19 and sepsis patients, we
   Complementing these findings, CITE-seq analysis (STAR                          found expansions in plasmablasts, with severe and notably crit-
Methods; Data S5) showed an increase in cycling and activated                     ical COVID-19 patients also harboring clones within memory
CD4+ and CD8+ T and NK cell populations in hospitalized                           populations (Figure S7A). The clonal expansion in plasmablasts
COVID-19 cases, including CCR4hi Tregs (Figures 4B and                            was statistically significant and also showed an association
S6F). Conversely, we observed a decrease in CD4+ Th1,                             with COVID-19 severity, in contrast to sepsis where there was
CCL5+ CD8+ T central memory, CD45RA+ CD8+ T effector mem-                         no significant change (Figure 5B).
ory, and NK cells with high mitochondrial gene expression. There                     Limited somatic hypermutation (SHM) of SARS-CoV-2 anti-
was minimal compositional variation in these cell populations                     bodies has been widely reported (Brouwer et al., 2020). We
associated with severity or clinical covariates (Data S5). Analysis               observed fewer somatic hypermutations in intermediate B cells
of gene expression in hospitalized COVID-19 patients showed                       in hospitalized mild COVID-19 but a severity-associated in-
the most significant clinical correlate involved activated NK cells               crease within plasmablasts, also seen in sepsis (Figure S7B).
(CD56highCD16low XCL1/2 expressing) where the largest compo-                      There were, however, COVID-19 specific differences in the pro-
nent of variance was associated with WHO ordinal and oxygen-                      portion of expanded clones with few mutations (> 95% IGHV
ation/ventilation status (Figure S6G). Across CD4+, CD8+, and                     identity, Figure 5C). RNA velocity analysis suggested a differen-
NK cells, we found cell cycle and redox state pathways were en-                   tiation directionality between naive B cells and plasmablasts in
riched for differentially expressed genes in more severe hospital-                COVID-19 patients distinct from sepsis, and consistent with a
ized COVID-19 cases; interferon pathways in less severe dis-                      predominant extrafollicular B cell response in COVID-19 (accu-
ease; and TNF signaling in community cases versus healthy                         mulating fewer SHMs) (Figure 5D). Moreover, we observed a
volunteers (Figure S6H). MAIT cells showed enrichment for                         higher number of shared clones between plasmablasts and in-
TNF signaling and KRAS across COVID-19 groups and gd                              termediate or memory B cells in severe/critical COVID-19 pa-
T cells for cell cycle pathways (Figure S6H).                                     tients, whereas sepsis patients exhibited higher clonal overlap
                                                                                  between intermediate and memory B cells (Figure S7C).
Severe COVID-19 is associated with clonal expansion of                               These data together indicate substantial expansion of unmu-
unmutated B cells and activation of autoreactive B cells                          tated B cells associated with plasmablast populations in se-
We then investigated at high resolution how B cell populations                    vere/critical COVID-19. We next explored differences in B cell se-
vary in COVID-19. Mass cytometry (STAR Methods; Data S3)                          lection and tolerance. First, in COVID-19 patients, we observed
demonstrated significant lymphopenia in COVID-19 with                             increased BCR complementarity-determining region 3 (CDR3)
reduced overall frequency and number of B cells, predominantly                    lengths compared to sepsis (Figure S7D); such increases have
naive B cells, but an increase in terminally differentiated plasma-               been associated with antibody polyreactivity and autoimmunity
blasts (significantly higher than in sepsis) and a relatively high                (Meffre et al., 2001). Second, we found multiple differentially uti-
proportion of CLA+ plasmablasts (Figures 1B, 4A, and S6I). We                     lized IGHV/J genes between COVID-19 groups indicating differ-
found the greatest increase in switched memory CD11c+ B cells                     ential B cell selection and/or expansion of naive B cells, while
in community COVID-19 cases, while unswitched memory B                            the antigen experienced IgD/M mutated and class-switched B
cells and naive CD11c+ B cells were higher in COVID-19 conva-                     cell repertoire showed differentially utilized IGHV/J genes,
lescent samples (Figure 4A). Analysis of CITE-seq-defined clus-                   revealing differential peripheral selection of B cells with
ters (STAR Methods; Data S4) revealed increases in plasma-                        increasing COVID-19 severity (Data S3). Third, we tested whether
blasts in severe disease; naive CD1c+ naive and cycling naive                     B cells targeting autoantigen and red blood cell antigen are asso-
B cells were reduced in COVID-19, but overall, naive B cells                      ciated with COVID-19. We found that autoreactive IGHV4-34
were significantly more reduced in influenza than COVID-19 of                     BCRs, which are elevated in autoimmunity (Pascual et al.,
comparable severity; and in mild hospitalized COVID-19, only                      1991), were significantly depleted in IGHD/M but elevated in
the interferon-responsive naive B cell cluster showed an in-                      class-switched B cells, most notably for the IGHA2 and IGHG2
crease (Figures 4B and S6J).                                                      B cells (Figure 5E) consistent with class-switching of these autor-
  We then characterized the B cell immune repertoire using bulk                   eactive B cells during the response to SARS-CoV-2. In further
VDJ sequencing of whole blood and CITE-seq (Figures 1A and                        support of this, the degree of class-switching, inferred from the
5A; STAR Methods; Data S3 and S4). In healthy volunteers,                         BCR sequencing data (Bashford-Rogers et al., 2019), was

Figure 4. Changes in myeloid and lymphocyte cell populations associated with COVID-19 severity
(A and B) Differential cell abundance in patients versus healthy volunteers, and between disease categories for myeloid, T, NK, and B cells for prioritized sample
set assayed by (A) single cell mass cytometry and (B) CITE-seq, plotting cell populations where significant between comparator groups.
(C) UMAP by patient group for myeloid cell clusters derived from mass cytometry and Mean Metal Intensity (MMI) of HLA-DR, CD33 and CD11c.
(D) Covariate analysis of cell abundance assayed by CITE-seq and clinical, demographic, and experimental variables for hospitalized COVID-19 cases (BH
adjusted ANOVA test for significance).
(E and F) scATAC-seq (E) differential motif enrichment in myeloid cells, acute COVID-19 versus healthy volunteers and (F) transcription factor footprinting for
myeloid enriched factors JUN and FOS.
(G and H) Single cell mass cytometry (G) MMI of specific markers in activated CD4+ and CD8+ T lymphocytes (H) frequency of activated MAIT cells.
Boxplots show median, first and third quartiles; whiskers 1.5x interquartile range.
See Figures S5 and S6.

924 Cell 185, 916–938, March 3, 2022
ll
Resource OPEN ACCESS
A B C
D
E F
G H I J
K L M
Figure 5. Differences in B and T cell repertoire associated with COVID-19 severity
(A–F) B cells: (A) UMAP embedding with cluster identities from CITE-seq. (B) Plasmablast repertoire clonality. (C) Mutation and expansion proportions in plas-
mablast clone repertoire. (D) Partition-based graph abstraction plots of scRNA-seq by cell population and patient group. (E) IGHV4-34 AVY/NHS motif usage in
unmutated VDJ sequences across IGH genes (bulk BCR-seq). (F) Class switch inference networks (RNA derived BRCs). Significance * < 0.05, ** 0.005 Kruskal
Wallis.
(G–M) T cells: (G) Shannon Diversity Index for specific cell populations by comparator group. (H) Mean cytotoxicity score by comparator group. (I) Proportion of
CD8+ T cells carrying TCR containing COVID-19 associated Kmers. (J) Frequency of COVID-19 Kmer positive cells in CD8+ naive and effector memory cells. (K)
Correlation of COVID-19 Kmer containing CD8+ T cells per individual with median cytotoxicity score. (L) UMAP of CD8+ T cells by patient group indicating density
(legend continued on next page)
Cell 185, 916–938, March 3, 2022 925ll
OPEN ACCESS Resource
significantly elevated between IgD/M and IgG1 and IgA1 and was higher in mild and community COVID-19 cases with reduced
finally to IgG2 in COVID-19 patients (Figures 5F and S7E). No cytotoxicity observed in critical and severe disease (Figure 5H).
detectable differences in either IGHV4-34 autoreactive BCR To further explore whether COVID-19 leads to generalized sig-
levels or class-switching were observed in sepsis cases. natures of antigen presentation with reciprocal effects on TCR
Previous reports indicate an unexpectedly high level of BCR sequence and corresponding CDR3 usage, we devised an
convergence between unrelated COVID-19 patients (Galson approach to identify COVID-19 associated amino acid sequences
et al., 2020). We also found clonal sharing within and between (Kmers of 4 amino acids) within the beta chain CDR3 region (STAR
COVID-19 severity groups (Figures S7F and S7G; Data S3). Methods). These were compared with chains from healthy volun-
Comparing to known receptor-binding domain antibodies, we teers and sepsis patients to exclude sequences non-specifically
observed that most highly similar patient BCRs have a plasma- associated with infection (Data S3). We identified 125, 4-amino
blast phenotype (Figure S7G). Overall, our data indicate that the acid Kmers (referred to as COVSeqs) enriched in COVID-19
plasmablast expansions in severe COVID-19 include high levels (Pc < 0.05 versus both groups), the vast majority in CD8+ T cells
of broadly auto-reactive B cells, consistent with an emerging (Figure S7N), with the proportion of cells with TCRs containing
role for B cell driven immune pathology (Wang et al., 2021). at least one COVSeq in the beta chain specifically increased in
all COVID-19 patients (Figure 5I). In hospitalized patients, we
Reduced diversity in CD8+ T cell populations on found a lower proportion of CD8+ T effector memory cells with
repertoire analysis COVSeq containing TCRs with increasing disease severity (Fig-
To further investigate the effect of disease on T cell subsets with ure 5J). Critical disease was associated with naive CD8+ T cells
reference to antigen recognition and clonality, we integrated containing COVSeqs, indicating failure of the SARS-CoV-2 reac-
TCR sequencing data performed across the same cell subsets. tive cells in critical patients to expand into the effector phenotype,
Given we saw clonotypes present across populations, we or possibly a distinct redistribution of the expanded cells. Further
merged subsets to provide power for downstream clonal anal- supporting functionality of the COVID-19 Kmer containing cells,
ysis (STAR Methods). For semi-invariant T cells, differences the proportion of COVSeq-containing cells was correlated with
observed with severity and disease group by cell cluster were the median cytotoxicity of cells per individual among the
supported by consistent changes in TCR alpha variable (TRAV) COVID-19 patients (Figures 5K and S7N). Notably, COVSeq-pos-
gene usage. Hospitalized COVID-19 and sepsis cases displayed itive CD8+ T effector cells from critical patients showed reduced
reductions in the percentage of repertoire occupied by TRAV10, cytotoxicity compared to mild disease (Figure S7O).
specific to invariant NK T cells, and TRAV1-2 and TRAJ33 usage, Finally, we addressed whether using previously published
in keeping with reductions in MAIT cells (Figure S7H). COVID-19 associated beta chain clonotypes could further resolve
To better understand the relationship between COVID-19 and variation in the T cell response according to disease severity
T cell clonality, we calculated Shannon diversity indices across (STAR Methods). We observed many cells carrying such TCRs
clones based on the TCRbeta chain, controlling for age. While across the COVID-19 patients, often overlapping COVSeq-con-
CD4+ subsets showed higher diversity than CD8+ subsets, differ- taining cells. Notably, the distribution of these cells across clusters
ences with disease severity were only seen in CD8+ T cells (Fig- varied markedly according to COVID-19 disease state (Figure 5L).
ures S7I and S7J; STAR Methods). Across disease states and Replicating the observations with COVSeq-positive cells, CD8+ T
accounting for age, CD8+ T effector memory (CD8.TEM/ effector memory cells were relatively depleted for COVID-19 clo-
TEMRA), CD8+ T central memory (CD8.TCM/CD8.TCM.CCL5), notypes in critical disease (Figures 5M and S7P).
and MAIT cell diversity were reduced in COVID-19 severe and
critical disease with comparable changes in sepsis (Figure 5G). Correlates of severity and disease specificity in the
Recent evidence suggests that effective CD8+ T cell re- COVID-19 plasma proteome involve acute phase
sponses involve increased numbers of expanded clones (Fairfax proteins, metabolic processes, and markers of tissue
et al., 2020). Consistent with this, we found hospitalized COVID- injury
19 patients with mild disease had higher numbers of expanded We aimed to complement our multimodal cellular profiling with
clones in both CD4+ and CD8+ subsets, and the mean clone analysis of the COVID-19 plasma proteome. To do this, we per-
size was higher within the CD8+ subset (Figures S7K and S7L). formed high-throughput liquid chromatography with tandem
In keeping with the observation that expanded CD8 T cell clones mass spectrometry (LC-MS-MS), presenting data for 105 proteins
show increased expression of cytotoxicity markers (Watson et on 257 individuals (340 samples) (Figure 1A; STAR Methods; Data
al, 2020), using a composite gene score for cytotoxicity, we S3). We found differences by severity and etiology by analyzing
found that the number of expanded clones correlated with the principal components of variance (Figure 6A) and on unsupervised
average cytotoxicity score across all cells for that individual in hierarchical clustering and supervised correlation analysis (Data
both CD4+ T effector (CD4.TEFF/TEFF.prolif) and CD8+ T S3). Severe disease, reflected in variance component loadings,
effector (CD8.TEFF/TEFF.prolif) populations (Figure S7M), and was associated with increased acute-phase proteins and
of COVID-19 Kmer positive cells (blue dashed line) and cells with previously described COVID-19 clonotype. (M) Proportion of COVID-19 known clonotype
matching cells in CD8+ naive and effector memory cells.
Wilcoxon Test age and sample size adjusted linear model *p < 0.05, **p < 0.01, ***p < 0.001. All boxplots show median, first and third quartiles; whiskers 1.5x
interquartile range.
See Figure S7.
926 Cell 185, 916–938, March 3, 2022ll
Resource OPEN ACCESS
A B C
D
F
E
G
H I
(legend on next page)
Cell 185, 916–938, March 3, 2022 927ll
OPEN ACCESS Resource
complement system proteins, including recognized biomarkers of kine proteins using the Luminex assay for 171 individuals (Fig-
inflammation (SAA1, SAA2, and CRP), complement membrane ure 1A; STAR Methods; Data S3). There was clear clustering of
attack complex components (C5, C6, C9, and CFB), and function- hospitalized COVID-19 cases by severity on analysis of principal
ally related protein families such as protease inhibitors (SERPINA3, components of variance, while community cases overlapped
SERPINA1, and ITIH3) and serum amyloid P-component (APCS) with heathy controls and sepsis cases clustered separately (Fig-
(Figure 6B; Data S3). We also found differential protein abundance ure S8E). The major proteins contributing to these axes of vari-
involving markers of tissue injury and necrosis, notably reduced ance between groups were CXCL10, CXCL5, EGF, CCL2,
extracellular actin scavenger plasma gelsolin (GSN); increased fi- S100A9, IL6, LCN2, CCL20, LF, and G-CSF (Figure S8E). Overall,
brinogens (FGA, FGB, and FGG); and an increase in proteins impli- we found 49% (25 of 51) analytes were differentially abundant in
cated in IL-6 mediated inflammation (LGALS3BP, LRG1, LBP, HP, plasma from COVID-19 cases versus healthy volunteers (Figures
and ITIH4). We further identified protein clusters based on the pro- 6D, S8F, and S8G; Data S3). Among these, CCL2, CCL19,
tein-protein interaction network, including a large cluster enriched CCL20, CXCL10, GM-CSF, IL-6, IL-8, IL-15, S100A9, and
for biological processes involving cholesterol transport and fibrin SCGF (all increased abundance) were strongly correlated with
blood clots within which individual proteins showed positive and severity in hospitalized COVID-19 patients (r2 > 0.5, p < 0.001).
negative correlations with disease severity (PC1). Two smaller We further compared with sepsis and influenza to investigate
clusters enriched for cytolysis and complement activation posi- disease specificity and found the plasma levels of G-CSF, IL-8,
tively correlated with disease severity (both showing negative cor- LF, CD163, LCN2, CCL20, IL-6, IL-10, CCL4, CCL19, TNF, and
relations for all constituent proteins with PC1) (Figure 6C). C5a were lower in critical and severe COVID-19 than sepsis (Fig-
We found the main processes associated with differences be- ures 6E and S8G). Compared with influenza, serum EGF, LF, and
tween samples were acute-phase response and inflammation, CD40L were higher in serum from patients with critical COVID-
metabolic (retinoid and lipoprotein), and cholesterol transport 19, while G-CSF was lower (Figure S8H). We then investigated
(Figure S8A). Reduced levels of proteins associated with lipopro- protein-protein correlation network relationships of assayed
tein and cholesterol metabolism included apolipoproteins A-I, A- plasma cytokines and chemokines. This identified S100A9, M-
II, C-I, and C-II (APOA1/2 and APOC1/2) and transthyretin (TTR), CSF, and CCL2/19 as nodal proteins. When we performed pro-
consistent with their downregulation in systemic inflammation tein-clinical trait correlation network analysis for COVID-19
and differences in metabolic state specifically associated with severity, we found strong correlations (|r| > 0.5) between clinical
disease severity. This was further evident on pairwise compari- features (CRP, SaO2/FiO2, and ventilation days) and specific
sons, with mild hospitalized COVID-19 patients differing from nodal proteins (GM-CSF, CXCL10, TREM-1, CCL2/19, TF, IL-
healthy volunteers in metabolic processes and vesicle transport 6/15, MPO, and S100A9) at the center of the network (Figure 6F).
of retinoid, cholesterol, lipoproteins, and fat-soluble vitamins;
and from community cases by higher levels of complement acti- Plasma proteome variation identifies patient sub-
vation and coagulation (Figure S8B). Severe COVID-19 patients phenotypes of differing disease severity
differed from mild and from critically ill patients in processes We next investigated the utility of plasma proteins for patient
relating to platelet degranulation and neutrophil degranulation sub-phenotyping within hospitalized COVID-19 cases (n = 122
respectively (Figures S8C and S8D). When we compared severe samples) by integrating the LC-MS-MS and Luminex datasets
and critical COVID-19 with sepsis, 19 out of 105 proteins showed using Similarity Network Fusion (SNF) (Wang et al., 2014) (Fig-
changes specific to COVID-19 (FDR < 0.05, FC > 1.5), enriched in ure 6G; STAR Methods). We first constructed a sample-by-sam-
acute-phase response, complement activation, and receptor- ple similarity matrix from which we derived a network for each of
mediated endocytosis (Figure S8D). the two data types. Analyzing these individually in an unsuper-
vised manner with spectral clustering, we could only discrimi-
Plasma cytokine and chemokine profiling shows nate a minority of cases (the most mild from all others). However,
evidence for involvement of inflammatory mediators when we fused these networks into a single similarity network
To characterize inflammatory mediators of the response to that maximized shared and complementary information, we
SARS-CoV-2, we analyzed 51 circulating cytokine and chemo- discovered two clusters that separated by clinical measures of
Figure 6. Plasma protein COVID-19 signatures and sub-phenotypes
(A–C) HT-LC-MS/MS mass spectrometry of plasma proteins.
(A) Principal components analysis (PCA) of all samples.
(B) Proteins contributing to PC loadings (more negative loading values indicating higher positive correlation with disease severity).
(C) Clusters based on protein-protein interaction network with enriched GOBP terms.
(D–F) Proteins significantly differentially expressed between comparator groups assayed by Luminex.
(D) Fold change in plasma proteins in hospitalized COVID-19 versus healthy volunteers. Data represented as mean ± SEM.
(E) Plasma and serum protein abundance by comparator group.
(F) Network of clinical featureprotein correlations in COVID19 patients and healthy volunteers based on highly correlated events (r2 > 0.7 or < -0.5).
(G) Similarity network fusion (SNF) using plasma proteins for hospitalized COVID-19 patients from COMBAT cohort showing approach and PCA colored by cluster
(left) or WHO severity group (middle) or SOFA O2 score (right).
(H) Kaplan-Meier survival plot by SNF cluster group (95% CIs shaded) (HR, hazard ratio calculated using Cox proportional hazard model).
(I) Mass General Hospital (Olink) validation data and COMBAT (discovery) cohorts showing cluster groups (left) or colored by WHO max severity (right).
See Figure S8.
928 Cell 185, 916–938, March 3, 2022ll
Resource OPEN ACCESS
A B
C E
D
F
G
H
I
(legend on next page)
Cell 185, 916–938, March 3, 2022 929ll
OPEN ACCESS Resource
disease severity including inspired oxygen concentration and maximally contributing to each (Figure 7A). After feature elimina-
SOFA oxygen score (t test Pc < 0.05) (Figure 6G). Notably, this tion based on performance, we found the minimal set of cross-
molecular classification stratified severe cases assigned based modality features to predict severity were the acute phase pro-
on WHO categorical criteria into those that group with more teins SAA2 and CRP, an immunoglobulin (IGHG4), chemokines
mild cases and those clustering with critical cases. We identified (CCL20 and CCL2), IL-6, and complement component C5a;
11 proteins as the main discriminatory features distinguishing the combined performance of these features in the hold-out vali-
the clusters (mutual information score R 0.15) (Figure 6G). The dation set showed a balanced accuracy of 75%–80% to predict
predictive protein set spanned key inflammatory mediators, WHO category group (Figures 7B, S9B, and S9C). We also used
including the cytokines and chemokines IL-6, IL-8 (CXCL8), machine learning to search for features that distinguish hospital-
CCL2, CCL19, CCL20, and CXCL10 together with S100A9 (cal- ized COVID-19 patients from sepsis. A multi-omic set of 81 fea-
protectin), the acute phase proteins serum amyloid protein tures was discovered using SIMON (Tomic et al., 2021) (STAR
(SAA1) and protease inhibitor (SERPINA3), GM-CSF, and the Methods) (AUC = 0.85, 95% CI = 0.59–1), identifying specific
C-type lectin CLEC11A. When we compared the two clusters, differentially abundant genes, proteins (including FCN1 and
we found that membership of cluster two was associated with APCS as higher in COVID-19) and significant pathway enrich-
higher 28-day mortality (Figure 6H). ment for hematopoietic cell lineage and the renin-angiotensin
We validated the clusters in an independent acute hospitalized system (Figures S9D and S9E).
COVID-19 cohort assayed using a different technology, targeted
proteomics by Olink (Filbin et al., 2021) (STAR Methods). Clus- Integrated hallmarks of COVID-19 severity and
tering analysis, using 7 of the 11 predictive proteins for which specificity
data were available, identified two optimal clusters (Figures 6I). We sought to dissect the immune response to COVID-19 across
These showed a clear relationship with measures of disease all assay types using a multi-omics tensor approach (Chang et al.,
severity, including WHO ordinal score (maximum) (Figure 6I), 2021; Fanaee-T and Thoresen, 2019; Taguchi, 2017), specifically
and patients in cluster 1 had lower mortality at 28 days (5/ the sparse decomposition of arrays (SDA) algorithm (Hore et al.,
164 = 3.0%) compared with cluster 2 (33/105 = 31.4%) (Chi- 2016). We analyzed 152 samples assayed for cellular composi-
square test p < 0.0001), validating the findings from our discov- tion, gene expression, and plasma proteomics, and found 381
ery cohort. We extended the approach to include a combination latent SDA components, each comprising vectors of scores
of hospitalized COVID-19 and sepsis patients from COMBAT. (loadings) that indicate the contribution of individual cell types,
This revealed three clusters, two corresponding to the clusters genes, or proteins linked by that component, and thereby offering
seen with COVID-19 cases analyzed alone, indicating a high insights into shared mechanism (Figures 7C and 7D; Table S4;
level of specificity (Figures S8I and S8J). Features that separated STAR Methods). We identified components associated with spe-
COVID-19 and sepsis included lipocalin2 (LCN2) and CCL20, cific clinical covariates, severity, or patient group, noting that
which were elevated in sepsis, and CXCL10, APCS, and fibro- while in some instances e.g., gender, there was a single associ-
nectin (FN1), which were higher in COVID-19. ated component, typically several components were associated
(Figure S9F). The strongest association with COVID-19 severity
Supervised machine learning identifies predictive was for component 171 (Pc = 5.9x10¹⁴, rho = 0.74 Spearman)
protein biomarkers for disease severity (Figure 7E) which was unusual in having a high feature contribu-
We next used machine learning to combine the two proteomics tion from plasma proteins, whereas gene expression contributed
data types with whole blood total RNA-seq to determine which most to the majority of the other components (Figure S9G).
features were predictive of disease severity and their relative Contributing features to component 171 included raised plasma
informativeness (Figure S9A; STAR Methods). We first identified chemokines involved in chemotaxis and activation (CXCL8,
assay-type-specific informative components of variance to CXCL10, and CCL20) and GM-CSF together with acute phase
reduce dimensionality for a training sample set and then deter- activating proteins (SAA1/2 and SERPINA3), LRG1, and LBP;
mined which were most informative and the genes/proteins reduced abundance of intermediate monocytes; high expression
Figure 7. Integrative approaches define hallmarks of COVID-19 response
(A and B) Machine learning for COVID-19 severity showing average feature score of (A) highest-scoring features (principal components, PCs), and (B) final
feature set.
(C–I) Tensor and matrix decomposition across multi-omic datasets for 152 samples showing (C) approach; (D) clustering of COVID-19 associated components
(k-means clustering of row-scaled median sample loadings) and relationship with disease comparator groups; and (E–I) examples of components with sample
loading scores differing by comparator group showing features (cells, gene expression, proteins) with high posterior inclusion probability whose variance
contributes to that component; for gene expression, cell type and highest scoring genes listed (red upregulated, blue downregulated) together with top pathway
enrichment (FDR < 0.05) with pathway genes listed within bars (features shown or included in pathway analysis where posterior inclusion probability > 0.5).
(E) Component showing strongest association with COVID-19 severity.
(F) Components associated with different severities of COVID-19.
(G) COVID-19 specific component.
(H) Influenza and COVID-19 associated component.
(I) Hospitalized COVID-19 and influenza associated component.
All boxplots show median, first, and third quartiles; whiskers 1.5x interquartile range.
See Figure S9.
930 Cell 185, 916–938, March 3, 2022ll
Resource OPEN ACCESS
of cell stress chaperone CLU and methyltransferase METTL7B, DISCUSSION
and downregulation of IgE receptor and multiple HLA class II
genes; and pathway enrichment for antigen presentation, TCR Our comprehensive multimodal integrated approach, applied to
signaling, and asthma (Figure 7E). multiple well-defined cohorts, has identified blood hallmarks of
To further delineate COVID-19 associated SDA components, COVID-19 severity and specificity involving particular immune
we performed pairwise contrasts and analysis of variance cell populations and their development, components of innate
involving COVID-19 patient groups. Overall, 130 of 381 compo- and adaptive immunity, and connectivity with the inflammatory
nents were associated with COVID-19 versus healthy volunteers response (graphical abstract).
(Figures 7D and S9H). Components associated with mild and se- Identified hallmarks of severity involving myeloid related fea-
vere but not critical disease included component 256 (upregula- tures include emergency myelopoiesis, immature neutrophils,
tion of interferon response genes and downregulation of genes increased HSC, and platelet/CD34 megakaryocyte progenitors,
such as catalase and cytochrome c oxidase) which was specific with the latter associated with thromboembolism. These findings
to COVID-19 cases (Figure 7F); and component 42 (features of substantiate and add granularity to previous reports (Bernardes
monocyte/granulocyte proliferation and function, elevated et al., 2020; Stephenson et al., 2021). We find evidence ERG is
plasma proteins G-CSF, IL-2, IL-8, and IL-15, and enrichment central to a gene network linked to these populations, encoding
of cell division related pathways) (Figure S9I). A further compo- a transcription factor important in determining lineage plasticity,
nent strongly associated with severe disease involved plasma- modulating inflammation, and maintaining an anti-thrombotic
blast proliferation, combined with increased MThi cMono and a environment (Yuan et al., 2009). We further identify hallmarks sup-
clear DNA replication signature (component 289) (Figure 7F). porting the importance of mononuclear phagocyte dysfunction in
We found an innate response component specific to critical severe disease (Bost et al., 2021; Mann et al., 2020; Schulte-
COVID-19 (component 247) with differential expression of Schrepping et al., 2020), namely proliferating cMono, and specific
granulocyte activation marker (CEACAM8), neutrophil elastase monocyte populations showing reduced HLA-DR, CD33, and
(ELANE) and defensins (DEFA1B/4), and increased soluble CD11c expression, high expression of antioxidant metallothionein
CD163 scavenger protein levels, reflected in pathway enrich- and S100A8/9/12 (calprotectin), together with reduced pDCs.
ment for neutrophil functions (Figure 7F). Neutrophil related fea- Changes in the frequency of specific T cell subsets, and their
tures were also found in component 123 associated with COVID- activation and exhaustion, has been previously reported in se-
19 severity, influenza, and sepsis (Figure S9I). vere COVID-19 (Chen and John Wherry, 2020; Jouan et al.,
This approach also identified a further COVID-19 specific 2020; Parrot et al., 2020). We found increased numbers of acti-
component (187) with high loading scores in hospitalized and vated CD8+ T cells and NK cell populations in COVID-19, and,
community COVID-19 patients across NK, B, and T cells (Fig- with increasing severity, failure of clonal expansion in CD8+ T
ure 7G). This was driven by upregulation of key stress and acti- effector and central memory cells and depletion of COVID-19 clo-
vation response genes including immediate early response pro- notypes. We further found association with severity for exhaus-
tein (PMAIP1), AP-1 transcription factor genes FOS and JUN, the tion markers and specific activated NK and CD69+ MAIT cell pop-
early activation marker, tissue residency and metabolic reprog- ulations. In terms of adaptive immunity (Brouwer et al., 2020;
ramming gene CD69, and TNFAIP3, which limits NFkB mediated Galson et al., 2020), we find increased numbers of terminally
inflammation. The cytokine-induced STAT inhibitor (CISH) and differentiated plasmablasts, with expansion of unmutated B cells
immune checkpoint regulator of inflammation and metabolism differing in selection and tolerance, and a higher proportion of
TNFAIP8L2 were downregulated. Pathway enrichment was clonally related B cells. Persisting changes in cell composition
seen for type-2 inflammation (IL4 and IL13), TLR signaling, and were found in convalescent samples, including an increase in
the ATF-2 network. We additionally identified COVID-19 and activated CD4+ and CD8+ T cells and unswitched memory B cells
influenza-associated components (Figures 7H and 7I) including as well as reduced CD16CD56dim NK cells. These differences
widespread upregulation of immunoglobulin heavy/kappa/ were also seen in community cases when compared to healthy
lambda genes, JCHAIN (regulating multimerization and mucosal volunteers; upregulation of TNF signaling was a consistent
secretion of IgM/IgA), and MZB1 (involved in antibody secretion feature across cell populations in community cases. Redox state
and integrin-mediated cell adhesion) linking with possible anti- and cell cycle associate with more severe disease across cell
body-dependent cellular toxicity (component 6); and significant populations. Our data are also consistent with the importance
upregulation of interferon pathway genes (component 235). of the hyperinflammatory state (Moore and June, 2020) and inter-
Overall, the latent component analysis identifies hallmarks of feron response (Hadjadj et al., 2020; Lei et al., 2020) but as fea-
COVID-19 severity and specificity with respect to sepsis and tures of less critical disease and earlier phase of illness.
influenza. Our findings highlight key cellular populations such Our proteomic analysis identified plasma levels of specific cy-
as proliferating monocytes and plasmablasts, and features of tokines and chemokines as biomarkers of severe disease with
innate and adaptive mechanisms ranging from interferon evidence for acute phase response, complement activation/
signaling to myelopoiesis, immunoglobulin production, and attack, fibrin clots, proteases, serum amyloid, tissue necrosis,
stress activation response signaling. The results prioritize and receptor mediated endocytosis, and cholesterol transport as
validate hallmarks seen on individual modality analysis such as hallmarks. Moreover, we discovered plasma protein signatures
AP-1 and generate hypotheses for how hallmarks may be related that can be used to stratify acute hospitalized COVID-19 cases
in terms of pathophysiology based on co-occurrence in a given into disease sub-phenotypes not identified from WHO categori-
component. cal criteria, with cluster membership informative for response
Cell 185, 916–938, March 3, 2022 931You can also read