A Low-Prevalence Single-Nucleotide Polymorphism in the Sensor Kinase PhoR in Mycobacterium tuberculosis Suppresses Its Autophosphatase Activity ...
←
→
Page content transcription
If your browser does not render page correctly, please read the page content below

ORIGINAL RESEARCH
                                                                                                                                               published: 25 August 2021
                                                                                                                                         doi: 10.3389/fmicb.2021.724482

                                             A Low-Prevalence Single-Nucleotide
                                             Polymorphism in the Sensor Kinase
                                             PhoR in Mycobacterium tuberculosis
                                             Suppresses Its Autophosphatase
                                             Activity and Reduces Pathogenic
                                             Fitness: Implications in Evolutionary
                                             Selection
                                             Uchenna Watson Waturuocha 1,2 , M. S. Krishna 1 , Vandana Malhotra 3 , Narendra M. Dixit 4,5
                                             and Deepak Kumar Saini 2,5*
                                             1
                                               Department of Studies in Zoology, University of Mysore, Mysore, India, 2 Department of Molecular Reproduction
                                             Development and Genetics, Indian Institute of Science, Bengaluru, India, 3 Sri Venkateswara College, University of Delhi,
                                             New Delhi, India, 4 Department of Chemical Engineering, Indian Institute of Science, Bengaluru, India, 5 Center
                            Edited by:
                                             for Biosystems Science and Engineering, Indian Institute of Science, Bengaluru, India
                        George Grant,
               University of Aberdeen,
                      United Kingdom         The genome sequencing of Mycobacterium tuberculosis, the causative organism of
                       Reviewed by:          tuberculosis, has significantly improved our understanding of the mechanisms that
                Amanda Jane Gibson,
               Aberystwyth University,
                                             drive the establishment of infection and disease progression. Several clinical strains
                     United Kingdom          of M. tuberculosis exhibit single-nucleotide polymorphisms (SNPs), the implications
            Roberto Zenteno-Cuevas,
                                             of which are only beginning to be understood. Here, we examined the impact of
     Universidad Veracruzana, Mexico
                                             a specific polymorphism in PhoR, the sensor kinase of the PhoPR two-component
                  *Correspondence:
                 Deepak Kumar Saini          system. Biochemical analysis revealed reduced autophosphatase/ATPase activity, which
                deepaksaini@iisc.ac.in       led to enhanced downstream gene expression. We complemented M. tuberculosis
                                             H37Ra with the wild-type and mutant phoPR genes and characterized the strains in
                    Specialty section:
         This article was submitted to       a cell line infection model. We provide an explanation for the low prevalence of the
                   Infectious Diseases,      SNP in clinical strains (∼1%), as the mutation causes a survival disadvantage in the
               a section of the journal
             Frontiers in Microbiology       host cells. The study provides a rare example of selection of a signaling node under
           Received: 13 June 2021            competing evolutionary forces, wherein a biochemically superior mutation aids bacterial
           Accepted: 30 July 2021            adaptation within-host but has low fitness for infection and hence is not selected. Our
         Published: 25 August 2021
                                             study highlights the importance of accounting for such SNPs to test therapeutic and
                              Citation:
                                             co-therapeutic methods to combat TB.
        Waturuocha UW, Krishna MS,
   Malhotra V, Dixit NM and Saini DK         Keywords: single-nucleotide polymorphism, two-component system, histidine kinase, Mycobacterium
              (2021) A Low-Prevalence        tuberculosis, evolutionary fitness, bacterial signal transduction, PhoR
  Single-Nucleotide Polymorphism in
               the Sensor Kinase PhoR
       in Mycobacterium tuberculosis
     Suppresses Its Autophosphatase
                                            INTRODUCTION
     Activity and Reduces Pathogenic
  Fitness: Implications in Evolutionary
                                            Sequencing of Mycobacterium tuberculosis H37Rv genome, a virulent laboratory strain, has
                             Selection.     revolutionized the research done on this pathogen world over (Cole et al., 1998). It revealed
          Front. Microbiol. 12:724482.      the presence of sizeable unknown gene sets, like serine–threonine protein kinases (STPKs) and
    doi: 10.3389/fmicb.2021.724482          other relatively small groups of typical bacterial signaling systems, the two-component systems

Frontiers in Microbiology | www.frontiersin.org                                     1                                           August 2021 | Volume 12 | Article 724482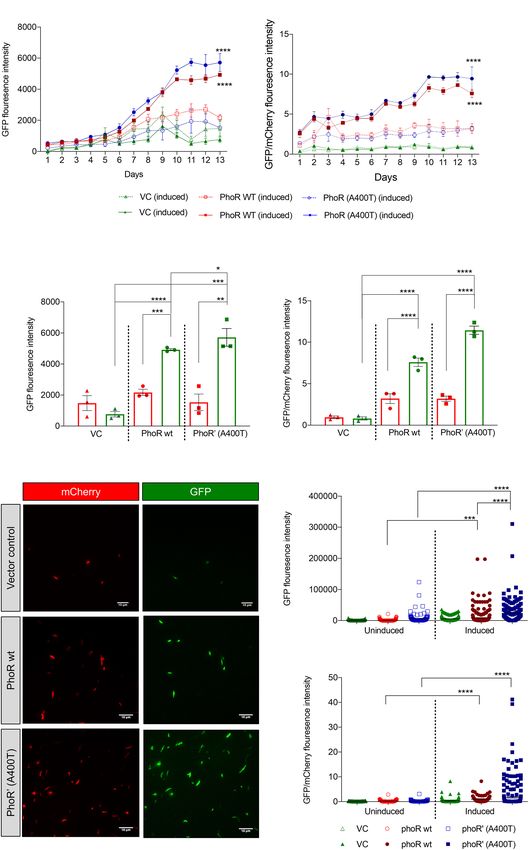
Waturuocha et al.                                                                           PhoR Signaling in Clinical Strains of Mycobacterium tuberculosis

(TCSs). Over the years, a large number of virulent clinical                   (Ioerger et al., 2010). This includes the adaptation of H37Rv
strains, non-human pathogenic strains, and non-pathogenic                     to laboratory conditions while remaining virulent in mice
mycobacterial strains have been sequenced, aimed at unraveling                (Ioerger et al., 2010). It is believed that there are hot spots
what makes M. tuberculosis such a successful pathogen (Cole                   for insertions/duplications, deletions, or substitutions across the
et al., 1998; Garnier et al., 2003; Zheng et al., 2008; Ioerger et al.,       M. tuberculosis genome. Variants have also been observed in
2010; Tekwu et al., 2014; Mohan et al., 2015; Manson et al., 2017;            highly conserved TCS regions, such as a SNP in the DNA-binding
Borrell et al., 2019). The findings have revealed many differences;           domain of the phoP RR that attenuates the H37Ra strain (Wang
however, their contribution toward pathogenicity is not clear                 et al., 2007; Chesne-Seck et al., 2008; Lee et al., 2008) and an
(Ioerger et al., 2010).                                                       SNP in the SK phoR, which shows functional and phenotypic
    Given the pathogenic nature of M. tuberculosis, it is expected            changes in the clinical strain CDC1551 when compared with
to face adverse environments within its host (Chai et al., 2018). To          H37Rv (Schreuder et al., 2015), and yet another SNP in the phoR
adapt and survive in changing environmental conditions, it uses               region of the M. bovis strain, which leads to pleiotropic changes
signaling systems called TCSs, which regulate the expression of               in the production and secretion of lipids and affects virulence
many genes in response to various environmental stimuli (Pang                 (Gonzalo-Asensio et al., 2014).
et al., 2007). TCSs are typically composed of a sensor kinase                    In the present study, we examined the role of one
(SK) as the first component that senses the external stimulus                 such polymorphism in the PhoR SK and its effect on
and undergoes activation by an autophosphorylation event at                   mycobacterial signaling, virulence, and pathogenicity. Our
a specific histidine (His) residue. The second component of                   findings demonstrate that the mutation enhanced the catalytic
a TCS is a response regulator (RR), which the SK activates                    activity of the SK in both in vitro and in vivo conditions.
by a unique phosphotransfer event on a conserved aspartate                    The presence of the SNP in three of the 242 clinical strains
(Asp) residue (Stock et al., 2000; Bourret and Silversmith, 2010).            examined suggests a poor evolutionary selection of this variant.
The RRs are DNA-binding transcription factors that activate or                We hypothesize that the mutant TCS is primed early and
repress the transcription of downstream genes and bring about                 activates higher gene expression upon sensing of stimuli, leading
adaptive changes in the bacterium. Among the 12 pairs of TCSs                 to impaired survival of the mutation carrying bacilli during
in M. tuberculosis, the PhoPR TCS is extensively studied and                  infection. This could explain the poor selection of the SNP in the
implicated in regulating various processes, such as virulence                 wild. Overall, this study presents an example of the evolutionary
and growth upon infection (Pérez et al., 2001; Walters et al.,                benefits of temporally tuned signaling activity and suggests that
2006; Ryndak et al., 2014), lipid biosynthesis (Walters et al.,               similar competing forces may be at play with other TCSs.
2006), hypoxia (Vashist et al., 2018), pH sensing, and adaptation
(Johnson et al., 2015). It is known to regulate the expression
of about 2% of the M. tuberculosis genome (Cimino et al.,                     MATERIALS AND METHODS
2012). It is essential for survival and multiplication within
macrophages (Ludwiczak et al., 2002), and thus, this operon                   Chemicals, media, biochemicals, and protein reagents were
has been considered to be a master regulator in M. tuberculosis               obtained from Merck (Kenilworth, NJ, United States); protein
(Ryndak et al., 2008). We analyzed the sequences of several                   marker was from Abcam (Cambridge, United Kingdom).
clinical strains and sought single-nucleotide polymorphisms                   Restriction enzymes were from Thermo Fisher Scientific
(SNPs) primarily in TCS genes to understand the evolutionary                  (Waltham, MA, United States). Cloning and qRT primers were
pressures subjected to TCSs.                                                  synthesized by Bioserve (Hyderabad, India); radioactive γ32 P
    Comparative sequence analysis of strains from various                     ATP (>4,000 Ci/mmol) was from BRIT-Jonaki (Hyderabad,
lineages of M. tuberculosis sensu stricto (L1–L4 and L7) and                  India); fetal bovine serum (FBS) from Thermo Fisher Scientific
Mycobacterium africanum (L5 and L6), which belong to the                      (United States); TRIzol from TaKaRa (Seoul, South Korea); 0.1-
human-adapted M. tuberculosis complex, that diverged from                     mm zirconia beads from BioSpec Products Inc., (Bartlesville,
strains that infect animals and now cause the disease in humans               OK, United States); iScript cDNA synthesis kit from Bio-Rad
(Comas et al., 2014), and Mycobacterium bovis, revealed close                 Laboratories (Hercules, CA, United States); DyNAmo Color
to ∼2,000 SNPs. These polymorphisms could be responsible for                  Flash SYBR Green qPCR Kit from Thermo Fisher Scientific
the physiological differences between them. Genomic differences               (United States); THP-1 monocyte cell line and H460 epithelial cell
among clinical strains have been associated with variations in                line from ATCC (Manassas, VA, United States); and H37Ra strain
protein and metabolite levels, post-translational modifications               of M. tuberculosis from lab collection.
(Liu et al., 2014), drug susceptibility (Rouse et al., 1995),
transcriptome (Homolka et al., 2010; Rose et al., 2013), and cell             In silico Sequence Analysis
wall structure (Coscolla and Gagneux, 2014), along with virulence             The sequences of 19 clinical isolates from India, reported as
and infectivity. It is also observed that strains that have evolved           part of a previous study (Ramaiah et al., 2019), along with 223
more recently are more infectious, grow faster, and have lesser               sequences from BioProject PRJNA235851 (Manson et al., 2017),
latency than their parental strains (Borrell et al., 2019).                   were analyzed and aligned using T-COFFEE and CLUSTALW
    A recent study showed that variations because of the passaging            (Madeira et al., 2019) using the phoR gene sequence from
of laboratory strains used as reference pathogenic strains had                H37Rv strain as a template. A variation from gcc to acc at
impeded our understanding of the mycobacterial pathology                      the 1,198 nucleotide of phoR gene was identified and named

Frontiers in Microbiology | www.frontiersin.org                           2                                       August 2021 | Volume 12 | Article 724482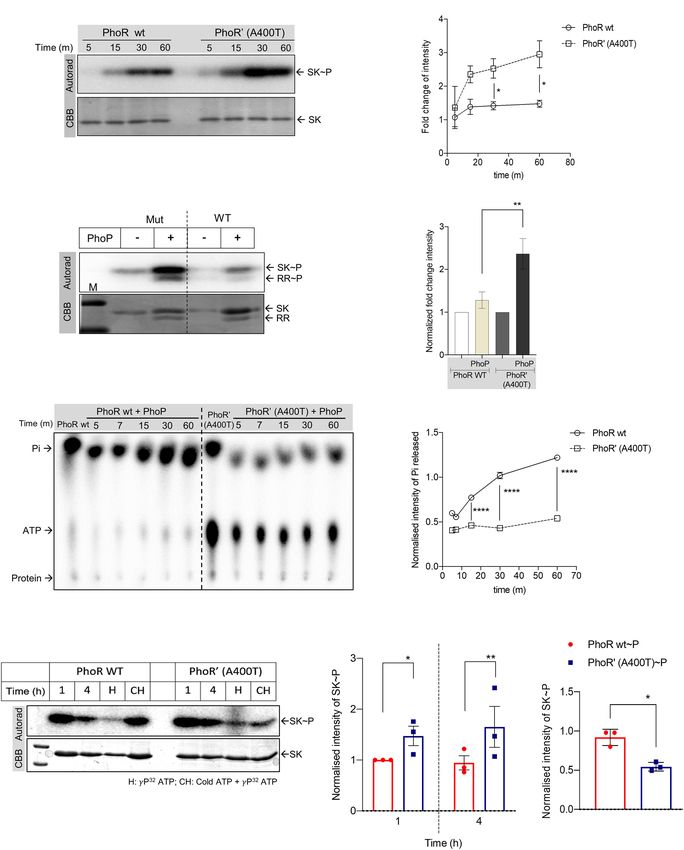
Waturuocha et al.                                                                     PhoR Signaling in Clinical Strains of Mycobacterium tuberculosis

PhoR’ (A400T). The global frequency of the SNP was tested in            eluted out with elution buffer (25 mM of Tris–Cl, pH 8.0, 500 mM
the GMTV database (Genome-Wide M. tuberculosis Variation                of NaCl, 250 mM of imidazole, and 10% glycerol).
database)1 (Chernyaeva et al., 2014).

Phylogenetic Tree Construction                                          Dialysis and Storage of Purified Proteins
                                                                        The eluted fractions of the proteins with the highest yield
The sequence alignment of PhoR gene was used to generate
                                                                        determined by Bradford assay were pooled together and dialyzed
a radial phylogenetic tree using the maximum-likelihood
                                                                        against dialysis buffer I (50 mM of Tris–Cl, pH 8.0, 50 mM of
method based on the Tamura–Nei model by MEGA. Bootstrap
                                                                        NaCl, 1 mM of DTT, and 10% glycerol) for 6–12 h and then with
analysis was performed with 500 replicates, with all sites being
                                                                        dialysis buffer II or storage buffer (50 mM of Tris–Cl, pH 8.0,
informative and without gaps (38).
                                                                        50 mM of NaCl, 0.1 mM of DTT, and 50% glycerol) overnight.
                                                                        The concentration of the purified proteins after dialysis was
Recombinant Plasmid Construction and                                    determined by Bradford assay using bovine serum albumin (BSA)
Generation of Bacterial Strains                                         as standard. The purity of the proteins was checked on sodium
Cloning and overexpression of proteins were carried out in              dodecyl sulfate–polyacrylamide gel electrophoresis (SDS-PAGE)
Escherichia coli strains DH10β and BL21 Arctic ExpressTM                and stored at −20◦ C.
(Agilent Technologies, Santa Clara, CA, United States) grown
in LB medium with 100 µg/ml of ampicillin or 50 µg/ml of
gentamycin, respectively. Primers used for PCR and cloning              Circular Dichroism Spectroscopy
are listed in Supplementary Table 1. Recombinant plasmids               PhoR wt and PhoR’ (A400T) proteins were subjected to circular
used for protein overexpression are reported previously (Agrawal        dichroism spectroscopy using JASCO J-810 Spectropolarimeter.
et al., 2015). For generating mycobacterial expression plasmid          Spectra for SK protein (in 1 × PBS) were analyzed between
containing the PhoPR operon with its native promoter, the               wavelength 190 and 300 nm to record protein secondary
nucleotide region of the phoPR operon, along with a 500-bp              structures. The K2D3 software was used to analyze the plots.
upstream region, was PCR-amplified from H37Rv genomic DNA
using specific primers. The amplicon was cloned in pCV125               Phosphorylation Assays
vector, a mycobacterial single copy, and integrative expression         Autophosphorylation assays were performed as described
vector with kanamycin resistance marker, at NdeI and HindIII            previously (Agrawal et al., 2015). Briefly, 50 pmol of the purified
restriction sites. The recombinant constructs generated were            SKs [PhoR wt and PhoR’ (A400T)] were autophosphorylated
verified by DNA sequencing.                                             in kinase buffer (50 mM of Tris–Cl (pH 8.0), 50 mM of
                                                                        KCl, and 20 mM of MgCl2 ), 100 µM of ATP, and 2 µCi
Expression and Purification of                                          of γ32 P-ATP (>4,000 Ci/mmol) for 60 min at 30◦ C. The
Recombinant Proteins                                                    reaction was terminated using a 1 × SDS-PAGE buffer and
The recombinant proteins were expressed and purified, as                resolved on a 12.5% SDS-PAGE gel. The gels were washed and
reported previously (Saini et al., 2002). In brief, E. coli cells       exposed to a phosphor screen (Fujifilm, Tokyo, Japan), followed
containing expression plasmids for the SK and RR proteins               by imaging with Typhoon phosphorimager (GE Healthcare,
were grown at 37◦ C in 200 ml of Terrific broth (TB) to an              Chicago, IL, United States). Images were adjusted for brightness
OD600 > 1.0 followed by induction with IPTG (0.1–1.0 mM).               and contrast with the Microsoft image editing tool, and
The culture was further grown for 15–20 h at 10◦ C–13◦ C for            quantitative densitometric analysis of the autoradiograms was
protein expression. Cells were harvested by centrifugation, and         done using ImageJ software. The first time point’s signal
soluble 6 × His-tagged proteins were purified using Ni+2 -NTA,          was considered 100%, and relative levels of phosphorylation
as described previously (34). The pellets were resuspended in           over time with the wild-type (WT) and mutant SKs were
native lysis buffer (50 mM of Tris–Cl, pH 8, 300 mM of NaCl,            determined to quantify the effects of the mutation. For statistical
and 10% glycerol) with 1 mM of phenylmethylsulfonyl fluoride            analysis, significance (p-values) were calculated regarding SK∼P
(PMSF) and 1 mM of benzamidine and sonicated on ice for                 levels in the autophosphorylation reaction. In the case of the
5–10 min at 25% amplitude (pulse on 3 s, pulse off 2 s). The            autophosphorylation of the SK in the presence of the PhoR
lysate was centrifuged at 14,000 g for 30 min at 4◦ C. The              inhibitor, ethoxzolamide (ETZ) (Johnson et al., 2015), the
supernatant containing the protein was passed through the Ni+2 -        WT and mutant SKs were incubated for 2 h with increasing
NTA column for about 120 min with intermittent shaking on               concentrations of the inhibitor in kinase buffer (described above)
a pre-equilibrated with native lysis buffer at 4◦ C for 15 min.         at 30◦ C. The reaction was terminated using a 1 × SDS-PAGE
The unbound proteins were discarded as flow-through, and the            loading buffer, loaded on an SDS-PAGE gel, and processed as
column was washed with wash buffer A (25 mM of Tris–Cl, pH              described above. In the phosphotransfer assay, 150 pmol of the
8.0, 500 mM of NaCl, 25 mM of imidazole, and 10% glycerol)              RR diluted in kinase buffer was added to the autophosphorylation
and wash buffer B (25 mM of Tris–Cl, pH 8.0, 500 mM of NaCl,            reaction, containing 50 pmol of phosphorylated SK (for 60 min)
50 mM of imidazole, and 10% glycerol). The bound protein was            and incubated for 60 min, and the reaction was terminated using
                                                                        a 1 × SDS-PAGE loading buffer. The samples were loaded on an
1
    https://mtb.dobzhanskycenter.org                                    SDS-PAGE gel and processed as described above.

Frontiers in Microbiology | www.frontiersin.org                     3                                       August 2021 | Volume 12 | Article 724482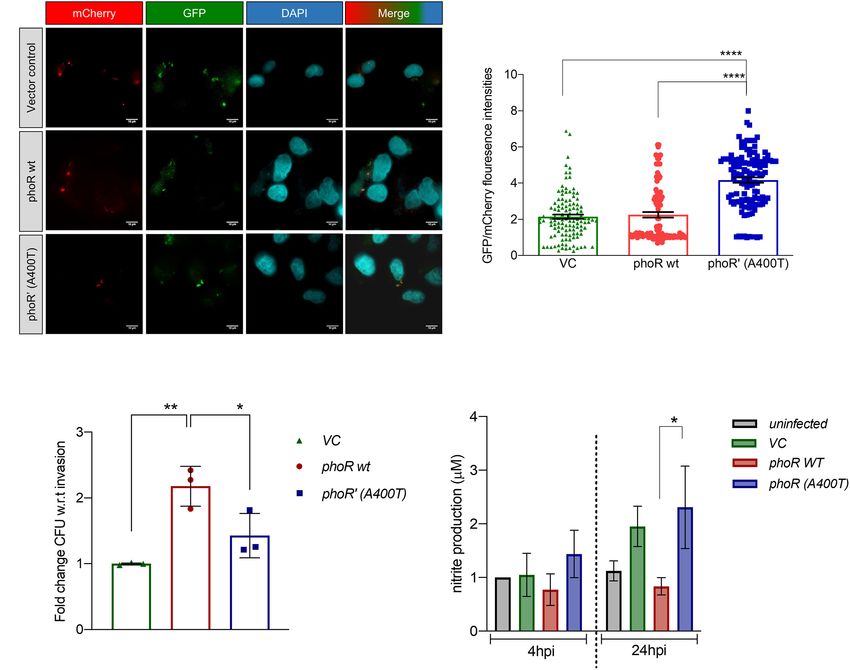
Waturuocha et al.                                                                       PhoR Signaling in Clinical Strains of Mycobacterium tuberculosis

ATP Hydrolysis and 32 IP Release Assay                                    infection experiments (below), for in cellulo analysis, H460 lung
                                                                          epithelial cell line (ATCC) was infected at a multiplicity of
by Thin-Layer Chromatography                                              infection (MOI) of 1:10; infected cells were fixed and imaged
In the phosphotransfer reaction, 150 pmol of the RR diluted               at 4 h post-infection using the Olympus IX83 fluorescence
in kinase buffer was added to the autophosphorylation reaction            microscope to measure the relative GFP by mCherry ratios from
of 10 µl volume, containing 50 pmol of phosphorylated SK,                 the infected bacilli.
for the indicated times. The reaction was terminated using
50 mM of EDTA. The amounts of labeled 32 P released and
residual ATP in the reaction were determined by thin-layer                RNA Extraction and Quantitative Gene
chromatography (TLC) on polyethyleneimine-cellulose plates                Expression Analysis
using 2 M of HCOOH and 2 M of LiCl (2:1) as the mobile phase;             Cultures of M. tuberculosis H37Ra containing either the pCV125
the dried plates were exposed to a phosphor screen and scanned            empty vector backbone alone or either the WT or mutant
with Typhoon phosphorimager. A quantitative comparison for                phoPR construct were grown exponentially to an OD600 of 0.8
the amount of 32 iP released was made by normalizing the later            and harvested. For acid induction experiments, cultures were
time points in the presence of the RR to the 32 iP generated              grown in 10 ml of 7H9 buffered to pH 5.5 (using HCl) for
by the SK alone.                                                          induced cultures and pH 7.4 for uninduced cultures. The pellets
                                                                          were resuspended in QIAzol Lysis reagent (Qiagen, Hilden,
Electrophoretic Mobility Shift Assay                                      Germany), mixed with zirconia silica beads, and disrupted using
A 500-bp region corresponding to the aprA promoter region                 a mini bead beater, following which RNA was precipitated
was PCR-amplified from M. tuberculosis H37Rv genomic DNA                  using ethanol. The RNA obtained with OD260 /OD280 ratios ≥ 2
template using specific primers (Supplementary Table 1).                  was treated with DNaseI, and 500 ng of the total RNA was
The PCR products were purified and end-labeled with γ32 P-                reverse transcribed using random hexamers and iScript reverse
phosphate using T4 polynucleotide kinase (Thermo Fisher                   transcriptase (Bio-Rad, United States) as per the manufacturer’s
Scientific, United States) as per the manufacturer’s protocol. The        protocol. Gene-specific qRT-PCR was performed using DyNAmo
labeled fragments were purified and used for electrophoretic              Color Flash SYBR Green qPCR Kit (Thermo Fisher Scientific,
mobility shift assay (EMSA), by incubating with the indicated             United States) in Roto-GeneQ cycler (Qiagen, Germany), using
amount of PhoP protein for 45 min at 25◦ C in the binding                 0.5 µl of the cDNA synthesized per 10-µl reaction with primers
buffer (25 mM of Tris–Cl, pH 8.0, 20 mM of KCl, 6 mM                      from previously published studies as indicated in Supplementary
of MgCl2 , 0.10 mg/ml of BSA, 0.5% glycerol, 1 mM of DTT,                 Table 1. The calculated threshold cycle (Ct) value for each gene
0.5 mM of EDTA, and 1 µg of poly dI.dC). SK proteins were                 was normalized to 16S rRNA followed by that of the gene of
autophosphorylated with 5 mM of ATP and incubated with                    interest in the strain containing vector-only to determine fold
PhoP to obtain PhoP∼P. The reaction mixtures were resolved                change. The expression analyses were performed using three
on a 4% native polyacrylamide gel (29.5:0.5) and pre-equilibrated         independent biological replicates.
for 1–2 h at 80 V in 0.5 × Tris–borate EDTA buffer at 4◦ C.
Electrophoresis was performed at 4◦ C at 80 V for 2–3 h. The              Macrophage Cell Line Infections
DNA–protein complexes were visualized by phosphorimaging, as              Infection experiments were performed as previously described
described above.                                                          (Estrella et al., 2011). Briefly, THP-1 monocytes (ATCC)
                                                                          differentiated into macrophages with 20 nM of phorbol 12-
Analysis of aprA Promoter-Reporter                                        myristate-13-acetate were infected at an MOI of 1:10 with the
Activity                                                                  three strains of H37Ra (pCV125 empty vector backbone alone or
Cultures of M. tuberculosis H37Ra containing either the pCV125            the WT or mutant phoPR construct). The bacteria were allowed
empty vector or the WT or mutant phoPR construct were                     to infect cells for 4 h (taken as the time point of invasion), after
electroporated with the aprA’:GFP, smyc’:mCherry (obtained as             which cells were washed with PBS thrice and either lysed with
a kind gift from Prof. R. Abramovitch, United States) promoter-           Triton X-100 and plated after serial dilutions on Middlebrook
reporter construct (Abramovitch et al., 2011). The strains were           7H11-OADC plates for colony enumeration or replenished with
grown in 10 ml of 7H9 media buffered to pH 5.5 for induction              fresh antibiotic-free Roswell Park Memorial Institute (RPMI)
and kept at pH 7.4 for uninduced conditions with an initial OD600         medium to be lysed and plated at a later time point as indicated.
of 0.05 for 12 days for PhoR activation experiments. At each time         In the experiments with PhoR inhibitor, cells were pretreated
point, samples from each culture were taken in a 96-well flat black       with 80 µg ETZ, which was replenished every 2 days (wherever
clear-bottom plate (Corning Inc., New York, NY, United States).           needed), and equal volumes of DMSO was added to untreated
Green fluorescent protein (GFP) and mCherry fluorescence                  cells, followed by lysing of the cells and plating as described
ratios were measured using the Tecan Infinite M1000 plate                 above. This was repeated to obtain three biological replicates
reader (Tecan, Grödig, Austria) in duplicates along with OD600 .          (Johnson et al., 2015).
On the 12th day, cultures were fixed in 4% paraformaldehyde
and mounted on glass slides in 10% glycerol. The relative                 Measurement of Nitrite Production
fluorescence for ∼300 bacilli from each sample was quantified             The nitrite produced by infected THP-1 cells was measured
by microscopy analysis from three individual experiments. In              as described previously using the Griess reagent (37). Briefly,

Frontiers in Microbiology | www.frontiersin.org                       4                                       August 2021 | Volume 12 | Article 724482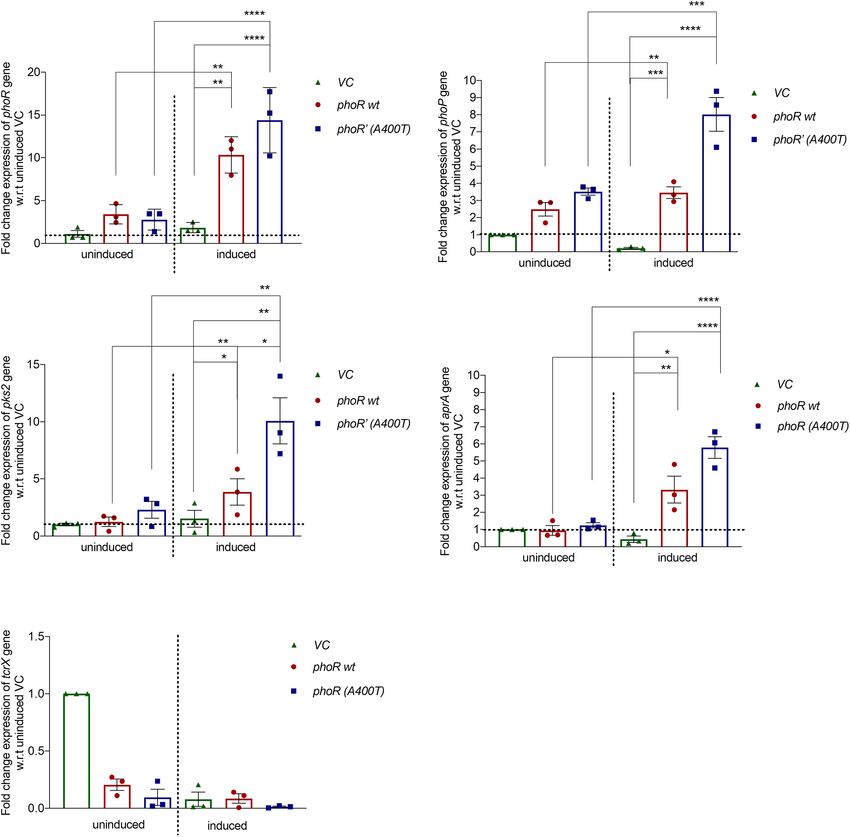
Waturuocha et al.                                                                        PhoR Signaling in Clinical Strains of Mycobacterium tuberculosis

the supernatants of uninfected and infected cells were collected           SK PhoR (Figure 1C) revealed no particular hot spots for any
at indicated time points and then incubated with the Griess                SNPs in the gene.
reagent in a 1:1 proportion at room temperature for 10 min, and               Interestingly, other TCSs in these strains have SNPs in the
the absorbance was measured at 540 nm in the Tecan Infinite                various regions with varied frequencies (Figure 1D). The low
M1000 plate reader. The nitrite concentration was determined               frequency of the mutation in our study and absence in the GMTV
using a standard curve plotted with different sodium nitrite               database made us explore the changes brought about by this
concentrations and represented as µM/105 cells per well, and               mutation A400T on the catalytic activities of the SK PhoR.
normalized to the uninfected 4-h time point of invasion and
blanked with the cell-free medium. This was performed to get
three biological replicates, and p-values (statistical significance)       A400T Substitution in the Kinase Domain
were calculated the Mann–Whitney test.                                     Alters PhoR Phosphatase Activity in vitro
                                                                           We introduced the mutation in the cytosolic C-terminal domain
Statistical Analyses                                                       of the SK protein PhoR (Agrawal et al., 2015) by site-directed
Statistical analyses for significance were performed using                 mutagenesis and purified both WT and mutant proteins.
Student’s t-test, one-way ANOVA test, and two-way ANOVA test               Predicted structure analysis of the HATPase and kinase domain
(for time-course experiments) between control and experimental             of the WT and mutant protein revealed no major structural
sets and induced and uninduced sets (wherever applicable). For             differences (Supplementary Figure 2A), and circular dichroism
all experiments, the number of independent biological replicates           analysis also revealed no structural perturbations between the
used is indicated by “n.”                                                  purified proteins (Supplementary Figure 2B), allowing us to
                                                                           proceed with biochemical analysis of the mutant protein. We
                                                                           performed autophosphorylation analysis for the WT and mutant
RESULTS                                                                    SK proteins. The proteins were incubated with γ32 P-labeled ATP,
                                                                           and their phosphorylation status was examined. We observed
Clinical isolates of M. tuberculosis harbor several SNPs leading to        enhanced autophosphorylation for the mutant compared with
variations in their sequences compared with laboratory strains.            the WT PhoR protein at all time points (Figures 2A,B). Next,
Although the changes brought about by sequence variations                  we examined the ability of the phosphorylated WT and mutant
in various bacterial genome regions have been characterized                SKs to transfer the phosphoryl moiety to the RR protein PhoP.
previously, TCS regions have seldom been studied. To check                 A stable and higher phosphotransfer was observed with the
the effect of such polymorphisms on the signaling and the                  mutant PhoR’ (A400T) protein (Figure 2C), and on quantitation,
interactions between the bacterium and its host, we analyzed the           the amount of RR∼P was also detected to be higher (Figure 2D).
gene sequence of the phoPR TCS.                                                The faint signal on the WT PhoR (Figure 2C, right) suggested
                                                                           an inherent phosphatase activity in the PhoR SK, which seems
An Single-Nucleotide Polymorphism in                                       to be reduced in mutant SK as well as in the presence of RR
                                                                           PhoP. While the presence of a phosphatase activity in SK toward
the HATPase Domain of the Sensor                                           RR∼P is widely reported and is attributed to the DHp domain
Kinase PhoR Is Found in Some Clinical                                      (Xing et al., 2017), the presence of an autophosphatase activity
Strains of Mycobacterium tuberculosis                                      of SK is rarely reported (Dubey et al., 2016). Such an activity
We analyzed the sequence of phoR in 242 mycobacterial                      would result in dephosphorylation of the SK∼P, releasing free
strains from BioProject PRJNA235851 in National Center for                 32 iP. We measured the concentration of 32 iP species released

Biotechnology Information (NCBI) (Ramaiah et al., 2019)                    through TLC analysis by incubating phosphorylated WT or
with a combination of drug-sensitive/resistant, polydrug- and              the mutant SK in the presence or absence of the RR PhoP.
multidrug-resistant cohort of a South Indian population                    The intensities were normalized to those with SK alone, and
(Ramaiah et al., 2019) with H37Rv as the reference sequence                the relative 32 iP and ATP signal intensities of the spots at
to identify various SNPs, and we found one that translated                 various time points were noted in the presence of the RR PhoP.
into a non-synonymous, missense mutation in the protein. This              Figure 2E (lanes 1 and 7) indicates two things: first, both proteins
SNP changed alanine to threonine residue (A400T) at the 400th              have an ATPase or autophosphatase activity, as evidenced by
position, in the HATPase domain (Figures 1A,B). The SNP was                the amount of 32 iP released; and second, the mutant kinase
found in only three strains of the genome sequences analyzed               exhibited a reduced auto-dephosphorylation ability compared
from the cohort (Figure 1A). A schematic phylogenetic tree                 with the WT protein.
drawn with the PhoR sequence alignment, for the genomes                        We concomitantly recorded higher levels of residual ATP for
analyzed, shows that the strains with the mutation A400T group             the mutant PhoR’ (A400T) protein (Figure 2E, right panel; lanes
separated from the rest of the strains (Supplementary Figure 1).           7–12), compared with the WT kinase (Figure 2E, left panel; lanes
We also analyzed the genome sequence repository database                   1–6). Figure 2F shows a significant reduction in the amount
GMTV, which consists of 2,501 clinical genome sequences that               and rate of 32 iP released for the mutant protein. Taken together,
have been aligned for mutations in different regions of the                the data indicate that the mutant SK PhoR’ (A400T) protein is
bacteria; however, this particular SNP was not reported there.             catalytically more active than the WT PhoR by virtue of stable
Subsequent analyses of the frequencies of other SNPs in the                phosphotransfer and a decreased phosphatase activity.

Frontiers in Microbiology | www.frontiersin.org                        5                                       August 2021 | Volume 12 | Article 724482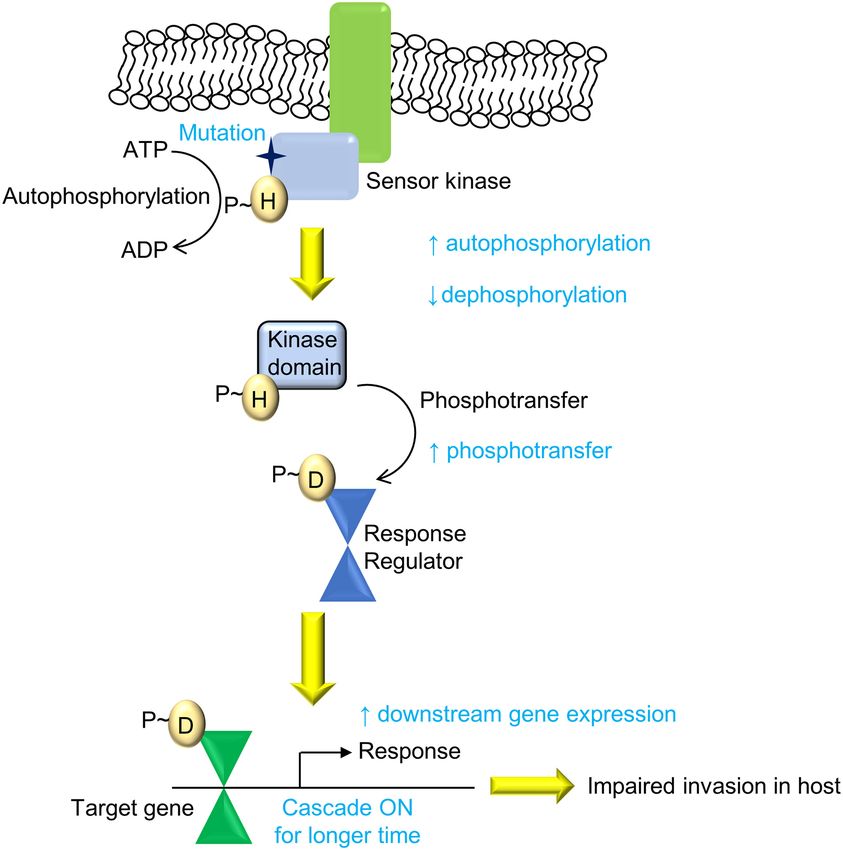
Waturuocha et al.                                                                                    PhoR Signaling in Clinical Strains of Mycobacterium tuberculosis

  FIGURE 1 | Single-nucleotide polymorphisms (SNPs) in the sensor kinase PhoR and other two-component systems (TCSs) in the clinical strains of Mycobacterium
  tuberculosis. (A) Sequence alignment of the sensor kinase (SK) protein PhoR, with H37Rv as the reference strain aligned with H37Ra and three clinical strains.
  HATPase domain is marked in blue with the mutation from alanine to threonine at 400 marked in green. CS25, CS21, and CS223 are the numbers assigned to three
  of the 223 clinical strains that carry this mutation analyzed in this study. (B) Pfam analysis of the SK protein PhoR from H37Rv, depicting the presence of three
  distinct domains, the HAMP domain (amino acids 178–231), the histidine kinase (HK) domain (amino acids 249–313), and the HATPase domain (amino acids
  358–468). The predicted transmembrane domains are depicted to the left of these domains. The black triangle marks the mutation in the HATPase domain, and the
  pink diamond marks His259 , the phosphorylation site. (C) Table showing the frequencies of synonymous and non-synonymous SNPs in various TCS proteins wrt
  H37Rv as reference genome reported in the GMTV database. (D) Table showing the frequencies of SNPs that are found in the PhoR sensor kinase in GMTV
  database and PRJNA235851 database.

Frontiers in Microbiology | www.frontiersin.org                                  6                                          August 2021 | Volume 12 | Article 724482
Waturuocha et al.                                     PhoR Signaling in Clinical Strains of Mycobacterium tuberculosis

  FIGURE 2 | Continued

Frontiers in Microbiology | www.frontiersin.org   7                         August 2021 | Volume 12 | Article 724482
Waturuocha et al.                                                                                       PhoR Signaling in Clinical Strains of Mycobacterium tuberculosis

  FIGURE 2 | Analysis of the impact of A400T single-nucleotide polymorphism
                                                                                          SK∼P. As expected, the mutant showed a higher signal
  (SNP) on the biochemical activities of the sensor kinase PhoR.                          than the WT, indicating that the mutant retains a higher
  (A) Autophosphorylation time-course analysis. The assay was performed                   phosphoryl signal.
  using wild-type (left) and mutated PhoR’ A400T (right) for indicated time                   In a parallel reaction aimed to examine phosphoryl group
  points. Top panel, autoradiogram; bottom, Coomassie Brilliant Blue                      turnover, the SKs were first incubated with cold ATP for 2 h,
  (CBB)-stained gel. (B) Quantitative measurement of autophosphorylated
  wild-type or mutated PhoR proteins at various time points as shown in panel
                                                                                          followed by the addition of 32 P labeled ATP for two additional
  (A). The signal recorded for both wild-type and mutant proteins at the first            hours (hot-chase analysis). This experiment’s premise was that
  time point was taken as 1, and the rest of the time points were normalized to           the protein that possesses higher ATP turnover would be labeled
  it (n = 3). (C) Phosphotransfer analysis to analyze the effect of the mutation in       more with the 32 P in step 2. In agreement with the observations
  the sensor kinase (SK) PhoR. The assay was performed using mutated (left) or
                                                                                          above, we recorded higher labeling for WT PhoR protein,
  wild-type PhoR (right) with wild-type response regulator (RR) protein PhoP.
  Top panel, autoradiogram; bottom panel, CBB-stained gel. (D) Quantitative
                                                                                          confirming that the mutant PhoR has a reduced autophosphatase
  analysis of signals of phosphorylated wild-type PhoR and mutated PhoR’                  activity (Figure 2G, lanes 4 and 9; and Figure 2I).
  A400T protein at 1-h post-phosphotransfer. The signal recorded for wild-type
  and mutant proteins without RR was taken as 1, and the signal in the                    PhoR’ A400T Enhances the DNA-Binding
  presence of RR at various time points was normalized to it. (E) Thin-layer
  chromatography (TLC) analysis of phosphotransfer time-course reaction to                Ability of RR PhoP on Target Gene aprA
  determine the effect of the mutation on the phosphatase activity. The assay             The phoPR TCS upon activation regulates close to 2% of
  was performed using wild-type (left) or mutated PhoR’ A400T (right) protein in          M. tuberculosis’s total genome, including a diverse set of genes
  the presence of the RR PhoP as described in “Materials and Methods”
                                                                                          involved in lipid synthesis, secretion of virulence factors, and
  section. (F) Quantitative measurement of the amount of inorganic phosphate
  (Pi) generated by PhoR wt (represented by solid line, circles) or mutant PhoR’          genes regulating acid stress survival (14). apr genes form a part
  (represented by dotted line, squares) in the presence of PhoP proteins at               of the regulon of this TCS, and their expression increases at low
  various time points as shown in panel (E). The Pi generated by the SK alone             pH when the PhoPR TCS is activated (Abramovitch et al., 2011).
  post 2 h of autophosphorylation was taken as 1, and the subsequent time                    The decreased phosphatase activity of the PhoR’ (A400T)
  points are normalized to it (n = 3). (G) Kinase and phosphatase activity
                                                                                          would effectively increase the availability of the phosphorylated
  analysis of the PhoR proteins. The autophosphorylation assay was performed
  for indicated time points for wild-type (left) and mutant (right) PhoR protein,         kinase and consequently the activated RR PhoP. Thus, we
  with conditions as indicated. Top panel, autoradiogram; bottom panel,                   examined the DNA-binding ability of phosphorylated PhoP
  Coomassie Brilliant Blue (CBB). Lanes marked 1 and 4, autophosphorylation               generated through either PhoR wt or PhoR’ (A400T) mutant
  reaction for 1 and 4 h, respectively; lane H, samples analyzed after heating at         proteins to the promoter region of aprA gene by EMSA. A 500-
  95◦ C for 5 min; and lane HC, proteins first incubated with cold ATP for 2 h
  followed by 32 P[ATP] for two additional hours before analysis (hot-chase
                                                                                          bp region upstream of aprA gene labeled with γ32 P-labeled
  analysis). (H) Quantitative analysis of autophosphorylation of wild-type and            ATP was used as a probe for these experiments. Although
  mutant PhoR proteins at 1- and 4-h incubation, as shown in panel (G). The               the RR alone at higher concentrations binds to the promoter,
  signal from wild-type phosphorylated PhoR at 1 h is taken as 1, and the rest            we used a lower optimized concentration (1 µM), which did
  of the points are normalized to it (n = 3). The signal intensity from the autorad
                                                                                          not show binding to the promoter in our assays (Figure 3A).
  was normalized to protein amount (as per CBB staining). (I) Quantitative
  analysis of SK phosphorylation post-incubation with cold ATP for 2 h followed
                                                                                          When the probe was incubated with a mixture of SK and RR
  by phosphorylation with 32 P labeled ATP for two additional hours (hot-chase            proteins in the presence of ATP, an increased mobility shift
  analysis), as shown in panel (G), with lanes labeled CH. The signals recorded           with increasing amounts of SK was recorded (Figure 3B). We
  for wild-type and mutant PhoR proteins were normalized to the amount of                 also confirmed that the unphosphorylated SK, either WT or
  protein loaded (n = 3). The p-value was calculated based on the amount of
                                                                                          mutant, does not bind to the aprA promoter by themselves
  SK∼P formed [for panels (C,E)] and the amount of Pi generated in the
  presence of the RR (PhoP) with respect to SK∼P [for panels (E,F)]. n                    (Supplementary Figure 3). These findings suggest that an
  represents the number of biological replicates used in the experiments.                 increase in autophosphorylation and phosphotransfer ability of
  p-values, * ≤ 0.05, ** ≤ 0.01, *** ≤ 0.001, and **** ≤ 0.0001, were                     the PhoR’ (A400T) protein would induce higher downstream
  determined by two-way ANOVA for the autophosphorylation and time-course                 gene expression. This improved activation of the phoPR TCS
  experiments and Student’s t-tests for the phosphotransfer experiment.
                                                                                          regulon led us to examine changes brought about in vivo by
                                                                                          this polymorphism.

   To further test this, we analyzed the autophosphorylation                              In vivo Analysis of Downstream Gene
of the WT and mutant PhoR under different conditions. First,
we examined the phosphorylation over an extended period of
                                                                                          Expression in Wild-Type or Mutant PhoR
4 h, and this revealed that, while 1 h of phosphorylation is                              Complemented Strains of
sufficient to generate a peak signal for the proteins, significant                        Mycobacterium tuberculosis H37Ra
phosphorylation was also detected at 4 h; and as anticipated,                             To check the mutant PhoR protein’s effect in vivo, we cloned
it was higher in the mutant protein (Figure 2G, lanes 1                                   the phoPR operon from M. tuberculosis H37Rv with its native
and 2 vs. lane 5 and 6; and Figure 2H). Interestingly,                                    promoter (∼500 bp upstream) in an integrative single-copy
heating of the reaction mix before analysis led to a significant                          mycobacterial shuttle vector, pCV125. We introduced the
phosphorylation reduction (Figure 2G, lanes 3 and 8). This                                mutation (A400T) in the WT construct and electroporated
could be due to the loss of SK–ATP complex [an intermediate                               both the WT and mutant plasmids in H37Ra. We used
formed during the autophosphorylation reaction, which yields                              H37Ra since it has a functionally defective PhoPR system
SK∼P (Sankhe et al., 2018)], allowing signal only from                                    and partially regains its virulence and persistence upon

Frontiers in Microbiology | www.frontiersin.org                                       8                                       August 2021 | Volume 12 | Article 724482
Waturuocha et al. PhoR Signaling in Clinical Strains of Mycobacterium tuberculosis FIGURE 3 | Effect of the PhoR single-nucleotide polymorphism (SNP) on the DNA-binding activity of response regulator (RR) PhoP. (A) Titration of RR PhoP protein to determine a concentration that shows low binding of unphosphorylated PhoP to the promoter region of the aprA gene. The DNA fragment corresponding to the aprA promoter was incubated with an increasing concentration of PhoP protein (as indicated) and tested by electrophoretic mobility shift assay (EMSA). The RR RegX3 was used as a negative control for non-specific binding (lane 2 marked –ve). (B) A comparative analysis of PhoP∼P (1 µM) binding to aprA promoter DNA as a function of phosphorylation mediated by the wild-type [PhoR wt, left] or mutant [PhoR’ (A400T), right] sensor kinase (SK) proteins at different concentrations. For all experiments, n = 3, where n represents the number of biological replicates. complementation with PhoP from H37Rv (Lee et al., 2008), observed with the mutant strain under uninduced conditions, making it a suitable model system for our studies. We we rationalized that the upregulation of phoP gene resulted from checked the expression levels of phoR and phoP genes in the increased phospho-signaling and downstream autoregulatory the complemented strains by RT-PCR. Similar levels of phoR effect of the RR PhoP. transcripts were observed in both strains under basal conditions We also analyzed the expression levels of a specific at pH 7.2. At low pH (5.5), known to induce expression downstream target gene, pks2 (polyketide synthase for SL-1 of phoPR TCS, we observed enhanced phoR expression in biosynthesis) (Walters et al., 2006). Expectedly, we observed a WT strain (∼10-fold) as well as mutant strain (∼12-fold) ∼10-fold increase in pks2 transcripts in the mutant strain and (Figure 4A). We also examined for change in the phoP a fourfold increase in the WT strain under inducing conditions transcript levels. As shown in Figure 4B, phoP expression (Figure 4C, left). These observations collectively validate the significantly increased in the mutant strain under inducing effect of an improved activation of the PhoP RR through conditions (∼8-fold) as compared with a ∼1.5-fold increase phosphorylation by the PhoR’ mutant SK on upregulation of observed in the WT strain. Since no significant changes were PhoPR regulon (Figures 4A–C, right). We also checked the Frontiers in Microbiology | www.frontiersin.org 9 August 2021 | Volume 12 | Article 724482
Waturuocha et al.                                                                                          PhoR Signaling in Clinical Strains of Mycobacterium tuberculosis

  FIGURE 4 | Expression analysis of downstream genes in Mycobacterium tuberculosis H37Ra strain complemented with wild-type or mutant phoPR operon. Relative
  mRNA expression analysis from H37Ra strains carrying a single integrated copy of either vector alone (pCV125) or with the wild-type or mutant phoPR operon,
  grown in Middlebrook 7H9 medium at pH 7.2 (uninduced) or at pH 5.5 (acid-induced). The expression was normalized to the levels of 16S rRNA, followed by the
  levels of the specific gene in the uninduced condition in strains carrying the empty vector (vector control). For all panels: left, uninduced (pH 7.2); and right, induced
  (pH 5.5). Expression analysis for (A) phoR gene, (B) phoP gene, (C) pks2 gene, (D) aprA gene, and (E) tcrX is shown. The primer sequences for all the genes
  examined were obtained from previously published studies and listed in Supplementary Table 1. For all experiments, n = 3, where n represents the number of
  biological replicates. p-values, * ≤ 0.05, ** ≤ 0.01, *** ≤ 0.001, and **** ≤ 0.0001, were determined by one-way ANOVA.

expression of aprA gene, another downstream gene of the                                   strain sixfold induction relative to the vector control. More
PhoPR TCS, and found that it was induced under conditions                                 importantly, the induction was significantly higher (twofold) in
of low pH, as expected with the strains expressing the WT                                 mutant PhoR’ carrying bacilli compared with the WT PhoR
PhoR showing a ∼3-fold induction and the mutant PhoR’                                     strains (Figure 4D, right); as a control, we analyzed the

Frontiers in Microbiology | www.frontiersin.org                                      10                                           August 2021 | Volume 12 | Article 724482
Waturuocha et al.                                                                                         PhoR Signaling in Clinical Strains of Mycobacterium tuberculosis

  FIGURE 5 | Expression analysis of PhoPR regulated aprA gene using promoter-reporter system in Mycobacterium tuberculosis H37Ra. (A) Green fluorescent protein
  (GFP) fluorescence in H37Ra strains carrying aprA promoter-reporter plasmid and integrative vector pCV125 alone or containing wild-type or mutant phoPR operon
  in cultures grown at pH 7.2 or at pH 5.5. The solid lines show GFP fluorescence at pH 5.5, and the dotted lines that at pH 7.2 over 13 days. (B) Analysis of the
  relative fluorescence ratio of GFP/mCherry, at pH 5.5, solid lines; and at pH 7.2, dotted lines (triangles, vector control; circles, phoR wt; and squares, phoR’ (A400T)
  mutant). (C) Quantitation of GFP fluorescence in cultures (as indicated) at day 12 at pH 5.5 (green, induced) and at pH 7.2 (red, uninduced). (D) Quantitation of the
  relative fluorescence ratio of GFP/mCherry from induced and uninduced cultures at day 12 at pH 5.5 (green) and at pH 7.2 (red). (E) Fluorescence microscopy
  images showing GFP expression in cultures at day 12 in indicated strains. Left panel, mCherry; right panel, GFP. (F) Quantitation of GFP fluorescence and (G)
  relative fluorescence by GFP/mCherry ratios by fluorescence microscopy in various strains and conditions (as indicated) from ∼300 individual bacilli. n = 3, where n
  represents the number of biological replicates used in the experiments. p-values * ≤ 0.05, ** ≤ 0.01, *** ≤ 0.001, and **** ≤ 0.0001, were determined by two-way
  ANOVA.

Frontiers in Microbiology | www.frontiersin.org                                     11                                           August 2021 | Volume 12 | Article 724482
Waturuocha et al.                                                                                           PhoR Signaling in Clinical Strains of Mycobacterium tuberculosis

  FIGURE 6 | Analysis of the effect of the phoR polymorphism by infection studies in host cells using H37Ra strain as a host strain. (A) Fluorescence microscopy
  images showing aprA induction upon infection in H460 lung epithelial cell line at 4 hpi. Top panel, a strain carrying vector alone; middle panel, PhoR wt; and lower
  panel, PhoR’ (A400T) mutant. mCherry marks constitutive promoter activity; green fluorescent protein (GFP), aprA marks promoter activity; DAPI marks the nucleus
  of the host cell; and merged image shows localization for all fluorophores. The brightness of merged image was increased to show presence of bacillary signal.
  (B) Quantification of relative fluorescence 4 hpi of intracellular bacilli by GFP/mCherry ratio for ∼100 bacilli. Cells were infected with H37Ra strains carrying aprA
  promoter-reporter plasmid along with an integrated copy of the empty vector, or vector containing either the wild-type or mutant phoPR operon. (C) Quantitation of
  the intracellular bacterial burden for various strains (as indicated) after infection in THP-1 differential macrophage cell line. Cells were infected with H37Ra strains an
  integrated copy of the empty vector, the wild-type or mutant phoPR operon. Colony-forming units (CFUs) obtained at 24 hpi are shown. (D) Measurement of NO
  production in supernatants of uninfected and infected THP-1 cells by the Griess test at various time points. Cells were infected with strains described above, and the
  NO/nitrite levels at 4 hpi were measured; left panel, 24 hpi; right panel, 72 hpi. The nitrite produced is normalized to the uninfected cells at 4 hpi. For all experiments,
  n = 3, where n represents the number of biological replicates used in the experiments. p-values, * ≤ 0.05, ** ≤ 0.01, *** ≤ 0.001, and **** ≤ 0.0001, were
  determined by one-way ANOVA.

expression of Rv3764 (tcrX) gene and found no significant                                  activity over 12 days at acidic pH of 5.5, unlike at pH 7.2
change in its expression levels among the strains in any                                   (Figure 5A). A 12-day time point was chosen, as it has been
condition (Figure 4E).                                                                     previously reported to be reliable time point to record acid-
                                                                                           mediated induction (Abramovitch et al., 2011). As anticipated,
                                                                                           the strain-carrying mutant PhoPR TCS demonstrated a
Expression of aprA Is Induced to a                                                         higher expression of aprA GFP over time, with a significant
Greater Extent in PhoR’ Mutant Strain at                                                   difference at day 12 compared with the strains with WT PhoPR
Acidic pH                                                                                  and the vector control (Figure 5C). When normalized to
Given that we found differences in the induction and                                       mCherry, we observed a significantly higher expression of
expression of Pho regulon in the WT and mutant strains                                     aprA in the mutant than the WT (Figures 5B,D). A similar
in response to pH stimulation, we introduced a promoter-                                   observation of expression differences in these strains at day
reporter plasmid containing aprA promoter-driven eGFP2                                     12 post-acid induction was made by microscopic analysis
and constitutively expressed mCherry (Abramovitch et al.,                                  (Figure 5E). Quantification of fluorescence from ∼300
2011). The objective was to measure GFP fluorescence as a                                  bacterial cells expressing both GFP and mCherry per strain
readout of the activation of the TCS. The strains carrying WT                              (Figures 5F,G) confirmed that the mutant strain has a higher
or mutant PhoPR showed induction of an aprA promoter                                       aprA promoter activity.

Frontiers in Microbiology | www.frontiersin.org                                       12                                            August 2021 | Volume 12 | Article 724482
Waturuocha et al. PhoR Signaling in Clinical Strains of Mycobacterium tuberculosis
To verify that the activation of aprA at low pH is through Griess reagent. In agreement with previously published data
the phoPR TCS, we used an inhibitor of this TCS ETZ, (41), the NO levels in the cells infected with the WT PhoR
previously reported to inhibit the phoPR system (Johnson strain were always lower owing to an active phoPR regulon of
et al., 2015). After 24 h of treatment with 80 µM of H37Rv (Figure 6D; Ferrer et al., 2010), which is reflected in
ETZ (Supplementary Figure 4A) at day 12 post-induction, the higher CFU load obtained from them. Interestingly, the
reduction in the expression of aprA fluorescence was recorded production of NO when infected with the strain containing
(Supplementary Figures 5A,B) in the strain carrying the mutant PhoR’ (A400T) was ∼1.5-fold higher than the WT and
WT copy. However, the reduction was lesser in the strain similar to the strain containing the empty vector and at 24 hpi
complemented with mutant PhoR, showing that the SNP in (Figure 6D, right panel). This response was captured on the
clinical strains could potentially alter their response to drugs. bacterial burden as well (Figure 6C), and both vector control
To determine where this inhibitor could be acting, we checked and mutant PhoR strains had similar CFU, which was lower
the autophosphorylation of PhoR wt and PhoR’ (A400T) protein than that of WT PhoR. Thus, the host response could be a
in the presence of different concentrations of the inhibitor. significant contributor to the absence of selection of this mutation
We observed inhibition of phosphorylation for both WT and in clinical strains, as the increase in NO could be one of the
mutant SK proteins. This inhibition was lesser in the mutant ways the host eradicates the mutant strain more effectively.
than the WT (Supplementary Figures 4C,D), suggesting that the These observations reveal that multiple factors drive infection
inhibition of the TCS PhoPR observed by previous researchers and survival in the host, such as the adaptivity of the strain
and us could be by lowering the SK activation levels by yet- to infect and survive in the host and highlight the finding
explored mechanisms. that the PhoR polymorphism at A400T position, which though
robustly activates the phoPR TCS and downstream operon
Effect of the Single-Nucleotide activity, is not favorable for invasion and survival conditions
Polymorphism (A400T) in PhoR on in vivo.
Overall, we present experimental evidences underlying the
Intracellular Growth of Complemented occurrence of a poorly prevalent polymorphism of PhoR SK
Mycobacterium tuberculosis H37Ra in clinical strains, which improves its biochemical activities but
Strain in Host Cells reduces its overall fitness by affecting its ability to invade and
Having established that the SNP alters expression of PhoP- survive in the intracellular environment in vitro.
regulated genes in vivo, by quantifying the aprA reporter activity
at various time points post-infection (4 hpi), we found that the
expression of aprA-GFP was persistently higher in the mutant DISCUSSION
strain, and hence quantified the promoter activity for ∼100 bacilli
of each strain inside the infected H460 lung epithelial cell line Various reports on genetic variations among strains of
(Figures 6A,B). We also performed these experiments in the M. tuberculosis used in the laboratory and clinical strains
presence of the inhibitor ETZ at a concentration of 100 µM. address the diversity that exists among them (Ramaswamy
This concentration does not affect the host cells’ health or the and Musser, 1998; Fleischmann et al., 2002; Zheng et al., 2008;
bacteria (Supplementary Figure 4B). We recorded differences Schreuder et al., 2015). However, these reports seldom address
in the expression of aprA-GFP, with the mutant showing higher the variations seen in the TCS regions of clinical strains nor
expression of aprA-GFP at any given time point (Figure 6B). addresses their effects on signaling. We report and characterize
We also investigated the ability of the mutant strain to survive a rare polymorphism in the PhoR SK protein that establishes an
within differentiated THP-1 cells, with the three test strains altered signaling landscape in the tubercle bacteria.
of H37Ra carrying the pCV125 empty vector, the pho R WT, The PhoPR TCS is relatively well-studied in M. tuberculosis
or phoR’ (A400T) at an MOI of 10 and plated for colony- and implicated in regulating many essential processes such
forming unit (CFU) differences at 24 hpi and normalized to as virulence, immunogenicity, persistence, lipid synthesis and
the invasion time point at 4 hpi (Figure 6C). Interestingly, metabolism, cell wall composition, and aerobic and anaerobic
while the complementation with the WT PhoR increased the respiration (Pérez et al., 2001; Gupta et al., 2006; Walters
CFU by more than twofold, the presence of mutant PhoR et al., 2006; Gonzalo-Asensio et al., 2008; Pathak et al., 2010).
only showed marginal increase in the bacterial load, suggesting The PhoR histidine SK protein has an integral membrane-
an impaired survival of the strain, similar to vector alone anchored domain, with an extracellular domain to sense
(Figure 6C). Thus, we hypothesize that inefficient survival within extracellular cues (Ryndak et al., 2008) and a typical kinase
cells may be a key factor for this SNP not being selected naturally domain containing the SHELR motif with the conserved histidine
in the population. residue as phosphorylation site. The mutation A400T, which
The survival advantage of the strain carrying the WT PhoPR maps in the HATPase domain of the protein, enhances its
protein could plausibly be driven by alteration in host responses catalytic activity in terms of stable phosphotransfer and reduced
such as cytokine levels and the oxidative burst (Voskuil et al., autophosphatase activity, which is rarely examined, ultimately
2011). We examined if the host responds differently to the WT affecting the quantum of the activated RR PhoP available
and mutant strains, by monitoring the NO levels from infected in the system. The mutation abrogated the rapid decay of
THP-1 cells at various time points (4 and 24 hpi) using the phosphorylated SK and RR, which we generally record for the
Frontiers in Microbiology | www.frontiersin.org 13 August 2021 | Volume 12 | Article 724482Waturuocha et al. PhoR Signaling in Clinical Strains of Mycobacterium tuberculosis
PhoPR system, thereby facilitating more persistent activation
of the PhoPR regulon. This change enhanced the levels of
PhoP∼P, leading to enhancement in its DNA binding to target
gene promoters, such as for the aprA (acid and phagosome
regulated) locus. These changes when tested in vivo in acidic
pH revealed robust activation of the H+ sensing TCS, PhoPR in
the mutant strain.
For our studies, we used an avirulent mycobacterial strain,
H37Ra, which has a mutation that impairs the DNA-binding
activity of the PhoP protein (Chesne-Seck et al., 2008; Zheng
et al., 2008). The strain offered us an advantage, as the mutation’s
effect can be recorded without generating a knockout strain.
The impact of the SK protein’s altered activity in the A400T
mutant is still profoundly seen at the levels of downstream genes,
highlighting the utility of H37Ra in such studies.
Besides aprA, expression analysis of the phoR, phoP, and pks2,
other downstream genes, showed higher levels in the strains
carrying WT or mutant phoR gene, unlike one carrying the
vector only. When the expression was analyzed by growing
the cultures at a pH of 5.5 over 12 days, an induction was
recorded for all of them, proving that the complementation of
phoPR into H37Ra reconstitutes the functional PhoPR operon; FIGURE 7 | Summary of the PhoPR two-component system (TCS) signaling
cascade and the effect of the A400T mutation. The mutation (A400T) in the
however, there was no induction of another TCS gene tcrX
sensor kinase (SK) PhoR, which responds to low pH, enhances downstream
when tested. However, a significantly higher expression was gene expression because of higher autophosphorylation and reduced
observed for the mutant PhoR strain due to its enhanced kinase autophosphatase activity. This leads to enhanced phosphorylation of PhoP
activity and impaired phosphatase activity. In the functional protein and its DNA-binding ability (shown in red). The signaling changes
complementation background, the readout from aprA promoter- affect the invasion of the bacteria that harbor the mutation and reduce the
prevalence of the strain carrying single-nucleotide polymorphism (SNP) in the
reporter plasmid (Abramovitch et al., 2011) showed a higher
population.
expression in the presence of mutant PhoR compared with the
WT PhoR and the vector control, thus indirectly providing
evidence that low pH is linked to activation of PhoR, enhancing
the kinase activity of the PhoR protein. This aspect has not
been established to date owing to the lack of biochemically primary regulator of our observations under low pH, we used
characterized full-length proteins. an inhibitor ETZ, previously reported to inhibit acid sensing
Based on the experimental evidence, it was tempting to in this system. While the inhibitor lowered the expression of
hypothesize that this improved response to acidic pH could target gene aprA and reduced CFU in cell line infection, this
benefit the mutant strain. However, in infection studies, we inhibitor when tested in the autophosphorylation assay showed
recorded lower bacterial burden in the mutant strain, compared reduced inhibitory activity against the mutant protein. This
with the strain carrying WT PhoPR locus. This observation observation suggests the importance of characterizing the effect
correlated well with the changes in the NO levels in the infected of inhibitors vis-à-vis polymorphisms seen in the target protein
cells, where the WT showed reduced NO levels and higher in clinical strains, which would affect the efficacy of various new
bacterial burden. therapeutic entities.
Our results display the importance and selection of a regulated Overall, we present an evolutionary design of signaling
and evolutionarily tuned signaling cascade during infection. systems in bacteria, wherein genetic polymorphisms that can
Even though the polymorphism seems to provide a functional bring about an increase in signaling may not be favorable for
advantage and primes the phoPR operon for environmental the bacteria and hence may be deselected. Here, the mutation
stimuli, early and higher expression of the target genes is not in the SK PhoR had better activity but limited invasion
favorable for the bacteria during infection. Similar observations ability, possibly through altered host responses upon infection
have been made for several viral infections and mutations with (Figure 7), facilitating its clearance through processes such as
a low invasion profile and are not very successful. For instance, the production NO, which limits its replication within the host.
HIV-1 subtype C accounts for over 50% of the conditions Though the mechanisms by which this is governed are yet to
globally. However, it is less fit within-host than the less prevalent be elucidated, such changes confer increased pathogenesis but
HIV-1 subtype B (Shet et al., 2016), possibly because of its impaired transmission in clinical strains such as in M. tuberculosis
relatively improved ability to be transmitted successfully to new IS6110 B strain (Soto et al., 2004; Broset et al., 2015). Our
hosts (Ariën et al., 2007). finding supports the understanding that the balance between
An exciting offshoot of our study is the implication of SNPs gene expression levels and their temporal dynamics needs to be
on drug resistance. In an attempt to ensure that PhoPR is the optimized to maintain pathogenicity and virulence.
Frontiers in Microbiology | www.frontiersin.org 14 August 2021 | Volume 12 | Article 724482You can also read