A self referenced in situ arrival time monitor for X ray free electron lasers
←
→
Page content transcription
If your browser does not render page correctly, please read the page content below

www.nature.com/scientificreports
OPEN A self‑referenced in‑situ
arrival time monitor for X‑ray
free‑electron lasers
Michael Diez1,2*, Andreas Galler1,2, Sebastian Schulz1,2,10*, Christina Boemer1,10,
Ryan N. Coffee3, Nick Hartmann3,4, Rupert Heider5, Martin S. Wagner5, Wolfram Helml5,6,11,
Tetsuo Katayama7,8, Tokushi Sato9,12, Takahiro Sato3, Makina Yabashi7,8 &
Christian Bressler1,2*
We present a novel, highly versatile, and self-referenced arrival time monitor for measuring the
femtosecond time delay between a hard X-ray pulse from a free-electron laser and an optical laser
pulse, measured directly on the same sample used for pump-probe experiments. Two chirped and
picosecond long optical supercontinuum pulses traverse the sample with a mutually fixed time delay
of 970 fs, while a femtosecond X-ray pulse arrives at an instant in between both pulses. Behind the
sample the supercontinuum pulses are temporally overlapped to yield near-perfect destructive
interference in the absence of the X-ray pulse. Stimulation of the sample with an X-ray pulse delivers
non-zero contributions at certain optical wavelengths, which serve as a measure of the relative arrival
time of the X-ray pulse with an accuracy of better than 25 fs. We find an excellent agreement of our
monitor with the existing timing diagnostics at the SACLA XFEL with a Pearson correlation value of
0.98. We demonstrate a high sensitivity to measure X-ray pulses with pulse energies as low as 30 µJ.
Using a free-flowing liquid jet as interaction sample ensures the full replacement of the sample volume
for each X-ray/optical event, thus enabling its utility even at MHz repetition rate XFEL sources.
Since the advent of hard X-ray free-electron lasers (XFEL) about ten years a go1–5, a scientific community has
grown seeking to exploit their intense femtosecond pulses to investigate ultrafast dynamics in optical pump/X-
ray probe e xperiments6–8. However, despite having ultrashort femtosecond X-ray and optical pulses available,
the level of synchronisation between the two independent light sources limits the achievable time resolution
in these experiments. Timing jitter at large-scale XFEL facilities arises from different sources, most notably
in the linear accelerator itself9, the reference signal distribution scheme across the facility10, and the optical
laser, including length variations of the optical beam p aths11. In order to minimise the timing jitter between
optical lasers and the X-ray pulses at the experimental stations, but also to stabilise the linear accelerator, dif-
ferent advanced synchronisation schemes have been developed and i mplemented9,10,12–14, for instance utilising
transit time-stabilised optical fibres to link the photo-injector laser of the electron gun, the reference signals of
the acceleration modules and the remote optical laser system used for sample excitation to a common optical
reference. While the synchronisation accuracy was pushed to a level of about ten femtoseconds between the
facility’s reference oscillator and the subsystem oscillators, such as the seeder of the pump-probe laser system,
1
European XFEL GmbH, Holzkoppel 4, 22869 Schenefeld, Germany. 2The Hamburg Centre for Ultrafast
Imaging, Luruper Chaussee 149, 22761 Hamburg, Germany. 3SLAC National Accelerator Laboratory, 2575
Sand Hill Rd., Menlo Park CA 94025, USA. 4Coherent, Inc., 5100 Patrick Henry Dr., Santa Clara, CA 95054,
USA. 5Physik‑Department E11, Technical University of Munich, James‑Frank‑Str. 1, 85748 Garching,
Germany. 6Faculty of Physics, Ludwig-Maximilians-Universität Munich, Am Coulombwall 1, 85748 Garching,
Germany. 7Japan Synchrotron Radiation Research Institute, 1‑1‑1 Kouto, Sayo‑cho, Sayo‑gun, Hyogo 679‑5198,
Japan. 8RIKEN SPring-8 Center, 1‑1‑1 Kouto, Sayo‑cho, Sayo‑gun, Hyogo 679‑5148, Japan. 9Center for
Free-Electron Laser Science, Deutsches Elektronen-Synchrotron DESY, Notkestraße 85, 22607 Hamburg,
Germany. 10Present address: Deutsches Elektronen-Synchrotron DESY, Notkestraße 85, 22607 Hamburg,
Germany. 11Present address: Center for Synchrotron Radiation, Technical University of Dortmund,
Maria‑Goeppert‑Mayer‑Str. 2, 44227 Dortmund, Germany. 12Present address: European XFEL GmbH, Holzkoppel
4, 22869 Schenefeld, Germany. *email: michael.diez@xfel.eu; sebastian.schulz@desy.de; christian.bressler@
xfel.eu
Scientific Reports | (2021) 11:3562 | https://doi.org/10.1038/s41598-021-82597-3 1
Vol.:(0123456789)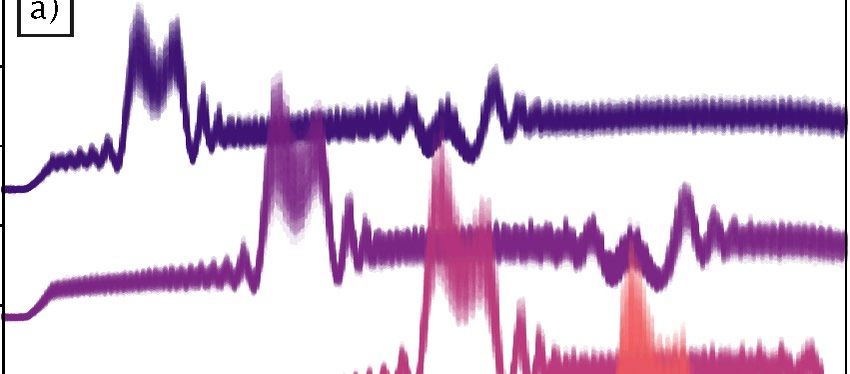
www.nature.com/scientificreports/
the overall level of synchronisation was found to be on the same order of magnitude as the few ten femtosecond
pulse duration at a soft X-ray F EL13.
For time-resolved experiments utilising optical pump and X-ray probe pulses, usually optical pulse energies
of several µJ up to mJ are necessary for sample e xcitation15, which consequently require the use of amplified
laser systems. However, the design of the laser amplifier and compressor can introduce a few femtoseconds to
up to hundreds of femtoseconds additional timing jitter16–18. Subsequent optics for tailoring and guiding the
optical laser beam to the sample interaction region introduce further timing jitter between the optical laser and
the X-ray pulses.
Ultimately, additional diagnostic methods are therefore used to measure the relative arrival time between
the optical and X-ray pulses in order to minimise arrival time uncertainties, which cannot be removed. These
so-called timing tools are meanwhile implemented at most XFEL beamlines and instruments19–22 and allow
determining the arrival time for each laser pump/X-ray probe event. As such they provide means to sort the data
a posteriori, yielding a superior timing precision in the analysis of actual pump-probe experiments following
this correction22,23. Different schemes are employed for an accurate arrival time measurement including phase-
dependent streaking of photo-ionised atoms with an overlapping THz electric fi eld24–26, but often also exploiting
the transient X-ray-induced refractive index changes, which affect both the transmission and reflection of an
optical laser pulse through the chosen material. Two straightforward techniques have been implemented at dif-
ferent XFEL facilities, known as spatial encoding and spectral encoding. In both methods the X-ray pulse induces
a change of the optical properties of a sample, such that the resulting change of transmission and reflectivity of
an optical light pulse is used to determine the relative arrival time of the two pulses. Spatial encoding retrieves
the arrival time information from the lateral modulation of a reflected or transmitted optical beam profile, when
the X-ray beam crosses with the optical beam at a given angle on the interaction s ample27–29. Spectral encoding
uses a chirped laser pulse, where frequencies ranging from lower to higher optical frequencies—or from red to
blue in spectral colour—arrive at well-defined and distinctly different times. The transient refractive index in
the material induced by the X-ray pulse therefore encodes the arrival time as a spectral feature, for example a
step-like change of the transmitted laser spectrum at a specific wavelength19,30,31.
In this work, we present a variation of the spectral encoding approach, which aims to reliably operate at all
XFEL facilities, in particular at high-repetition rates and at the same time accepting a broad range of X-ray pulse
intensities. We modified this scheme to better exploit the small changes of the refractive index of the material
induced by the transmitting X-ray pulse, which enhances the sensitivity towards highly transparent materials
including diamond foils and few micrometer thin flat sheet liquid jets. For this purpose we add an interferomet-
ric detection scheme, which is not only sensitive to the potentially weak X-ray induced absorption change, but
also to the X-ray-induced phase change of the transmitted chirped optical pulse. This strategy opens up a larger
choice of materials for precise timing tool measurements, including those which are not feasible in either spatial
or spectral encoding schemes like diamond. The major improvement is a direct result of its background-free
detection principle, due to near-complete annihilation of the entire signal by destructive interference in absence
of an X-ray pulse impinging on the sample. This condition can be fulfilled for nearly all transparent samples,
and easily with optically isotropic materials. The presence of a femtosecond X-ray pulse on the material yields a
non-zero interferometric signal, which can be analysed to extract the precise relative timing between individual
X-ray and optical pulse pairs. As we demonstrate in this work for individual chirped pulses, this scheme operates
reliably, even if the material would vary its optical properties from shot to shot. This self-referencing method
always yields complete destructive interference when the optical properties of the interfering beams are identical,
regardless of when they would gradually change from pulse to pulse.
To benchmark the capabilities of the interferometric approach we carried out a proof-of-principle experiment
at the SPring-8 Angstrom Compact free-electron LAser (SACLA) in Japan, where we used a free-flowing flat
sheet liquid jet32 as the interaction sample. This approach has the additional benefit of being applicable to next
generation MHz repetition rate XFEL sources with few-mJ pulse energies, delivering up to several kilowatts of
X-ray pulse power5,33,34, where the established timing tools can suffer from these high repetition rates. The main
concern are pile-up effects caused by the mJ-level XFEL pulses on the timing tool materials, which deteriorate
the extracted signal during the MHz repetition rate pulse delivery due to saturation effects caused by the previ-
ous pulses, either by the accumulated heat load or by excited state carrier lifetimes exceeding the time interval
between pulses. Furthermore, commonly used samples such as Si3N4 also will be severely damaged after only a
few seconds exposure, even at low repetition r ates35. Consequently, for fully exploiting the MHz capabilities at
the latest and upcoming XFEL sources, samples are required which are capable to distribute the X-ray induced
heat load fast enough to guarantee no heat pile-up between the pulses. Alternatively the sample volume needs
to be replaced with a fresh sample volume between two pulses. By using a fast-flowing liquid jet we are able to
replace the entire sample volume for each X-ray pulse even at MHz repetition rates, thus evading the problem of
destroying or deteriorating the interaction sample. A combination of a fast-flowing liquid jet, which can reach
speeds of around 100 m/s (refs.36,37), and sufficiently small optical laser and X-ray foci of well below 50 µm, allow
the exchange of the sample volume at MHz repetition rates. Crucially, we also demonstrate the capability to apply
this interferometric encoding approach as an in-situ timing tool on the sample under investigation. For this,
we superimpose an additional intense optical laser pulse with a wavelength of 400 nm, which serves as a pump
pulse in an actual liquid chemistry experiment. The in-situ arrival time measurement could potentially increase
the achievable time resolution by also measuring additional timing jitter occurring at the sample position, e.g.
spatial displacement of the sample due to nearby vibrational sources or using a liquid jet.
Scientific Reports | (2021) 11:3562 | https://doi.org/10.1038/s41598-021-82597-3 2
Vol:.(1234567890)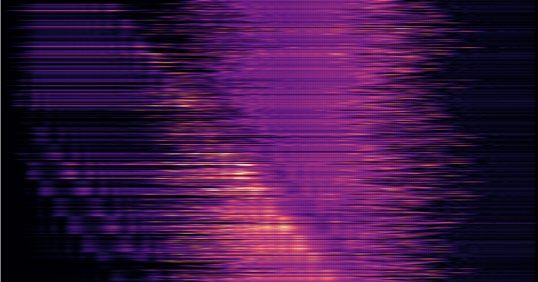
www.nature.com/scientificreports/
Figure 1. Setup of the XFEL benchmark experiment and principle of operation of the interferometric time
arrival monitor. The 800 nm beam of the SACLA’s synchronised optical laser is split into three branches: the
first beam (1) is guided to the facility’s standard timing tool TT, the second beam (2) is frequency-doubled
(second-harmonic generation, SHG) to a wavelength of 400 nm and serves both for temporal calibration of
the interferometric timing tool without X-ray pulses, via the optical delay line adjusting t2 and for sample
excitation with X-ray probing pulses. The third beam (3) is used for the generation of a chirped supercontinuum
in a pressurised argon cell (Ar), and traverses another optical delay line tSC to arrive with the X-ray pulse on
the sample. Before the sample, a precision-mounted polariser (P1) and a 4 mm thick strongly birefringent a-cut
α-barium borate crystal (αBBO1) generates two orthogonally polarised and 970 fs temporally shifted pulses (a).
This pulse pair is then spatially overlapped with the X-ray pulse in the sample (S), and by adjusting tSC, the
X-ray pulse arrives temporally in between both supercontinuum pulses (b). Inside a second, identical barium
borate crystal (α BBO2) with its optical axis rotated by 90◦ (c), both supercontinuum pulses are then temporally
overlapped again, but still exhibiting their orthogonal polarisation. The grey regions indicate those wavelength
regions, which experience the same refractive index in the sample, where the leading edge experiences the
ground state refractive index while the X-ray induced refractive index change affects the trailing edge of both
pulses. Subsequent passing through the second polariser (P2 ) projects parts of the orthogonal polarised beams
onto the same polarisation axis, which then can interfere destructively (d) in the spectrometer (Sp). Focusing
and collimation of the supercontinuum pulses is realised with curved mirrors to avoid unwanted effects caused
by chromatic aberration in lenses. Overlapping and additional intense 400 nm optical pulse the actual sample
can be excited and for carrying out a traditional optical pump/X-ray probe experiment, while simultaneously
recording the mutual optical/X-ray arrival times in-situ (e).
Experimental details
The experiments were performed in the EH2 experimental hutch of SACLA. This XFEL delivers femtosecond
X-ray pulses at a repetition rate of either 30 Hz or 60 Hz. The photon energy can be adjusted in the 4 keV to
10 keV range with up to 0.6 mJ pulse energy and, with decreasing pulse energy, up to 20 keV can be r eached38.
Throughout the experiment, the repetition rate was set to 30 Hz and the photon energy to 5.2 keV, with a pulse
energy of about 300 µJ. The X-ray beam spot at the sample position was set to a circular radius of 100 µm, using
the facility’s compound refractive l enses39.
The facility’s optical laser system is based on a commercial Ti:sapphire chirped-pulse amplification (CPA)
system operating at 1 kHz (Micra and Legend Elite, Coherent Inc.), which delivers pulses with a duration of 25 fs
FWHM and 15 mJ of energy at a central wavelength of 800 nm40,41. It is synchronised to the accelerator’s master
clock by locking the oscillator cavity length using a commercial standard phase-locked loop40 (Synchrolock-AP,
Coherent Inc.). A pulse picker selects a subset of optical pulses from the 1 kHz laser amplifier output to match
the X-ray repetition rate. The time delay between the optical laser and X-ray pulses can be freely adjusted with
sub-picosecond accuracy using a trigger and clock delay module (84DgR5C01, CANDOX Systems Inc.), while for
femtosecond timing an additional optical delay line is used. For our experiment, schematically shown in Fig. 1,
we split the optical laser beam into three paths. The first one is used for the operation of the facility’s standard
timing tool (TT), which is based on the spatial encoding technique and located a few metres upstream of the
experimental hutch EH229,42. The second beam is used for exciting the actual sample in our pump-probe geom-
etry and for the calibration of our interferometric timing tool. For this, the 800 nm optical pulse is frequency-
doubled (second-harmonic generation, SHG) in a BBO crystal to a wavelength of 400 nm. Finally, the third
beam is used for the simultaneous measurement of the X-ray/optical relative arrival time at the sample position
and on the sample itself using our novel interferometric technique. For this, it is further split into two beams in
a common path interferometer, which had already been proposed in 1958 by Mertz43 and was first applied in
astronomy44. In the interferometer, both laser pulses travel along the same optical path and traverse the same
optical elements. Therefore, the extracted interferometric signal is insensitive to environmental disturbances,
such as air flow, temperature variations and vibrations. For the interferometric scheme, 800 µJ of the 800 nm
fundamental laser pulses are focused into a 1.5 m long tube filled with 1.5 bar pressurised Argon gas, generat-
ing a broadband supercontinuum pulse45 ranging from 300 nm to over 1000 nm in wavelength. The Argon cell
and several transmissive optics in the beam path exhibit sufficient dispersion to chirp the continuum to a pulse
Scientific Reports | (2021) 11:3562 | https://doi.org/10.1038/s41598-021-82597-3 3
Vol.:(0123456789)
www.nature.com/scientificreports/
duration of approximately 2.5 ps within a narrow wavelength range of about 350–430 nm. The supercontinuum
laser pulse is guided over an optical delay line ( tSC) to the interferometer. To prevent linear or non-linear sample
excitation by the supercontinuum pulse, a BG38 color glass filter is used to block the 800 nm contribution from
the supercontinuum, reducing the supercontinuum pulse energy to below 1 µJ.
Its polarisation is set to 45° via the broadband polariser P1 and it is subsequently guided through a 4 mm thick
a-cut alpha barium borate crystal ( α-BBO1 ). The optical axis of the crystal is set to be horizontal, which evenly
projects the incoming pulse into a vertical and horizontal polarisation component, due to the birefringence of
the barium borate crystal. By this, the extraordinary vertical polarised pulse exits the crystal about 970 fs ahead
of the ordinary horizontal polarised pulse (Fig. 1a). This pair of orthogonal polarised supercontinuum pulses is
focused to a 60 µm circular spot onto the sample, spatially overlapping with the 100 µm circular X-ray pulse. The
arrival of the X-ray pulse is temporally set in between both supercontinuum pulses by adjusting the delay line in
the supercontinuum beam path ( tSC ), and marks time zero by stimulating the sample (Fig. 1b). By absorbing
X-ray photons, high-energy electrons in the conduction band of the sample (either a reference solid, or the liquid
water jet) are generated. Within tens of femtoseconds, these high-energy electrons create secondary charges in
an electron c ascade46. In solids (e.g., the SiO2 plate used for calibration) these electrons relax energetically to the
bottom of the conduction band, in liquid water these electrons thermalize within 300 fs as solvated e lectrons47.
This process changes the band structure of the material, thus changing its refractive index. The spectral regions
of each supercontinuum pulse, which spatially overlap in the sample with the X-ray pulse and temporally trail
behind the exciting femtosecond X-ray pulse experience an amplitude reduction due to the altered absorp-
tion cross section and a phase modulation due to the change in refractive index. Both supercontinuum pulses
are then transmitted through a second, identically a-cut barium borate crystal ( α-BBO 2 ) with its optical axis,
however, set to be vertical. As a result, both supercontinuum pulses overlap temporally again, but maintain
their previously generated orthogonal polarisation (Fig. 1c). By precisely adjusting the rotation of the second α
-BBO 2 crystal around the vertical optical axis, the effective length of the crystal can be changed, which allows
to exactly establish a spectral offset of /2 between both pulses. Utilising a polariser set to 45◦ with respect to
the two axes of polarisation, half of the amplitude of each pulse is projected onto the same polarisation plane.
Due to destructive interference between both supercontinuum pulses, nearly complete annihilation over all
contributing wavelengths can be achieved in the absence of the X-ray pulse. Crucially, when X-rays interact with
the sample, a residual non-zero interferometric contribution is observed in those central wavelength regions,
where only one of the two supercontinuum pulses experienced the modified refractive index (coloured portion
of the pulse in Fig. 1c). The spectral wings of each pulse experience the same sample condition, either with the
unperturbed refractive index on the red side of the spectrum or the X-ray-altered refractive index on the blue
side of the spectrum, thus completely annihilate (indicated by the grey wings in Fig. 1c). The remaining central
portion in the presence of an X-ray pulse does not interfere destructively and results in the indicated residual
spectrum (Fig. 1d). This X-ray-induced remaining interferometric signal is guided to a spectrograph (Andor
Shamrock 193i, focal length 193 mm, 600 grooves/mm grating with a blaze wavelength of 500 nm), where the
dispersed optical spectrum is recorded with a pixel detector (Adimec Opal, 1920 × 1080 pixels, pixel size 5.5 µ
m2 ). The high dispersion of the chosen grating limits the recorded spectral region to about ≈100 nm around
400 nm, and defines ultimately the temporal window of the measurement, as well as its final time resolution.
In an actual scientific experiment, where the interferometric timing tool is used as an in-situ arrival time
monitor, the intense 400 nm pulse is used to excite the sample. Thus, an additional optical pulse arrives together
with the supercontinuum double pulses and the X-ray pulse in a narrow time window. This scenario is shown
in Fig. 1e.
The calibration of the spectrometer was accomplished with a calibrated Hg/Ne light source.
As a sample delivery system we used a commercial free-flowing liquid flat sheet jet system (see “Methods”
and ref.32) to provide a fresh sample volume for each X-ray/optical pulse event. Compared to commonly used
round liquid jets, a flat sheet surface yields a more predictable beam path of the optical light through the sample
for all involved optical beams.
Results and discussion
Time calibration and data analysis. Upon sample excitation, the interferometric signal spans over a
defined range of wavelengths, limited by two sharp boundaries, created by the interaction of the X-ray pulse with
the sample (see schematic in Fig. 1d). The width of the spectrum corresponds to the fixed time delay between
both supercontinuum pulses governed by the thickness and rotation of the birefringent barium borate crystals,
which in our case is 970 fs. Both the red and blue cut-off wavelengths deliver the same information about the
relative arrival time of the X-ray pulse with respect to the supercontinuum pulse pair. This redundancy can be
used to enhance the timing accuracy, as will be shown below.
In a timing jitter measurement, one records for each X-ray pulse an optical spectrum with a constant width,
but whose central portion moves together with its boundaries to lower and higher wavelengths, depending on
the temporal overlap of each individual X-ray pulse with the supercontinuum pulse pair in the sample. The
arrival time for each X-ray pulse can be retrieved by precisely determining the spectral wavelength position of
each rising and falling edge of the interferometric signal. For this, it is required to map each optical wavelength,
and, thus, each detector pixel of the spectrometer into the time domain. The resulting time axis is a function of
the chirp of the supercontinuum pulse. To reliably convert the wavelength, or detector pixel values, to a time
axis, we operated the interferometric setup with the optical 400 nm excitation laser pulse instead of the X-ray
pulse. Since the supercontinuum and the 400 nm pulses originate from the same source, their residual timing
jitter is sufficiently small, such that the arrival time between these pulses can be precisely adjusted with an opti-
cal delay line ( t2 in Fig. 1). We recorded 50 individual interference spectra for each of the 48 different time
Scientific Reports | (2021) 11:3562 | https://doi.org/10.1038/s41598-021-82597-3 4
Vol:.(1234567890)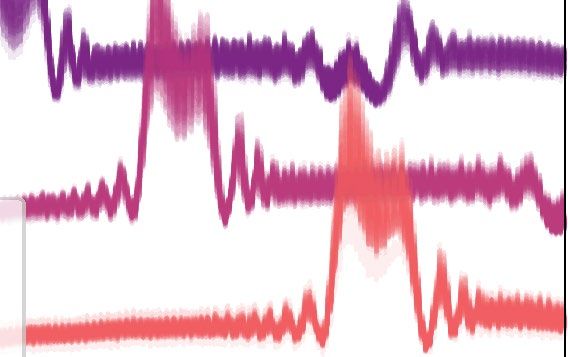
www.nature.com/scientificreports/

                                                          wavelength /nm                                                                                          wavelength /nm
                       358                  368   379     389 400 410          421    431     442                                   379              384   388    393 397 401      406    410    415

                                       a)                                                                                                       b)
               intensity /arb. units

                                                                                                                       counts /arb. units
                                              350.0 fs
                                              -150.0 fs
                                              -650.0 fs
                                              -1150.0 fs

                                0           250   500      750 1000 1250 1500 1750                                                  600              700    800    900 1000 1100         1200   1300
                                                           detector pixel                                                                                         detector /pixel

                                                          wavelength /nm                                                                                          wavelength /nm
                        379                 384   388     393 397 401          406    410     415                        358 368                           379    389 400 410      421    431    442
                                                                                                                       1.5
                                       c)                                                                                   d)

                                                                                                                       1.0
           counts /arb. units

                                                                                                    relativ time /ps
                                                                                                                       0.5

                                                                                                                       0.0

                                                                                                                       0.5
                                                                cen l
                                                     cen t                                                             1.0

                                                                                                                       1.5
                        600                 700     800       900 1000 1100          1200    1300                                           0        250   500    750 1000 1250 1500 1750
                                                             detector pixel                                                                                       detector pixel

                                                        Figure 2.  Calibration of the interferometric arrival time measurement setup, utilising a 90 µm thick SiO2
                                                        plate and laser pulses at a wavelength of 400 nm from the same laser system as used for the supercontinuum
                                                        generation. At each time delay of the 400 nm and the supercontinuum pulses 50 spectra are recorded, which
                                                        move from higher to lower wavelengths for increasing time delay (a). Both edges of every recorded spectrum
                                                        are then fitted using Eq. (1), with one example shown in (b) with leading (blue) and trailing (orange) edge fits.
                                                        The centre of the error function is indicated by the dot. The 50 individual pump-probe events produce an edge
                                                        position within a standard deviation of 8 pixels as indicated by the vertical rectangles in (c). The mapping of
                                                        detector pixels and thus wavelength to femtosecond time delay (d) results in a calibration constant of 1.8 pixel/fs
                                                        in the very red part and 1 pixel/fs in the blue part of the recorded spectral range.

                                                        delays in 100 fs steps, corresponding to 15 µm steps of the delay line. Four time delays are illustrated in Fig. 2a.
                                                        Polycrystalline SiO 2 with a thickness of 90 µm was used for these calibration measurements instead of the flat
                                                        sheet jet. The solid sample was chosen for its simple setup, but also to eliminate additional timing jitter, which
                                                        potentially could be caused by a fluctuating liquid jet. In a stark contrast to the X-ray induced interferometric
                                                        timing signal illustrated in Fig 1d, the laser induced interferometric timing signal looks different. Due to the
                                                        large bandgap of SiO2 of 8.9 eV, a non-linear absorption of the 400 nm optical pump pulse is needed to gener-
                                                        ate one conduction band electron. Thus, the optical induced electron density is smaller than the X-ray induced
                                                        electron density, resulting in a weaker, nearly not detectable, interferometric timing signal. The optical signal is
                                                        dominated by two coherent artifacts at the spectral position where the leading and trailing edges of the X-ray
                                                        induced interferometric signal would be expected.
                                                            The mapping of wavelengths (or detector pixel) into the time domain is determined by evaluating the edge
                                                        position for each spectrum of a single time delay, using Eq. (1) to fit the edges, as shown in Fig. 2b. The analysis
                                                        of all 50 shots at one fixed time delay yields an error of  cenl = 2.2 pixels FWHM for the leading edges and  cent
                                                        = 1.5 pixels FWHM for the trailing edges (indicated by the vertical shaded rectangles in the example in Fig. 2c.
                                                        Together with the error bars of the error function center parameter, the overall uncertainty of the time calibra-
                                                        tion accumulates to ± 6 fs FWHM. The entire set of calibration points for converting wavelengths into a relative
                                                        time delay for each leading and trailing edge is fitted with a second order polynomial function, where time zero

Scientific Reports |                         (2021) 11:3562 |                https://doi.org/10.1038/s41598-021-82597-3                                                                              5

                                                                                                                                                                                                Vol.:(0123456789)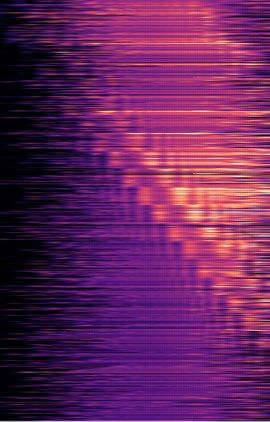
www.nature.com/scientificreports/
wavelength /nm distance /µm relative time /fs
433415 397 379 361 41 1002 1963 2924 3885 1000 500 0 500 1000
a) b) c)
arb. units
4000
X-ray pulse number
3000
d)
2000
arb. units
1000
0
1000 0 1000 1000 0 1000 1000 500 0 500 1000
relative time /fs relative time /fs relative time /fs
Figure 3. Raw data of the interferometric timing tool (a) and SACLA spatial encoding timing tool (b), recorded
for 5000 X-ray pulses at low fluence. Five consecutive X-ray arrival time measurements and corresponding fits
for the interferometric timing tool (c) and SACLA timing tool (d) are shown, displaying the same sequence of
events from top to bottom traces, revealing the same overall trend.
is set arbitrarily to the centre of the detector. It delivers the calibration curve for this timing tool (Fig. 2d), which
results in the aforementioned wavelength-dependent accuracy to determine a time point within a precision of
±2 fs for any given detector pixel.
Arrival time measurements. An actual liquid chemistry experiment was prepared by using a 100 mM
aqueous solution of sodium iodide as the target sample, which upon focused 400 nm optical laser excitation
generates nascent iodine r adicals48. The goal of this experiment is to demonstrate the reliable operation of the
interferometric timing scheme in the same sample used for the scientific experiment, in particular that it deliv-
ers accurate arrival time information for each X-ray pulse in the presence of an additional intense laser stimu-
lus. Therefore, this scheme will provide additional flexibility towards a variety of samples used in liquid phase
structural dynamics experiments. Since we expected an increased sensitivity of this scheme to extract accurate
arrival time information, we attenuated the X-ray pulses with a 50 µm thick Al foil, transmitting only one tenth
of the original pulse energy, i.e. 30 µJ. Even under these conditions and using a relatively large X-ray spot size
of 100 µm on the sample and a corresponding X-ray power density of 2 TW/cm 2 , a clear timing signal is meas-
ured, shown in Fig. 3a. The simultaneously recorded data of the established SACLA timing tool based on spatial
encoding (Fig. 3b) has been analysed using Eq. (1) without the sine contribution (see “Methods” and ref.29) to
determine the edge positions and thus the relative arrival times. With the reported42 dimensions of the line focus
for the SACLA spatial encoding scheme (3 µm × 780 µm), using roughly two percent of the original X-ray pulse
energy split from the main beam with a silicon grating, the X-ray power density of 5 TW/cm2 is higher than the
2 TW/cm used for the interferometric timing tool. In this comparison study, 5000 individual X-ray pulses were
recorded with each timing tool. In Fig. 3c five consecutive time arrival measurements with the interferometric
timing tool are shown. The identical X-ray pulse arrival time measurements with the SACLA timing tool is
shown in Fig. 3d.
We observe a very good correlation (Fig. 4) with a Pearson correlation v alue49,50 (see Eq. (2) in “Methods”)
of 0.98 for 89% of the data, when comparing the arrival times measured with both timing tools. The remaining
11% of the data did not yield a trustworthy measurement of the timing signal, mainly due to occasional low
X-ray pulse energy shots for the spatial encoding scheme, but also due to occasional and random disturbances
of the flat sheet liquid jet, which scattered the optical beam away from the spectrometer entrance. Those X-ray
arrival time measurements where the parameter defining the center position of the fitting function, in either of
the two timing tools, had an error larger than 3σ , where rejected from the analysis.
In a perfect correlation, i.e. a Pearson value of 1, all data points would lie on the orange diagonal line in Fig. 4,
such that any deviation from this line is a measure for the uncertainty between the two schemes, resulting to
about 39 fs FWHM (inset in Fig. 4). A major contribution to the residual timing jitter can be caused by the flat
sheet liquid jet. In such systems with connections to powerful liquid pumps, mechanical vibrations can never
be fully prevented. Spatial oscillations of the liquid flat sheet along the X-ray axis can introduce an additional
timing jitter, not recognised by the remote SACLA timing tool. In our configuration, with an angle between the
X-ray and optical pulses of 10◦ , a spatial oscillation of ± 350 µm would be enough to introduce the measured
residual timing jitter.
The arrival time distribution itself (or the jitter) measured by the interferometric encoding and SACLA spa-
tial encoding deliver the histograms shown in Fig. 4 with almost identical FWHM values of (513 ± 22) fs and
(510 ± 39) fs for the interferometric encoding and the spatial encoding scheme, respectively. The relative large
error in this particular measurement is caused by the low X-ray pulse energy which in turn generates timing
signals with a rather small amplitude, thus the fitting function residuals are larger. In addition, we confirmed
Scientific Reports | (2021) 11:3562 | https://doi.org/10.1038/s41598-021-82597-3 6
Vol:.(1234567890)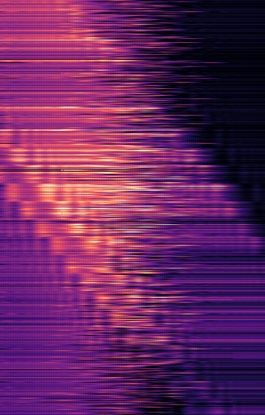
www.nature.com/scientificreports/

                                  Figure 4.  Correlation between interferometric and SACLA spatial encoding timing tools. The arrival
                                  times retrieved from the interferometric encoding are plotted on the x-axis while the arrival time data of
                                  SACLA spatial encoding is plotted on the y-axis. Above and right of the main axes the distributions of the
                                  interferometric data and the spatial encoded data is shown. The inset shows the residual arrival time jitter
                                  between the two timing tools.

                                  that without the Al attenuator the interferometric signal strength increases by the same factor of ten as the X-ray
                                  pulse intensity, thus confirming operation in the linear regime.
                                      We believe that the interferometric encoding measurement should deliver a more precise arrival time infor-
                                  mation for a pump-probe experiment, since it operates directly on the sample. This could be demonstrated in
                                  an experiment, where the selected sample develops a very steep femtosecond response upon photo-excitation.
                                  Correcting the measured time trace for every timing point from each timing tool would then deliver a signal
                                  with possibly different rise times. The timing tool yielding the shorter rise time would then quantify its increased
                                  accuracy. Although such a study could not be performed in the current experimental campaign, we first con-
                                  firmed its utility for this situation as stand-alone timing tool at the sample position. We guided an intense (≈
                                  100 TW/cm 2 ) 400 nm optical beam onto the liquid jet together with the X-ray pulses in order measure the
                                  relative arrival time between the 400 nm pump and X-ray probe beams. In this arrangement, the X-ray pulse,
                                  which is used as a pump pulse for the arrival time measurement, simultaneously would serve as the probe pulse
                                  during a liquid chemistry experiment, where the dynamics in the sample are initiated with the additional intense
                                  400 nm pulse. The X-ray arrival time monitor then needs to be operational even in the presence of that additional
                                  intense 400 nm pump pulse, which could potentially distort the arrival time measurement. To investigate the
                                  influence of the additional 400 nm stimulus, we performed another arrival time measurement with fixed timing
                                  between the X-ray and supercontinuum double pulses, while scanning the additional intense pump pulse from
                                  − 1500 fs to 1000 fs (Fig. 5a). For each time delay setting, 200 supercontinuum probe pulses were recorded. The
                                  X-ray induced arrival time regions are framed in orange (leading edges) and purple (trailing edges). The intense
                                  400 nm pulses act similar to the X-ray pulses, such that each pulse creates its own distinct plateau shape in the
                                  supercontinuum double pulse interferometric timing tool due to the altered transient refractive index of the
                                  sample. The leading (pink) and trailing (gray-blue) edges of the 400 nm stimulus timing signal are indicated in
                                  a) for each single pulse. Since the 400 nm and supercontinuum pulses used for the timing tool are generated from
                                  the same source, they are practically jitter free, and, thus the recorded timing jitter of the 400 nm induced timing
                                  signal should be very small. In consequence, both timing signals can overlap during a time delay scan, which is
                                  most apparent when their respective edges cross each other, i.e. when both stimulating pulses (400 nm pump
                                  and X-ray) arrive simultaneously. In Fig. 5a, three distinct delay times for the 400 nm pump beam are indicated
                                  with white boxes. At each of these delay settings, either the trailing edge, both edges or the leading edge of the
                                  X-ray-induced timing signal overlaps with one or both edges of the optically induced timing signal. This initially
                                  leads to an increased uncertainty in the determination of those X-ray arrival times (Fig. 5, right panels). The
                                  distributions in the right panel show, similar to the inset in Fig. 4, the residual jitter between the interferometric
                                  timing tool and the SACLA timing tool, which again serves as reference. We found the accuracy limited to about
                                  twice the individual uncertainty of approximately 20 fs, however, further analysis can mitigate this increased
                                  uncertainty, either by simply selecting the unaffected edge to analyse or by adding more detailed knowledge into
                                  the edge shape do distinguish the 400 nm stimulus timing signal from the X-ray timing signal, when both are
                                  overlapped. The latter is only absolutely required at the point in time, where the X-ray and the 400 nm pulses
                                  arrive simultaneously. In all other cases where the X-ray pulse and 400 nm stimulus pulse are separated by more
                                  than ≈20 fs, we always find an undisturbed edge for a precise arrival time determination, as shown in Fig. 5d,e.
                                  We analysed the arrival times of the 400 nm optical pulses for each delay in a similar way we analysed the X-ray
                                  pulses, with the resulting edge positions indicated by the dots in Fig. 5a. The edge position temporal jitter is
                                  shown in Fig 5h for all leading (pink) and trailing (gray-blue) edges, within the single delays. When the 400 nm
                                  stimulus is set to arrive approximately 1 ps earlier or later in time compared to the X-ray pulses, the arrival time
                                  jitter of the 400 nm pulses is 7 fs FWHM and by this similar to the calibration error without X-ray pulses. As
                                  the relative time delays between X-ray and 400 nm stimulus approach each other it becomes more and more

Scientific Reports |   (2021) 11:3562 |                https://doi.org/10.1038/s41598-021-82597-3                                                     7

                                                                                                                                                 Vol.:(0123456789)
www.nature.com/scientificreports/

                                            Figure 5.  Raw data (a) of the interferometric timing tool with an additional intense 400 nm stimulus for an
                                            actual liquid chemistry experiment. The 400 nm pump pulses were delayed from − 1500 fs to + 1000 fs with
                                            respect to the X-ray arrival times. The additional timing signals induced by the 400 nm stimulus are indicated
                                            by the pink (leading edges) and gray-blue (trailing edges) dots. The X-ray induced leading and trailing edge
                                            regions are indicated by the orange and purple framed area. Residual timing jitter between the leading (b–d)
                                            and trailing (e–g) X-ray induced interferometric edges and the SACLA spatial encoding timing tool at selected
                                            time delays. The selected delays are indicated by the white boxes. For (b) and (e) shots 6600–6800, for (c) and
                                            (f) shots 3600–3800 and for (d) and (g) shots 600–800 were analysed. The precision with which the 400 nm
                                            induced leading (red) and trailing (green) timing edges can be determined is shown in (h).

                                            challenging to disentangle the respective timing signals, which leads to an increased uncertainty in measuring
                                            the X-ray pulse arrival times as described before, but also in measuring the 400 nm stimulus arrival signals. The
                                            maximal uncertainty, when both pulses are exactly overlapped in time, is approximately 45 fs FWHM. A double
                                            Gaussian function was fitted to the data in Fig. 5h with the two peaks centered at the mean edge positions of the
                                            leading and trailing interferometric X-ray induced timing edges. The widths of the two Gaussians are fixed to the
                                            experimentally measured FWHM arrival time jitter of the X-ray pulses of 513 fs. In addition, one can even use
                                            the 400 nm stimulus timing signal imprinted in the X-ray arrival time measurement to obtain the actual detec-
                                            tor pixel, i.e. wavelength, to time mapping. This could potentially be useful in certain measurement campaigns,
                                            where data is accumulated over a long time and delay scans are repeated to gain more statistics. In such a case
                                            a change in the chirp of the supercontinuum could potentially be recognized during the measurement and the
                                            time calibration could be adjusted accordingly without the need to abort the actual experiment.
                                                Another notable feature of the recorded interference pattern of the supercontinuum double pulse is that it
                                            contains in-situ information about the actual flat sheet thickness of the free-flowing liquid jet. This informa-
                                            tion is obtained within the picosecond short time span of the supercontinuum passing through the flat sheet
                                            jet. Close to the leading and trailing edges additional oscillations caused by thin film interference are observed
                                            (e.g. Fig. 2b,c, which we use to extract the liquid jet thickness (see “Methods” and Supplementary Information
                                            for a detailed discussion). Since the interference pattern used for the thickness measurement is taken exactly
                                            during the pump-probe shot and at the very same lateral position as the time-resolved laser-pump/X-ray probe
                                            measurement, this information can be useful in additional a posteriori corrections of the longitudinal dimension
                                            of the interacting sample volume.

                                            Conclusions
                                            We have implemented a novel scheme to measure the relative arrival time between hard X-ray pulses from
                                            an FEL and optical laser pulses directly on the sample that was simultaneously under investigation in a time-
                                            resolved X-ray pump/optical probe experiment. We determined a timing accuracy of 22 fs at worst, i.e. for the
                                            lowest X-ray pulse energies. This is sufficient to reliably correct the different arrival times in comparison to the
                                            inherent timing jitter between the FEL and optical laser pulses at the SACLA facility under the circumstances
                                            of our experiment. The correlation with the existing SACLA timing tool is excellent, while both methods yield

          Scientific Reports |   (2021) 11:3562 |                https://doi.org/10.1038/s41598-021-82597-3                                                   8

Vol:.(1234567890)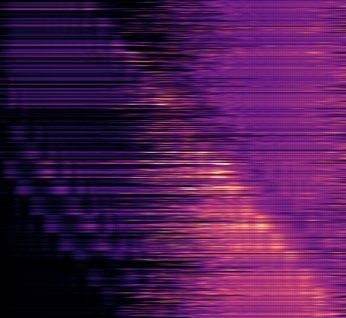
www.nature.com/scientificreports/
arrival time distributions (timing jitter) of around 500 fs FWHM, even in a measurement where we attenuated
the X-ray pulse intensities by a factor of ten. The small difference in the observed arrival time distributions can
be explained by additional jitter sources between both optical laser paths to the two arrival time monitors, which
are located a few metres apart from each other. Therefore, we expect a more reliable timing precision, when
measured directly on the sample of interest as in our case. In a second measurement it was demonstrated that
an additional intense optical laser pulse can serve as a sample stimulus in a liquid-phase structural dynamics
experiment, while the interferometric encoding approach still delivers accurate in-situ time arrival informa-
tion. A full description of the involved electron cascading and propagation of the optical pulses, and details of
the estimated change of refractive index upon X-ray and potentially simultaneous intense optical irradiance is
subject of a future study. In order to evaluate the ultimate performance of our tool one would need to compare
the corrected timing data in a time-delay scan with a time-dependent X-ray probe signal with all timing tools
available. In an experiment, based on photo-emission of an electron, one would measure a sharp rise after time
zero, which would allow to compare the arrival time-corrected rise times with each tool individually, with the
goal to identify the superior arrival time monitoring by the shorter rise time. Furthermore, such a study would
then yield detailed data about the remaining timing jitter for timing diagnostics located further away from the
actual experiment. Finally, the analysis of the interference pattern in our arrival time signal additionally allows
to derive the thickness of the liquid sheet jet for every laser pulse, potentially allowing for additional correction
of a pump-probe signal due to thickness fluctuations in case of sample delivery by a liquid jet. The utilisation of
a free-flowing liquid jet for in-situ arrival time measurement promises applicability in liquid chemistry experi-
ments at MHz repetition rate XFEL facilities.
Methods
Fit functions. The fit function used to determine the leading and trailing edge positions of the spectrum
measured with the interferometric timing tool is a superposition of a Gaussian error function (describing the
rising and falling steps) and a sine function (describing the interference between front and back surfaces) as a
function of the detector pixel x (describing the wavelength of the recorded light):
x−µ
f (x) = F 1 + erf + A sin(ν(x − φ)) + C. (1)
σ
The fitting parameters for the Gaussian error function are its amplitude F, centre of the step µ and width of the
step σ . It thus describes the interferometric signal onset and cut-off. The position µ of the half-rise value of the
error function fit is used to define the arrival time of the X-ray pulse.
The sine function describes the oscillations caused by thin film interference from the front and back surfaces
by the supercontinuum traversing the sample. These oscillations can be exploited to determine the jet’s thickness
in-situ and for every single shot (see Supplementary Information).
Pearson correlation. The correlation between two measurements X and Y can be quantified by the Pearson
correlation ρ (refs.49,50):
cov(X, Y )
ρX,Y = (2)
σX σY
where cov(X, Y) is the covariance of the two measurements and σX and σY their standard deviation. A Pearson
correlation of ρX,Y = 1 corresponds to a perfect correlation and a value of 0 to a completely uncorrelated meas-
urement. We use this relation to quantify the correlation between the interferometric and the spatial timing
tools in a direct comparison study.
Free‑flowing flat‑sheet liquid jet characterization. The free-flowing liquid jet system (Microliquids
GmbH, Göttingen) produces a thin, flat sheet of liquid based on the collision of two round jets under an angle
of 30◦ to 50◦ , each with selected diameters of a few tens of micrometres. Adjustments of the backing pressure,
the selected nozzle diameter, the relative position and angle of each nozzle, each influences the shape, thickness,
flatness and stability of the sheet, allowing a precise control as a function of the viscosity of the liquid. With
this, adjustable flat sheet thicknesses from about 2 µm to 300 µm are realised. We used two glass nozzles with
100 µm diameter orifices and a volumetric flow rate of up to 80 ml/min. (corresponding to flat sheet speeds up
to 60 m/s, see below) using a commercial HPLC pump (Shimadzu LC-20AP), resulting in a leaf-shaped area of
the flat sheet of about 0.5 × 5 mm 2 (horizontal × vertical dimensions) with a thickness of below 20 µm (Supple-
mentary Fig. S1). This type of liquid jet had been originally developed for soft X-ray spectroscopy experiments32,
including appropriate vacuum environments (approx. 10−3 mbar). However, we optimised the setup for ambient
conditions or helium atmospheres as typically used at hard X-ray instruments. In particular, due to the high
volumetric flow rate, a catcher assembly enables the recycling of the sample solution with a minimum total
sample volume of approximately 50 ml.
Data and code availability
The data and code that supports the findings of this study are available from the corresponding author(s) upon
reasonable request.
Scientific Reports | (2021) 11:3562 | https://doi.org/10.1038/s41598-021-82597-3 9
Vol.:(0123456789)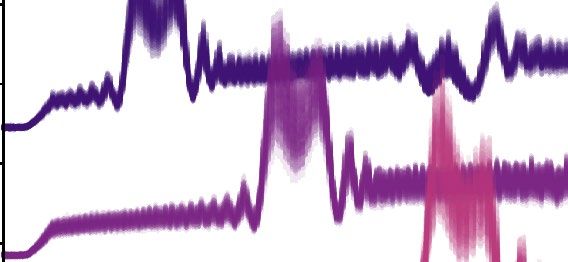
www.nature.com/scientificreports/
Received: 27 September 2020; Accepted: 21 January 2021
References
1. Emma, P. et al. First lasing and operation of an Ångstrom-wavelength free-electron laser. Nat. Photonics 4, 641–647. https://doi.
org/10.1038/nphoton.2010.176 (2010).
2. Ishikawa, T. et al. A compact X-ray free-electron laser emitting in the sub-ångström region. Nat. Photonics 6, 540–544. https://doi.
org/10.1038/nphoton.2012.141 (2012).
3. Kang, H.-S. et al. Hard X-ray free-electron laser with femtosecond-scale timing jitter. Nat. Photonics 11, 708–713. https://doi.
org/10.1038/s41566-017-0029-8 (2017).
4. Milne, C. J. et al. SwissFEL: The Swiss X-ray Free Electron Laser. Appl. Sci.https://doi.org/10.3390/app7070720 (2017).
5. Decking, W. et al. A MHz-repetition-rate hard X-ray free-electron laser driven by a superconducting linear accelerator. Nat.
Photonics 14, 391–397. https://doi.org/10.1038/s41566-020-0607-z (2020).
6. Zhang, W. et al. Tracking excited-state charge and spin dynamics in iron coordination complexes. Nature 509, 345–348. https://
doi.org/10.1038/nature13252 (2014).
7. Lemke, H. T. et al. Coherent structural trapping through wave packet dispersion during photoinduced spin state switching. Nat.
Commun. 8, 15342. https://doi.org/10.1038/ncomms15342 (2017).
8. Chapman, H. N. et al. Femtosecond X-ray protein nanocrystallography. Nature 470, 73–77. https://doi.org/10.1038/nature09750 (2011).
9. Löhl, F. et al. Electron bunch timing with femtosecond precision in a superconducting free-electron laser. Phys. Rev. Lett. 104,
144801. https://doi.org/10.1103/PhysRevLett.104.144801 (2010).
10. Xin, M., Şafak, K. & Kärtner, F. X. Ultra-precise timing and synchronization for large-scale scientific instruments. Optica 5,
1564–1578. https://doi.org/10.1364/OPTICA.5.001564 (2018).
11. Cinquegrana, P. et al. Optical beam transport to a remote location for low jitter pump-probe experiments with a free electron laser.
Phys. Rev. Special Top. 17, 040702. https://doi.org/10.1103/PhysRevSTAB.17.040702 (2014).
12. Byrd, J. M. et al. Femtosecond Synchronization of Laser Systems for the LCLS. In Proceedings of the 1st International Particle
Accelerator Conference (IPAC’10): Kyoto, Japan, May 23–28, 2010, MOOCRA03 (2010).
13. Schulz, S. et al. Femtosecond all-optical synchronization of an X-ray free-electron laser. Nat. Commun. 6, 5938. https://doi.
org/10.1038/ncomms6938 (2015).
14. Viti, M. et al. The Bunch Arrival Time Monitor at FLASH and European XFEL. In Proceedings of the 16th International Confer-
ence on Accelerator and Large Experimental Physics Control Systems (ICALEPCS 2017): Barcelona, Spain, October 8–13, 2017,
TUPHA125, https://doi.org/10.18429/JACoW-ICALEPCS2017-TUPHA125 (2018).
15. Bressler, C. & Chergui, M. Ultrafast X-ray absorption spectroscopy. Chem. Rev. 104, 1781–1812. https://doi.org/10.1021/cr020
6667 (2004).
16. Prinz, S. et al. Active pump-seed-pulse synchronization for OPCPA with sub-2-fs residual timing jitter. Opt. Express 22, 31050–
31056. https://doi.org/10.1364/OE.22.031050 (2014).
17. Casanova, A., D’Acremont, Q., Santarelli, G., Dilhaire, S. & Courjaud, A. Ultrafast amplifier additive timing jitter characterization
and control. Opt. Letters 41, 898–900. https://doi.org/10.1364/OL.41.000898 (2016).
18. Klingebiel, S. et al. Experimental and theoretical investigation of timing jitter inside a stretcher-compressor setup. Opt. Express
20, 3443–3455. https://doi.org/10.1364/OE.20.003443 (2012).
19. Bionta, M. R. et al. Spectral encoding of x-ray/optical relative delay. Opt. Express 19, 21855–21865. https://doi.org/10.1364/
OE.19.021855 (2011).
20. Schorb, S. et al. X-ray-optical cross-correlator for gas-phase experiments at the linac coherent light source free-electron laser. Appl.
Phys. Lett. 100, 121107. https://doi.org/10.1063/1.3695163 (2012).
21. Krupin, O. et al. Temporal cross-correlation of x-ray free electron and optical lasers using soft x-ray pulse induced transient
reflectivity. Opt. Express 20, 11396–11406. https://doi.org/10.1364/OE.20.011396 (2012).
22. Hartmann, N. et al. Sub-femtosecond precision measurement of relative X-ray arrival time for free-electron lasers. Nat. Photonics
8, 706–709. https://doi.org/10.1038/nphoton.2014.164 (2014).
23. Harmand, M. et al. Achieving few-femtosecond time-sorting at hard X-ray free-electron lasers. Nat. Photonics 7, 215–218. https
://doi.org/10.1038/nphoton.2013.11 (2013).
24. Frühling, U. et al. Single-shot terahertz-field-driven X-ray streak camera. Nat. Photonics 3, 523–528. https: //doi.org/10.1038/nphot
on.2009.160 (2009).
25. Grguraš, I. et al. Ultrafast X-ray pulse characterization at free-electron lasers. Nat. Photonics 6, 852–857. https://doi.org/10.1038/
nphoton.2012.276 (2012).
26. Gorgisyan, I. et al. THz streak camera method for synchronous arrival time measurement of two-color hard X-ray FEL pulses.
Opt. Express 25, 2080–2091. https://doi.org/10.1364/OE.25.002080 (2017).
27. Beye, M. et al. X-ray pulse preserving single-shot optical cross-correlation method for improved experimental temporal resolution.
App. Phys. Lett. 100, 121108. https://doi.org/10.1063/1.3695164 (2012).
28. Riedel, R. et al. Single-shot pulse duration monitor for extreme ultraviolet and x-ray free-electron lasers. Nat. Commun. 4, 1731.
https://doi.org/10.1038/ncomms2754 (2013).
29. Sato, T. et al. Highly efficient arrival timing diagnostics for femtosecond X-ray and optical laser pulses. Appl. Phys. Express 8,
012702. https://doi.org/10.7567/apex.8.012702 (2014).
30. Bionta, M. R. et al. Spectral encoding method for measuring the relative arrival time between x-ray/optical pulses. Rev. Sci. Instrum.
85, 083116. https://doi.org/10.1063/1.4893657 (2014).
31. Coffee, R. N. et al. Development of ultrafast capabilities for X-ray free-electron lasers at the linac coherent light source. Philos.
Trans. R. Soc. A 377, 20180386. https://doi.org/10.1098/rsta.2018.0386 (2019).
32. Ekimova, M., Quevedo, W., Faubel, M., Wernet, P. & Nibbering, E. T. J. A liquid flatjet system for solution phase soft-x-ray spec-
troscopy. Struct. Dyn. 2, 054301. https://doi.org/10.1063/1.4928715 (2015).
33. Altarelli, M. The European X-ray free-electron laser facility in Hamburg. Nuclear Instruments and Methods in Physics Research
Section B: Beam Interactions with Materials and Atoms 269, 2845–2849, 10.1016/j.nimb.2011.04.034 (2011). Proceedings of the
10th European Conference on Accelerators in Applied Research and Technology (ECAART10): Athens, Greece, September 13-17,
2010.
34. Halavanau, A., Decker, F.-J., Emma, C., Sheppard, J. & Pellegrini, C. Very high brightness and power LCLS-II hard X-ray pulses.
J. Synchrotron Radiat. 26, 635–646. https://doi.org/10.1107/S1600577519002492 (2019).
35. Robinson, I. et al. Towards single particle imaging of human chromosomes at SACLA. J. Phys. B 48, 244007. https://doi.
org/10.1088/0953-4075/48/24/244007 (2015).
36. Galler, A. et al. Scientific instrument Femtosecond X-ray Experiments (FXE): Instrumentation and baseline experimental capabili-
ties. J. Synchrotron Radiat. 26, 1432–1447. https://doi.org/10.1107/S1600577519006647 (2019).
37. Khakhulin, D. et al. Ultrafast X-ray Photochemistry at European XFEL: Capabilities of the Femtosecond X-ray Experiments (FXE)
Instrument. Appl. Sci. 10, 995. https://doi.org/10.3390/app10030995 (2020).
Scientific Reports | (2021) 11:3562 | https://doi.org/10.1038/s41598-021-82597-3 10
Vol:.(1234567890)www.nature.com/scientificreports/
38. Yabashi, M., Tanaka, H., Tono, K. & Ishikawa, T. Status of the SACLA facility. Appl. Sci. 7, 604. https: //doi.org/10.3390/app706 0604
(2017).
39. Katayama, T. et al. X-ray optics for advanced ultrafast pump-probe X-ray experiments at SACLA. J. Synchrotron Radiat. 26, 333–338.
https://doi.org/10.1107/S1600577518018362 (2019).
40. Tono, K. et al. Beamline, experimental stations and photon beam diagnostics for the hard x-ray free electron laser of SACLA. New
J. Phys. 15, 083035. https://doi.org/10.1088/1367-2630/15/8/083035 (2013).
41. Yabashi, M., Tanaka, H. & Ishikawa, T. Overview of the SACLA facility. J. Synchrotron Radiat. 22, 477–484. https: //doi.org/10.1107/
S1600577515004658 (2015).
42. Katayama, T. et al. A beam branching method for timing and spectral characterization of hard X-ray free-electron lasers. Struct.
Dyn. 3, 034301. https://doi.org/10.1063/1.4939655 (2016).
43. Mertz, L. Spectromètre stellaire multicanal. J. Phys. Radium 19, 233–236. https://doi.org/10.1051/jphysrad:01958001903023300
(1958).
44. A’Hearn, M. F., Ahern, F. J. & Zipoy, D. M. Polarization Fourier spectrometer for astronomy. Appl. Opt. 13, 1147–1157. https://
doi.org/10.1364/AO.13.001147 (1974).
45. Trushin, S. A., Kosma, K., Fuß, W. & Schmid, W. E. Sub-10-fs supercontinuum radiation generated by filamentation of few-cycle
800 nm pulses in argon. Opt. Lett. 32, 2432–2434. https://doi.org/10.1364/OL.32.002432 (2007).
46. Medvedev, N. Femtosecond X-ray induced electron kinetics in dielectrics: Application for FEL-pulse-duration monitor. Appl.
Phys. B 118, 417–429. https://doi.org/10.1007/s00340-015-6005-4 (2015).
47. LaVerne, J. A., Štefanić, I. & Pimblott, S. M. Hydrated electron yields in the heavy ion radiolysis of water. J. Phys. Chem. A 109,
9393–9401. https://doi.org/10.1021/jp0530303 (2005).
48. Pham, V.-T. et al. Probing the transition from hydrophilic to hydrophobic solvation with atomic scale resolution. J. Am. Chem.
Soc. 133, 12740–12748. https://doi.org/10.1021/ja203882y (2011).
49. Spiegel, M. R. & Stephens, L. J. Statistics Schaum’s Outlines (McGraw-Hill Education, New York, 2017).
50. Freedman, D., Pisani, R. & Purves, R. Statistics: Fourth International Student. (W. W. Norton & Company, New York, 2007).
Acknowledgements
This work is supported by the Deutsche Forschungsgemeinschaft (DFG) via the Cluster of Excellence ‘The
Hamburg Centre for Ultrafast Imaging’ -EXC1074- project ID 194651731 and via SFB925 (TP A4), and by
European XFEL. The flat sheet liquid jet system was financed by the German Federal Ministry of Education and
Research (BMBF, contract no. 05K16PE1). S.S., A.G., and C.Br. acknowledge support from the European Cluster
of Advanced Laser Light Sources (EUCALL) project which had received funding from the European Union’s
Horizon 2020 research and innovation programme under grant agreement No 654220. The XFEL experiments
were performed at the BL3 of SACLA with the approval of the Japan Synchrotron Radiation Research Institute
(JASRI) (Proposal No. 2017A8072). The authors thank Prof. Thomas Feurer for fruitful discussions, whose
insights into optics and related experimental fields made this experiment possible.
Author contributions
M.D., S.S., and A.G. planned and coordinated the measurement campaign. C.Br. and A.G. conceived the in-situ
experiment with sample and timing tool. N.H., A.G. and R.N.C. conceived the interferometric setup as a sensi-
tive timing tool. S.S. prepared and characterised the flat-sheet liquid jet system. M.D., A.G., S.S., C.Bö., N.H.,
W.H., R.H. and M.S.W. performed the experiments at the SACLA XFEL facility, including the setup of the optical
timing tool instrumentation. T.K., To.S., Ta.S. and M.Y. were involved in beamline control and integration. M.D.
analysed the data, M.D., S.S., A.G. and C.Br. interpreted the data, and M.D., S.S. and C.Br. wrote the manuscript
with contributions from all authors.
Funding
Open Access funding enabled and organized by Projekt DEAL.
Competing interests
The authors declare no competing interests.
Additional information
Supplementary Information The online version contains supplementary material available at https://doi.
org/10.1038/s41598-021-82597-3.
Correspondence and requests for materials should be addressed to M.D., S.S. or C.B.
Reprints and permissions information is available at www.nature.com/reprints.
Publisher’s note Springer Nature remains neutral with regard to jurisdictional claims in published maps and
institutional affiliations.
Open Access This article is licensed under a Creative Commons Attribution 4.0 International
License, which permits use, sharing, adaptation, distribution and reproduction in any medium or
format, as long as you give appropriate credit to the original author(s) and the source, provide a link to the
Creative Commons licence, and indicate if changes were made. The images or other third party material in this
article are included in the article’s Creative Commons licence, unless indicated otherwise in a credit line to the
material. If material is not included in the article’s Creative Commons licence and your intended use is not
permitted by statutory regulation or exceeds the permitted use, you will need to obtain permission directly from
the copyright holder. To view a copy of this licence, visit http://creativecommons.org/licenses/by/4.0/.
© The Author(s) 2021
Scientific Reports | (2021) 11:3562 | https://doi.org/10.1038/s41598-021-82597-3 11
Vol.:(0123456789)You can also read


