A novel antioxidant ergothioneine PET radioligand for in vivo imaging applications
←
→
Page content transcription
If your browser does not render page correctly, please read the page content below

www.nature.com/scientificreports
OPEN A novel antioxidant ergothioneine
PET radioligand for in vivo imaging
applications
William J. Behof1,2, Clayton A. Whitmore1,2, Justin R. Haynes1,2, Adam J. Rosenberg1,2,
Mohammed N. Tantawy1,2, Todd E. Peterson1,2, Fiona E. Harrison3,6,10, Robert B. Beelman4 &
Wellington Pham1,2,5,6,7,8,9,10*
Ergothioneine (ERGO) is a rare amino acid mostly found in fungi, including mushrooms, with
recognized antioxidant activity to protect tissues from damage by reactive oxygen species (ROS)
components. Prior to this publication, the biodistribution of ERGO has been performed solely in vitro
using extracted tissues. The aim of this study was to develop a feasible chemistry for the synthesis
of an ERGO PET radioligand, [11C]ERGO, to facilitate in vivo study. The radioligand probe was
synthesized with identical structure to ERGO by employing an orthogonal protection/deprotection
approach. [11C]methylation of the precursor was performed via [11C]CH3OTf to provide [11C]ERGO
radioligand. The [11C]ERGO was isolated by RP-HPLC with a molar activity of 690 TBq/mmol. To
demonstrate the biodistribution of the radioligand, we administered approximately 37 MBq/0.1 mL
in 5XFAD mice, a mouse model of Alzheimer’s disease via the tail vein. The distribution of ERGO in
the brain was monitored using 90-min dynamic PET scans. The delivery and specific retention of
[11C]ERGO in an LPS-mediated neuroinflammation mouse model was also demonstrated. For the
pharmacokinetic study, the concentration of the compound in the serum started to decrease 10 min
after injection while starting to distribute in other peripheral tissues. In particular, a significant
amount of the compound was found in the eyes and small intestine. The radioligand was also
distributed in several regions of the brain of 5XFAD mice, and the signal remained strong 30 min post-
injection. This is the first time the biodistribution of this antioxidant and rare amino acid has been
demonstrated in a preclinical mouse model in a highly sensitive and non-invasive manner.
L-ergothioneine (ERGO) is a food-derived hydrophilic antioxidant available in fungi and various bacteria, but
not in animals or higher p lants1. It has been known as an antioxidant since its discovery a century ago from
fungi of the genus claviceps p urpurea2–4. Chemically, this rare betaine-based amino acid has a similar chemical
structure to histidine but with the presence of a sulfhydryl moiety on the imidazole ring. The molecule exists as
a tautomeric form between thioketone and thiol derivatives (Fig. 1), albeit the former predominates at physi-
ological pH5. Because plants and animals cannot produce ERGO, it must be obtained from the diet. Mushrooms,
in particular are a rich source of E RGO6–10. As an antioxidant agent ERGO is capable of preventing cell and tis-
sue damage, a key contributor to aging, by protecting against free radicals and oxidative s tress11–13. Its acquired
adaptive antioxidant capability for the protection of injured t issues2 could be the reason for the observations
that the highest concentration of ERGO are usually found in the red blood cells of old-age i ndividuals14, brain15,
liver16, kidney16, ocular tissues17, and injured tissues18. Additional evidence suggests that ERGO could target
mitochondria and dampen the excess of mitochondria-specific ROS in response to oxidative s tress19.
1
Vanderbilt University Institute of Imaging Science, Vanderbilt University Medical Center, Nashville, TN 37232,
USA. 2Department of Radiology and Radiological Sciences, Vanderbilt University Medical Center, Nashville,
TN 37232, USA. 3Department of Medicine, Diabetes, Endocrinology and Metabolism, Vanderbilt University
Medical Center, Nashville, TN 37232, USA. 4Department of Food Science, Center for Plant and Mushroom Foods
for Health, Penn State University, University Park, PA 16802, USA. 5Department of Biomedical Engineering,
Vanderbilt University, Nashville, TN 37235, USA. 6Vanderbilt Brain Institute, Vanderbilt University, Nashville,
TN 37232, USA. 7Vanderbilt Ingram Cancer Center, Nashville, TN 37232, USA. 8Vanderbilt Institute of Chemical
Biology, Vanderbilt University, Nashville, TN 37232, USA. 9Vanderbilt Institute of Nanoscale Science and
Engineering, Vanderbilt University, Nashville, TN 37235, USA. 10Vanderbilt Memory and Alzheimer’s Center,
Vanderbilt University Medical Center, Nashville, TN 37212, USA. *email: wellington.pham@vumc.org
Scientific Reports | (2021) 11:18450 | https://doi.org/10.1038/s41598-021-97925-w 1
Vol.:(0123456789)
www.nature.com/scientificreports/
Figure 1. Tautomerized isoforms of ERGO at physiological pH.
Figure 2. Retrosynthetic analysis of a precursor for generating a [ 11C]ERGO PET radioligand.
ERGO is also implicated in a number of neurological p athways20–23. Substantial research data indicate that
4
ERGO is a physiological antioxidant c ytoprotectant . Protection against cytotoxicity elicited by Cu (II), hydrogen
peroxide, iron, and sodium n itrite16,24–26 is derived from the conspicuous affinity of ERGO for metal cations, such
as Fe and Cu, permitting capture and neutralization of associated radicals27. It has been demonstrated that ERGO
concentration decreases significantly with age, and markedly lower levels were found in individuals with mild
cognitive impairment compared to the controls, supporting the potential for ERGO deficiency to act as a risk
factor for neurodegeneration28. It is worthwhile to mention that ERGO does not permeate the blood–brain barrier
(BBB); its uptake in cells is mediated by an OCTN1 (organic cation transporter novel, type 1) receptor29–32. Other
studies have shown that ERGO can protect neurons both in vitro and in vivo against a spectrum of s tressors33,34.
Taken altogether, these data strongly suggest that ERGO is involved in healthy aging, serving as a “longevity
vitamin”6,35. The term “vitamin” is used in here since ERGO is a micronutrient, that the body does not need a lot
of to function, but the material needs to be constantly available by uptake from an external source such as foods
or supplements and it therefore does fit into that category.
To date, all preclinical studies had relied solely on in vitro analysis of ERGO using analytical and bioassay
methods for analyzing the ERGO distribution from extracted t issues1,36,37. The same holds true for clinical studies
to validate the benefit of ERGO consumption in the diet; serum samples were collected for assessing the ERGO
levels38,39. This necessitated the development of an ERGO probe to facilitate non-invasive, real-time, and repeated
imaging of ERGO distribution and pharmacokinetics in preclinical and clinical settings. To this end, we report
herein for the first time on the development of a [ 11C]ERGO radioligand. Further, we demonstrated that this
antioxidant could be distributed and retained in the brain of a mouse model of Alzheimer’s disease, assuming
due to the inflammation in the local areas. And that observation was further confirmed using a mouse model
of LPS-induced neuroinflammation. The proof-of-principle PET imaging in this study showed that ERGO is
distributed across several subregions in the brains, albeit with much higher retention in pathological brains than
normal counterparts. Interestingly, the whole-body biodistribution study showed that ERGO is also distributed
significantly in the eyes and small intestine.
Results
Retrosynthesis analysis and development of precursor. Retrosynthetic analysis of [ 11C]CH3 labeled
ERGO suggests the precursor should have the thiol-histidine molecule with the dimethylamine site available
for labeling, while the rest of other functional groups should be uniformly blocked with acid-labile protection
groups (Fig. 2). They can thus be removed simultaneously as quickly as possible given the short half-life of [11C]
CH3. The next major transformation involves the insertion of the thiol group into the imidazole ring.
Figure 3 describes the successful synthesis of [ 11C]ERGO PET radiotracer 8. The preparation of intermediate
4 would take three steps starting from protected histidine 1 to set the stage for the crucial synthesis of compound
5. The formation of key intermediate 5 via dimethylation of the α-amino group was achieved selectively after
orthogonal protection of the other functional groups. When the solution of 5 in a mixture of water and diethyl
ether was treated with O-phenylchloro thionoformate in the presence of sodium bicarbonate and stirred over-
night at room temperature to furnish thioketone intermediate 6. Finally, the precursor 7 was synthesized by treat-
ing compound 6 with Boc anhydride to ensure all the active functional group are capped with acid labile groups.
With the precursor available, next, we labeled the ERGO precursor 7 with [11C]CH3 using a commercial
automated radiosynthesis module (GE TRACERlab FXc-Pro). The [11C]CO2 was converted to [ 11C]MeOTf using
the standard reaction conditions, reacted with precursor 7 at 80 °C, and subsequently deprotected under acidic
conditions to yield [11C]ERGO 8 (Supplementary data, Fig. S1). The [ 11C]ERGO was pH adjusted by passage
through an ion-retardation resin and used without further purification. The product was produced with an
excellent molar activity of 690 TBq/mmol.
Scientific Reports | (2021) 11:18450 | https://doi.org/10.1038/s41598-021-97925-w 2
Vol:.(1234567890)
www.nature.com/scientificreports/
Figure 3. Scheme of [ 11C]ERGO PET radioligand synthesis and characterization.
In vivo dynamic PET scanning of [11C]ERGO biodistribution in the brain. To test the distribution
of ERGO non-invasively in vivo, approximately 37 MBq/0.1 mL of [11C]ERGO probe was given to anesthe-
tized 5XFAD mice (8-month-old, n = 4) in single bolus intravenous (I.V.) injection via the lateral tail vein. The
administration of the probe was simultaneous with the start of a 90-min dynamic PET imaging, followed by
subsequent CT scan. The PET images were normalized to the injected dose, and the time-activity-curves (TACs)
of the mean activity within the ROIs were estimated for the entire duration of the scans. Within 5 min post I.V.
injection, [11C]ERGO can be detected in the brain parenchyma (Fig. 4A, top panel). Approximately 10 min
post I.V. injection, the radioligand was distributed in several areas of the brain (Fig. 4A, middle panel), and it
appeared the probe still remained in the brain 30 min post radiotracer injection (Fig. 4A, bottom panel). Using
an age-matched mouse brain template, the positron-emitted signal at different brain regions was quantified
using AMIDE software. The data showed that the probe was distributed with a high concentration in the cerebel-
lum and cortex (Fig. 4B). Nevertheless, the presence of the probe in other brain areas, such as the hippocampus,
striatum, and thalamus, was also significant.
Imaging LPS‑induced neuroinflammation using [ 11C]ERGO radioligand. The reported LPS
mouse model of neuroinflammation in the p ast40 was reproduced for the validation of the specificity of the
probe. Approximately 24 h after injection of WT mouse with LPS (5 mg/kg) via intraperitoneal injection, the
animals showed signs of withdrawing and lacked grooming. The animals experienced noted body weight loss
over 10% within a day after treatment. Further, histological analysis of the brain sections at the hippocampal
region showed a significant upregulation of GFAP in the LPS-treated mice (Fig. 5A). The control nontreated
WT (n = 3) and LPS-treated WT mice (n = 3) were injected with [11C]ERGO radioligand (20 MBq/0.1 mL) via
I.V. injection. For the blocking study, another cohort of LPS-treated WT mice (n = 3) was injected with Tempol
(4-hydroxy-2,2,6,6-tetramethyl piperidinoxyl) (0.2 mg/mL) prior to injection of the same dose of [ 11C]ERGO.
Ten minutes after injection, each animal was imaged for a period of 30 min, followed by CT. Data shown in
Fig. 5A indicated that ERGO was distributed and retained in the brain of LPS-treated mice resulting in higher
signal intensity on the PET scans. The PET information was coregistered with CT and MRI using the MRI tem-
plate of age-matched mice. When PET signal in each brain region was analyzed and compared (Supplementary
data, Fig. S2), the data showed that the signal from LPS-treated mice was stronger than that from nontreated
Scientific Reports | (2021) 11:18450 | https://doi.org/10.1038/s41598-021-97925-w 3
Vol.:(0123456789)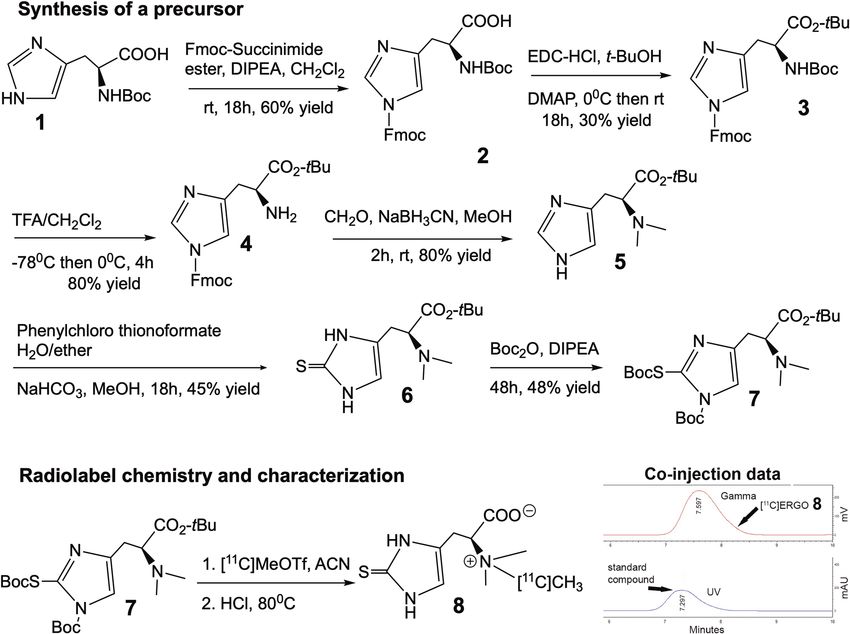
www.nature.com/scientificreports/
Figure 4. A representative axial view of a mouse (n = 4) injected with [11C]ERGO simultaneously with the start
of 90 min dynamic acquisition in a microPET. (A) PET/CT image outlining the skull of the mouse at different
timepoints; (B) the time-activity-curves (TAC) within different regions of the brain. %ID/g percentage of
injected dose per animal weight.
counterparts across every major region of the brain (Fig. 5B). The specificity of the probe was demonstrated
in the blocking study; as co-injection of the [11C]ERGO probe with the excess amount of Tempol resulted in a
significant reduction of the PET signal (Fig. 5).
Whole‑body biodistribution of [ 11C]ERGO radioligand. Cohorts of WT mice were injected with
[11C]ERGO probe, followed by cardiac perfusion 5 (n = 5), 10 (n = 5) and 30 (n = 6) minutes after injection before
tissues were collected for activity counting. The data in Fig. 6 showed that ERGO was quickly distributed to every
organs, including those have barriers such as brain (blood–brain barrier) and eyes (blood-retinal barrier) 5 min
post I.V. injection. About 30 min after injection of [11C]ERGO, the concentration in the blood decreased (from
0.39 to 0.33%ID/g), at the same time compound continued to accumulate in the peripheral tissues, including
the brain (from 0.13 to 0.35%ID/g), the eyes (from 0.11 to 0.52% ID/g), spleen (from 0.2 to 0.97% ID/g), small
intestine (from 0.2 to 0.64%ID/g), heart (from 0.13 to 0.51%ID/g), kidneys (from 1.33 to 4.2%ID/g) and liver
(0.61–2.86%ID/g).
Discussion
One of the objectives of this probe development was to assess a number of synthetic pathways to ensure the probe
would be designed in a way that minimized the potential alternation of the intrinsic chemical structure. Ideally,
we sought to maintain an identical structure to ERGO. In this respect, the most logical approach focuses on the
quaternary amine, which presents a convenient opportunity to insert the [ 11C]CH3 radioisotope through the use
of an [ 11C]CH3 electrophile. Since ERGO comprises four distinct functional groups and each can be activated
as a strong nucleophile at their respective pKa, so it is conceivable that each step of the chemistry may require
prior protection and deprotection using orthogonal strategy. Further, incorporating these protecting groups is
crucial to enhance the hydrophobicity of this water-soluble zwitterion molecule for organic solvents. Given that
ERGO and histidine share an overall structural similarity; therefore, taking all of these observations into an
account, the design suggests the adoption of either N- or C-terminal protected histidine as the starting material.
Multiple attempts were tried to synthesize the precursor 7; in almost every attempt, two major issues were
encountered. First, the product was so polarized that it proved to be challenging for purification using flash
chromatography. Second, the protecting groups were sometimes so bulky that they obscured the next step in
the process, or they were cleaved off. Therefore, the choice of a protecting group is crucial for the successful syn-
thesis. As in this case, using an orthogonal strategy, the Fmoc group can be removed without affecting the Boc
group in the following steps. Aside from protection, the Fmoc helps to enhance hydrophobicity and its UV active
Scientific Reports | (2021) 11:18450 | https://doi.org/10.1038/s41598-021-97925-w 4
Vol:.(1234567890)www.nature.com/scientificreports/
Figure 5. Imaging oxidative stress in the LPS-induced neuroinflammation mouse model using [ 11C]ERGO
radioligand. (A) Representative view of the PET signal (white arrows) depicted from the brain of LPS-
treated (n = 3) versus non-treated control mice (n = 3) and LPS-treated mice, co-injected with Tempol (n = 3).
The immunohistochemical analysis of the hippocampal region using anti-GFAP antibodies. The observed
fluorescent signal was indicated in red squares; (B) semi-quantitative analysis of the uptake in the subregions of
the brains of LPS-treated versus control and LPS-treated + Tempol. *P < 0.05; **P < 0.005, #P = 0.05.
nature, enables reaction monitoring. After three functional groups were protected, the Boc from the N-terminal
region was selectively removed using TFA in methylene chloride at − 78 °C to afford 4 (Fig. 3). The reaction was
carefully performed and monitored to ensure the t-Bu ester is tolerant to these reaction conditions. There was
no sign that t-Bu ester was affected for an extension of up to 4 h. However, when the reaction was continued
overnight, both the Boc and the t-Bu ester groups were removed completely. It is interesting to mention that
when treating compound 4 with sodium cyanoborohydride during the reductive amination, the Fmoc group was
also removed concomitantly. This was an unintentional but necessary process. Fabrication of an appropriate PET
precursor requires that all protecting groups should have a Boc group, which can be removed simultaneously
in mild acidic condition once after radioisotope labeling. This requires that the Fmoc group should be removed
and replaced with a Boc group.
ERGO has multiple advantages when it comes to studying oxidative stress in the brain, given the molecule
is very water soluble, ideal for the clinical formulation whether it is for I.V. injection or for oral usage. But the
paradox is that hydrophilic molecules cannot cross the blood–brain barrier (BBB). A unique feature of ERGO
compared to other antioxidants is that its distribution to the brain parenchyma is independent of the BBB, but
rather mediated by OCTN1 receptors. Thus, it seems reasonably certain that there is a huge interest in assessing
the protective role of ERGO in the b rain15,23,29, particularly oxidative stress related to Alzheimer’s d
isease40–42. In
Scientific Reports | (2021) 11:18450 | https://doi.org/10.1038/s41598-021-97925-w 5
Vol.:(0123456789)www.nature.com/scientificreports/
Figure 6. Ex-vivo cut-and-count biodistribution of I.V.-injected [11C]ERGO radioligand in WT mice. At 5
(n = 5), 10 (n = 5) or 30 (n = 6) min post I.V. injection, animals went through cardiac perfusion before tissues
collections and counted. Tissue radioactivity was assessed and expressed as %ID/g.
clinical trials, either pure ERGO or mushrooms have been given to testing subjects for examining its effect on
biomarkers of oxidative damage and inflammation43–45. So far, all ERGO biodistribution and pharmacokinetics
analysis rely on the indirect analysis of blood and urine s amples43.
The availability of the probe enables dynamic imaging to assess the biodistribution and kinetics of ERGO at
any target of interest. Further, it also provides information for mapping OCTN1 receptors. For instance, the data
in Fig. 4 showed that within 5 min post I.V. injection, the compound started to present in the brain. At 10 min,
ERGO is available almost in every region of the brain. The cortex and cerebellum had the highest regional uptake
of the radiotracer compared to the hippocampus, striatum, and thalamus at every timepoint along with the TAC
(Fig. 4B). This observation is consistent with a past study that showed ERGO was found in a large quantity in
the cerebellum than in the rest of the brain across different species, including mice, rats, guinea-pigs, cats, and
sheep46. The presence and variable distribution of ERGO in the brain, with high concentrations in the central
nervous system suggesting the possibility of its role in the central regulatory function. In addition, the observa-
tion of ERGO presence in the hippocampus of 5XFAD mouse supports a focus of future studies to assess the
implications of ERGO in Alzheimer’s disease. In the recent past, it has been reported the inhibition of Abeta-
induced toxicity by ERGO in the transgenic Caenorhabditis elegans m odel47. With the availability of this probe,
similar studies in higher organisms are on the horizon.
The retention of the [11C]ERGO probe depicted by strong signal in the brains of 5XFAD mice during PET
scans (Fig. 4) was presumed due to chronic neuroinflammation occurs in Alzheimer’s d isease48. As a stronger
demonstration of the specificity of the probe, we used LPS-induced mice as a model of acute neuroinflammation.
Scientific Reports | (2021) 11:18450 | https://doi.org/10.1038/s41598-021-97925-w 6
Vol:.(1234567890)www.nature.com/scientificreports/
LPS is a molecular motif structurally similar amongst gram-negative bacteria that is recognized by the innate
immune system and results in pro-inflammatory cytokine release mediated by toll-like receptor 4 (TLR-4)49.
We have previously shown that injection of LPS (I.V.) resulted in severed neuroinflammation that breached the
blood–brain barrier even at a nonlethal, low dose (< 3 mg/kg)50. Following observations of lethality at a dose
greater than 3 mg/kg combined with recent literature51, we decided to inject LPS into the peritoneum to prevent
a robust inflammatory response. The 30-min PET scans (Fig. 5) suggested that ERGO was retained in the brain,
likely acting as an adaptive antioxidant. The signal intensity of the LPS-treated mice was significantly higher
than that found in control mice. And it is apparent that the specific distribution and retention of the probe is
ROS-dependent, not because of the LPS-induced BBB opening. Since pretreatment of LPS mice with Tempol, a
general-purpose antioxidant known for scavenging a wide range of ROS and reactive nitrogen species52, resulting
in a remarkable reduction in the [ 11C]ERGO signal across all the brain regions (Fig. 5).
Similar to the brain study, data from the whole-body biodistribution showed that 5 min post-injection, ERGO
started to present in the peripheral tissues, as the levels in the blood reduced significantly (Fig. 6). Five minutes
later, the compound is distributed mostly in every tissue, as a note, the level of ERGO is very high in the eyes
and the small intestines. This in vivo observation is consistent with the past data, which also reported ERGO
primarily concentrates in those t issues1. Given the photo-oxidative process, the eyes are also susceptible to ROS
and oxidative stress, and subsequent inflammatory c onditions53. Based on the data shown in Fig. 5 (coronal
and sagittal information), it seems likely this [11C]ERGO probe could detect the inflammation (LPS-treated)
and response (after treating with Tempol) to the treatment in the eyes. More investigation is on the way in our
laboratory since we think the molecular mechanisms underlying these differences could be of considerable
biomedical importance.
Different from the in vivo PET imaging information, the biodistribution data showed that over the thirty
minutes after administration, the ERGO continues to accumulate in most of the tissues, including the brain
(Fig. 6). This discrepancy may be due to blood flow effects that are present only in the microPET data. Any signal
due to ERGO presence in the blood is absent in the biodistribution data since perfusion of the vasculature was
performed prior to measurement of the radioactivity in excised tissues. This observation could be explored in
future studies through kinetic modeling of the dynamic PET data to better separate tissue uptake from blood
flow effects.
Conclusion
In summary, a new [11C]ERGO PET radioligand has been synthesized to facilitate in vivo, non-invasive and
real-time imaging of the biodistribution of ERGO. The development of a probe with an identical structure of
ERGO is a significant advantage to our design. As such, all pharmacokinetics and biodistribution shown in this
work are expected to reflect those of native compounds. Further, the availability of the PET radioligand enables
the performance of longitudinal investigations in the same animals. Thus, differences between animals due to
inter-individual variations can be controlled f or54. Overall, we anticipate that this probe will pave the way for
the integration of molecular imaging with food biomarkers and biomedical research. The probe provides an
emerging capability that will benefit the ERGO research community.
Materials and methods
TEMPOL was acquired from Tocris Bioscience (Fisher Scientific). Animal experiments were conducted per the
guidelines established by the Vanderbilt University’s Institutional Animal Care and Use Committee (IACUC)
and the Division of Animal Care. The performed work was approved by Vanderbilt IACUC with an extended
protocol, M1700044-01. In addition, all of the works involving live animals were compliant with the ARRIVE
guidelines. In a typical imaging procedure, anesthetized mice received 2% of isoflurane via inhalation, supplied
with oxygen using a precision vaporizer.
General synthesis. All commercially available reagents and solvents were used as received. L-(+)-Ergot-
hionene was purchased from Cayman Chemicals. Reactions were montitored by a Agilent LC/MS 1260 Infinity
II. Products were purified using a Telodyne Combiflash Rf automated purification instrument using normal
phase or reverse phase. NMR spectra were recorded on a 400 MHz Bruker AVANCE 400 equipped with a 9.3 T
Oxford Magnet or 600 MHz Bruker AVIII console equipped with a 14.1 T Bruker Magnet. 1H NMR chemical
shifts were referenced to the residual solvent signal; 13C NMR chemical shifts were referenced to the deuter-
ated solvent signal. Data are presented as follows: chemical shift d (ppm), multiplicity (s = singlet, d = doublet,
dd = doublet of doublet, t = triplet, m = multiplet).
Synthesis of the PET precursor (Fig. 3). Nτ‑(((9H‑Fluoren‑9‑yl)methoxy)carbonyl)‑Nα‑(tert‑butoxycar
bonyl)‑L‑histidine 2. To a stirring solution of histidine amino acid 1 (1.0 g, 3.9 mmol), FMOC-succinimide
(1.45 g, 4.3 mmol), and DIPEA (0.605 g, 4.7 mmol) in methylene chloride (50 mL) and stirred overnight. Reac-
tion was diluted with water and methylene chloride. The product was extracted 3 × with methylene chloride. The
organic layers were combined, washed with 1 M HCl, saturated sodium bicarbonate, brine, dried over sodium
sulfate, filtered and concentrated under reduced pressure to provide a desired product with 60% yield.
1
H CDCl3 (400.13 mHz): 8.26 (d, J = 1.2 Hz, 1H); 7.79 (d, J = 7.6 Hz, 2H); 7.56 (d, J = 7.6 Hz, 2H); 7.43, (t,
J = 7.2 Hz, 2H); 7.34 (t, J = 7.2 Hz, 2H); 7.24 (s, 1H); 5.51 (d, J = 6.0 Hz, 1H); 4.70 (dd, J1 = 7.2 Hz, J2 = 1.6 Hz,
2H); 4.56 (t, J = 7.6 Hz, 1H); 4.35 (t, J = 6.8 Hz, 1H); 3.32 (dd, J 1 = 14.8 Hz, J2 = 2.8 Hz, 1H); 3.20 (dd, J 1 = 14.4 Hz,
J2 = 5.2 Hz, 1H); 1.47 (s, 9H). 13C CDCl3 (100.6 mHz): 172.9, 168.6, 155.4, 148.1, 142.7, 141.5, 137.5, 128.4, 127.6,
124.9, 120.5, 115.6, 80.0, 70.6, 53.6, 52.8, 46.6, 29.9, 28.5.
Scientific Reports | (2021) 11:18450 | https://doi.org/10.1038/s41598-021-97925-w 7
Vol.:(0123456789)www.nature.com/scientificreports/
(9H‑Fluoren‑9‑yl)methyl(S)‑4‑(3‑(tert‑butoxy)‑2‑((tert‑butoxycarbonyl)amino)‑3‑oxopropyl)‑1H‑imida‑
zole‑1‑carboxylate 3. To a stirring solution of 2 (3.90 mmol) in methylene chloride (50 mL) and tert-butanol
(10 mL)at 0 C was added: EDC-HCl (744 mg, 3.9 mmol), and DMAP (95 mg, 0.78 mmol. This solution was
allowed to warm up to r.t. and stirred overnight. Reaction was diluted with water and methylene chloride. The
product was extracted 3 × with methylene chloride. The organic layers were combined, washed with 1 M HCl,
saturated sodium bicarbonate, brine, dried over sodium sulfate, filtered and concentrated under reduced pres-
sure to provide the desired product (12% yield).
1
H CDCl3 (400.13 mHz): 7.99 (s, 1H); 7.81 (d, J = 7.6 Hz, 2H); 7.58 (d, J = 7.6 Hz, 2H); 7.48, (t, J = 7.2 Hz,
2H); 7.35 (t, J = 7.2 Hz, 2H); 7.17 (s, 1H); 5.03 (m, 1H); 4.72 (dd, J 1 = 6.4 Hz, J2 = 2.0 Hz, 2H); 4.20 (m, 1H); 3.03
(m, 2H); 1.44 (s, 9H).
(9H‑Fluoren‑9‑yl)methyl (S)‑4‑(2‑amino‑3‑(tert‑butoxy)‑3‑oxopropyl)‑1H‑imidazole‑1‑carboxylate 4. To a stir-
ring solution of 3 (3.90 mmol) in methylene chloride at − 78 °C was added TFA (5 mL) dropwise. This solution
was allowed to warm up to 0 °C and stirred until completion. The solution was then neutralized with sodium
bicarbonate and diluted with water and methylene chloride. The product was extracted 3 × with methylene chlo-
ride. The organic layers were combined, washed with brine, dried over sodium sulfate, filtered and concentrated
under reduced pressure to provide the desired product with 63% yield.
1
H CDCl3 (400.13 mHz): 7.99 (s, 1H); 7.77 (d, J = 7.6 Hz, 2H); 7.57 (d, J = 6.8 Hz, 2H); 7.41, (t, J = 6.0 Hz,
2H); 7.33 (t, J = 7.6 Hz, 2H); 7.14 (s, 1H); 5.03 (m, 1H); 4.59 (m, 2H); 4.18 (m, 1H); 3.05 (m, 2H); 1.38 (s, 9H).
Tert‑Butyl Nα,Nα‑dimethyl‑L‑histidinate 5. To a stirring solution of 4 in MeOH (20 mL) was added N aBH3CN
(362 mg, 5.8 mmol) and CH2O (37% in H20, 702 mg, 23.4 mmol). The reaction was capped and stirred for 2 h.
The resulting solution was then concentrated via rotovap. The crude oil was purified by reverse phase chroma-
tography. The product was verified by LC/MS and used as is in the next step with a 82% yield. The Fmoc group
was removed in this step through interaction with the NaBH3CN to provide the desired product.
1
H D2O (400.13 mHz): 7.47 (s, 1H); 6.83 (s, 1H); 4.79 (m, 1H); 4.29 (m, 2H); 2.58 (s, 6H); 1.24 (s, 9H).
Tert‑Butyl (S)‑2‑(dimethylamino)‑3‑(2‑thioxo‑2,3‑dihydro‑1H‑imidazol‑4‑yl)propanoate 6. To a stirring solu-
tion of 5 (31.5 mg, 0.13 mmol) in water (2 mL) and diethyl ether (2 mL) was added sodium bicarbonate (65 mg,
0.78 mmol), and phenylchloro thionoformate (24.7 mg, 0.14 mmol) and stirred overnight. Reaction was diluted
with water and diethyl ether. The product was extracted 3 × with diethyl ether. The organic layers were combined,
washed with brine, dried over sodium sulfate, filtered and concentrated under reduced pressure. The resulting oil
was then redissolved in MeOH (5 mL) and triethylamine (55 μL) was added. This solution was stirred overnight.
The resulting solution was then concentrated under reduced pressure. Product was purified by reverse phase
chromatography to provide a final product (16.0 mg) 45% yield. And the product was immediately used for the
next step.
Tert‑Butyl (S)‑4‑(3‑(tert‑butoxy)‑2‑(dimethylamino)‑3‑oxopropyl)‑2‑((tert‑butoxycarbonyl)thio)‑1H‑imida‑
zole‑1‑carboxylate 7. To a stirring solution of 6 (16.0 mg, 0.066 mmol) in methylene chloride (10 mL) was
added: Boc anhydride (32 mg, 0.145 mmol), and DIPEA (19 mg, 0.145 mmol) and stirred over the course of 48 h.
The resulting solution was concentrated and purified by flash chromatography (0–50% CH2Cl2/(20%MeOH/
CH2Cl2)) to afford the precursor 7 (15.0 mg) with 48% yield.
1
H CDCl3 (600.13 mHz): 7.16 (s, 1H); 3.40 (m, 1H); 2.86 (dd, J1 = 14.4 Hz, J2 = 8.4 Hz, 1H); 2.72 (dd,
J1 = 14.4 Hz, J2 = 6.6 Hz, 1H); 2.28 (s, 6H); 1.48 (s, 9H); 1.37 (s, 9H); 1.32 (s, 9H). 13C CDCl3 (150.9 mHz): 170.9,
165.3, 146.7, 139.9, 135.1, 119.8, 86.8, 85.8, 81.2, 67.3, 41.8, 29.8, 28.6, 28.3, 28.2, 27.9, 22.3, 22.0.
MS: calculated: 471.2403, detected: 471.1845.
[11C]ERGO radiotracer synthesis. The [11C]CO2 was made by irradiating a target filled with nitrogen
and 1% oxygen gas with protons. The [ 11C]CO2 was then trapped on nickel Shimalite with molecular sieves at
room temperature. The [ 11C]CO2 was then converted to [ 11C]CH4 by heating the trapped [ 11C]CO2 to 400 °C in
the presence of hydrogen gas. The [11C]CH4 was then released from the nickel Shimalite at 400 °C and isolated
on molecular sieves at -75 °C. The [11C]CH4 was then converted to [11C]MeI via a recirculation through gase-
ous iodine at ~ 720 °C, with the [11C]MeI being trapped on Porapak N with each cycle. The [11C]MeI was then
released from the Porapak N by heating with a gentle flow of helium that is passed through an AgOTf impreg-
nated column at ~ 200 °C to convert the [ 11C]MeI to [ 11C]MeOTf. This [ 11C]MeOTf was bubbled into a solution
of precursor in 250 μL acetonitrile at − 10 °C. After the activity transfer was complete, the reaction mixture was
heated to 80 °C for 2 min. At this time, hydrochloric acid (6 M, 250 μL) was added, and the reaction mixture
was heated at 70 °C for 5 min, cooled to room temperature, and diluted with water (1 mL). The reaction mixture
was passed through an ion-retardation resin (Ag11–A8, 3 g) into the product vial, and the resin was rinsed with
water (5 mL) into the product vial. The product was then transferred to the final vial, and an aliquot was removed
for quality control analysis.
The radiochemical purity and the identity of the [11C]ERGO were characterized using an analytical HPLC
system, equipped with a UV absorption detector (λ = 254 nm) and a radio-detector (Bioscan Flow-Count). The
chromatography setup included a SeQuant ZIC-HILIC 150 × 4.6 mm with a typical mobile phase of acetonitrile
(75%) in water at a flow rate of 1 mL/min. The identity of the [ 11C]ERGO was confirmed by comparing the
retention time with co-injected and unlabeled ERGO along with the gamma peak. The molar activity of the
radioligand is 690 TBq/mmol.
Scientific Reports | (2021) 11:18450 | https://doi.org/10.1038/s41598-021-97925-w 8
Vol:.(1234567890)www.nature.com/scientificreports/
PET/CT data processing and analysis. The dynamic acquisition was divided into twelve 5 s frames,
four 60 s frames, five 120 s frames, three 5 min frames, and six 10 min scans. The data from all possible lines of
response (LOR) were saved in the list mode raw data format. The raw data were then binned into 3D sinograms
with a span of 3 and ring difference of 47. The images were reconstructed into transaxial slices (128 × 128 × 159)
with voxel sizes of 0.0815 × 0.0815 × 0.0796 cm3, using the MAP algorithm with 16 subsets, 4 iterations, and a
beta of 0.0468. For anatomical co-registration, immediately following the PET scans, the mice received a CT
scan in a NanoSPECT/CT (Mediso, Washington DC) at an X-ray beam intensity of 90 mAs and x-ray peak
voltage of 45 kVp. The CT images were reconstructed into 170 × 170 × 186 voxels at a voxel size of 0.4 × 0.4 × 0.4
mm3. The PET/CT images were uploaded into Amide software (www.sourceforge.com), co-registered to an MRI
template made in-house, and volumetric regions-of-interest were drawn around the cortex, hippocampus, stria-
tum, thalamus, and cerebellum in addition to the whole brain. The PET images were normalized to the injected
dose, and the time-activity-curves (TACs) of the mean activity within the ROIs were estimated for the entire
duration of the scans.
Static PET scan. The mice were injected with ~ 20 MBq/0.1 mL 11C-ERGO via the tail vein and returned
to their cages for 10 min. Then they were anesthetized with 2% isofluorane and imaged in an Inveon microPET
(Siemens Pre-clinical, Knoxville, TN, USA) for 30 min in static mode followed by a CT scan using a NanoSPECT/
CT (Mediso, Washington DC) at an X-ray beam intensity of 90 ms and X-ray voltage of 45 kVp. PET images
were reconstructed using the iterative MAP reconstruction algorithm with 18 iterations and a beta smoothing
value of 0.001 into 128 × 128 × 95 slices with a voxel size of 0.388 mm × 0.388 mm × 0.796 mm. The CT images
were reconstructed into 170 × 170 × 126 slices at a voxel size of 0.4 × 0.4 × 0.4 mm3. The PET and CT images were
co-registered using the imaging tool AMIDE.
Cardiac perfusion procedure and tissue collection. At 5 or 10 min post injection, anesthetized mice
were laid on the shallow tray filled with crushed ice and the thoracic cavity was accessed using a scalpel after
making 5–6 cm mid-line incision from the abdominal area. After careful separation of the liver from the dia-
phragm, the thoracic opening was stabilized with a retractor. Perfusion was performed as we described in the
past55–57. Following removal of air bubbles, approximately 30 mL (pH7.4) of ice-cold PBS buffer is slowly injected
in the left ventricle toward the ascending aorta using a 25-G syringe while the right atrium was snipped off using
a curved point squeeze snip scissors to facilitate drainage of the systemic venous return. Then, 30 mL of 4%
paraformaldehyde (PFA, pH 7.4) was perfused. When completed, tissues were harvested and weighed before
counting using the automatic gamma counter (Hidex).
Animal models. 5XFAD and control C57BL/6J mice were maintained at Vanderbilt University under stand-
ard conditions, in a 12-h light/dark cycle, and with free access to food and water. The 5XFAD mice over express
both mutant human amyloid precursor protein (APP) and presenilin 1 (PS1), correlating with high burden and
accelerated accumulation of the Aβ. A colony of 5XFAD transgenic mice obtained from Jackson Laboratories
was maintained by crossing 5XFAD mice with a WT C57BL/6J strain. The 5XFAD mice were maintained as
heterozygous.
The mouse model of LPS-induced neuroinflammation was developed based on past reports50,51. The LPS
derived from Escherichia coli O111:B4 (Sigma Aldrich, St Louis, MO) was formulated in sterilized dd. water and
given a high dose of LPS formulation (5 mg/kg) through intraperitoneal injection 24 h before PET imaging. This
high dose would result in approximately 12–13% body weight loss over the course of 24 h. After PET imaging,
animals were sacrificed, and the brains were collected for histology analysis.
Immunohistochemistry. Brains embedded in OCT were cut into sagittal sections (10 µm) using a Tissue-
Tek cryostat and mounted onto charged glass slides. Prior to staining, slides were washed with PBS (10 min);
then, they were treated with blocking buffer (5% normal goat serum, 0.2% Triton X-100, 0.5% bovine albumin in
PBS) for 1 h at room temperature. The treated sections were then incubated overnight at 4 °C with primary anti-
GFAP antibody (1:100 dilution, Biolegend San Diego, CA, USA). Slides were washed with PBS (3×) for 10 min
each, the sections were subsequently incubated with secondary antibody goat anti-mouse Alexa Fluor 488 (1:200
dilution, Thermo Fisher Scientific, Carlsbad, CA, USA) for 30 min at room temperature. The sections were then
washed with PBS twice for 10 min and once for 30 min, and cover slipped with an antifade mounting medium
(Vector Laboratories, Burlingame, CA, USA) before observation under a fluorescence microscope.
Statistical analysis. Unpaired t test was used to compare the mean signal (%ID/g) difference between two
independent subjects. A p value of ≤ 0.05 was considered as a statistically significant difference.
Received: 11 March 2021; Accepted: 1 September 2021
References
1. Tang, R. M. Y., Cheah, I. K., Yew, T. S. K. & Halliwell, B. Distribution and accumulation of dietary ergothioneine and its metabolites
in mouse tissues. Sci. Rep. 8, 1601. https://doi.org/10.1038/s41598-018-20021-z (2018).
2. Halliwell, B., Cheah, I. K. & Drum, C. L. Ergothioneine, an adaptive antioxidant for the protection of injured tissues? A hypothesis.
Biochem. Biophys. Res. Commun. 470, 245–250. https://doi.org/10.1016/j.bbrc.2015.12.124 (2016).
Scientific Reports | (2021) 11:18450 | https://doi.org/10.1038/s41598-021-97925-w 9
Vol.:(0123456789)www.nature.com/scientificreports/
3. Tanret, C. Sur une base novelled retiree du seigle ergote, l’ergothioneine. Rend. Acad. Sci. 149, 222–322 (1909).
4. Paul, B. D. & Snyder, S. H. The unsual amino acid L-ergothioneine is a physiologic cytoprotectant. Cell Death Differ. 17, 1134–1140
(2010).
5. Motohashi, N., Mori, I. & Sugiura, Y. 13C-nuclear magnetic resonance and Raman spectroscopic studies on ionization and mercury
complex of ergothioneine. Chem. Pharm. Bull. 24, 1737–1741 (1976).
6. Beelman, R. B., Kalaras, M. D. & Richie, J. P. Micronutrients and bioactive compounds in mushrooms. Nutr. Today 54, 16–22
(2019).
7. Dubost, N. J., Beelman, R. B., Peterson, D. & Royse, D. J. Identification and quantification of ergothioneine in cultivated mushrooms
by liquid chromatochraphy-mass spectroscopy. Int. J. Med. Mushrooms 8, 215–222 (2006).
8. Kalaras, M. D., Richie, J. P., Calcagnotto, A. & Beelman, R. B. Mushrooms: A rich source of the antioxidants ergothioneine and
glutathione. Food Chem. 233, 429–433. https://doi.org/10.1016/j.foodchem.2017.04.109 (2017).
9. Dubost, N. J., Ou, B. & Beelman, R. B. Quantification of polyphenols and ergothioneined in cultivated mushrooms and correlation
to total antioxidant capacity. Food Chem. 105, 727–735 (2007).
10. Dubost, N. J., Beelman, R. B. & Royse, D. J. Influence of selected cultural factors and postharvest storage on ergothioneine content
of common button mushroom Agaricus bisporus. Int. J. Med. Mushrooms 9, 163–176 (2007).
11. Borodina, I. et al. The biology of ergothioneine, an antioxidant nutraceutical. Nutr. Res. Rev. 33, 190–217. https://doi.org/10.1017/
S0954422419000301 (2020).
12. Kerley, R. N., McCarthy, C., Kell, D. B. & Kenny, L. C. The potential therapeutic effects of ergothioneine in pre-eclampsia. Free
Radic. Biol. Med. 117, 145–157. https://doi.org/10.1016/j.freeradbiomed.2017.12.030 (2018).
13. Samuel, P. et al. Ergothioneine mitigates telomere shortening under oxidative stress conditions. J. Diet Suppl. https://doi.org/10.
1080/19390211.2020.1854919 (2020).
14. Kumosani, T. A. L-ergothioneine level in red blood cells of healthy human males in the Western province of Saudi Arabia. Exp.
Mol. Med. 33, 20–22 (2001).
15. Nakamichi, N. et al. Food-derived hydrophilic antioxidant ergothioneine is distributed to the brain and exerts antidepressant effect
in mice. Brain Behav. 6, e00477. https://doi.org/10.1002/brb3.477 (2016).
16. Deiana, M. et al. L-ergothioneine modulates oxidative damage in the kidney and liver of rats in vivo: Studies upon the profile of
polyunsaturated fatty acids. Clin. Nutr. 23, 183–193. https://doi.org/10.1016/S0261-5614(03)00108-0 (2004).
17. Shires, T. K., Brummel, M. C., Pulido, J. S. & Stegink, L. D. Ergothioneine distribution in bovine and porcine ocular tissues. Comp.
Biochem. Physiol. C Pharmacol. Toxicol. Endocrinol. 117, 117–120. https://doi.org/10.1016/s0742-8413(96)00223-x (1997).
18. Cheah, I. K. et al. Liver ergothioneine accumulation in a guinea pig model of non-alcoholic fatty liver disease. A possible mechanism
of defence?. Free Radic. Res. 50, 14–25. https://doi.org/10.3109/10715762.2015.1099642 (2016).
19. Lamhonwah, A. M. & Tein, I. Novel localization of OCTN1, an organic cation/carnitine transporter, to mammalian mitochondria.
Biochem. Biophys. Res. Commun. 345, 1315–1325. https://doi.org/10.1016/j.bbrc.2006.05.026 (2006).
20. Nakamichi, N. & Kato, Y. Physiological roles of carnitine/organic cation transporter OCTN1/SLC22A4 in neural cells. Biol. Pharm.
Bull. 40, 1146–1152. https://doi.org/10.1248/bpb.b17-00099 (2017).
21. Nishida, K. et al. Ergothioneine ameliorates oxaliplatin-induced peripheral neuropathy in rats. Life Sci. 207, 516–524. https://doi.
org/10.1016/j.lfs.2018.07.006 (2018).
22. Song, T. Y. et al. Ergothioneine and melatonin attenuate oxidative stress and protect against learning and memory deficits in
C57BL/6J mice treated with D-galactose. Free Radic. Res. 48, 1049–1060. https://doi.org/10.3109/10715762.2014.920954 (2014).
23. Yang, N. C. et al. Ergothioneine protects against neuronal injury induced by beta-amyloid in mice. Food Chem. Toxicol. 50,
3902–3911. https://doi.org/10.1016/j.fct.2012.08.021 (2012).
24. Aruoma, O. I., Spencer, J. P. & Mahmood, N. Protection against oxidative damage and cell death by the natural antioxidant ergot-
hioneine. Food Chem. Toxicol. 37, 1043–1053. https://doi.org/10.1016/s0278-6915(99)00098-8 (1999).
25. Colognato, R. et al. Modulation of hydrogen peroxide-induced DNA damage, MAPKs activation and cell death in PC12 by ergot-
hioneine. Clin. Nutr. 25, 135–145. https://doi.org/10.1016/j.clnu.2005.10.005 (2006).
26. Markova, N. G. et al. Skin cells and tissue are capable of using L-ergothioneine as an integral component of their antioxidant
defense system. Free Radic. Biol. Med. 46, 1168–1176. https://doi.org/10.1016/j.freeradbiomed.2009.01.021 (2009).
27. Grundemann, D. et al. Discovery of the ergothioneine transporter. Proc. Natl. Acad. Sci. USA 102, 5256–5261. https://doi.org/10.
1073/pnas.0408624102 (2005).
28. Cheah, I. K., Feng, L., Tang, R. M. Y., Lim, K. H. C. & Halliwell, B. Ergothioneine levels in an elderly population decrease with age
and incidence of cognitive decline; a risk factor for neurodegeneration?. Biochem. Biophys. Res. Commun. 478, 162–167. https://
doi.org/10.1016/j.bbrc.2016.07.074 (2016).
29. Nakamichi, N. et al. Functional expression of carnitine/organic cation transporter OCTN1 in mouse brain neurons: Possible
involvement in neuronal differentiation. Neurochem. Int. 61, 1121–1132. https://doi.org/10.1016/j.neuint.2012.08.004 (2012).
30. Shimizu, T., Masuo, Y., Takahashi, S., Nakamichi, N. & Kato, Y. Organic cation transporter Octn1-mediated uptake of food-derived
antioxidant ergothioneine into infiltrating macrophages during intestinal inflammation in mice. Drug Metab. Pharmacokinet. 30,
231–239. https://doi.org/10.1016/j.dmpk.2015.02.003 (2015).
31. Taubert, D., Jung, N., Goeser, T. & Schomig, E. Increased ergothioneine tissue concentrations in carriers of the Crohn’s disease
risk-associated 503F variant of the organic cation transporter OCTN1. Gut 58, 312–314. https://doi.org/10.1136/gut.2008.164418
(2009).
32. Tschirka, J., Kreisor, M., Betz, J. & Grundemann, D. Substrate selectivity check of the ergothioneine transporter. Drug Metab.
Dispos. 46, 779–785. https://doi.org/10.1124/dmd.118.080440 (2018).
33. Moncaster, J. A., Walsh, D. T., Gentleman, S. M., Jen, L. S. & Aruoma, O. I. Ergothioneine treatment protects neurons against
N-methyl-D-aspartate excitotoxicity in an in vivo rat retinal model. Neurosci. Lett. 328, 55–59. https://doi.org/10.1016/s0304-
3940(02)00427-5 (2002).
34. Song, T. Y., Chen, C. L., Liao, J. W., Ou, H. C. & Tsai, M. S. Ergothioneine protects against neuronal injury induced by cisplatin
both in vitro and in vivo. Food Chem. Toxicol. 48, 3492–3499. https://doi.org/10.1016/j.fct.2010.09.030 (2010).
35. Beelman, R. B., Kalaras, M. D., Phillips, A. T. & Richie, J. P. Jr. Is ergothioneine a “longevity vitamin” limited in the American diet?.
J. Nutr. Sci. 9, e52. https://doi.org/10.1017/jns.2020.44 (2020).
36. Morillon, A. C. et al. Effect of L-Ergothioneine on the metabolic plasma profile of the RUPP rat model of pre-eclampsia. PLoS One
15, e0230977. https://doi.org/10.1371/journal.pone.0230977 (2020).
37. Williamson, R. D. et al. L-(+)-ergothioneine significantly improves the clinical characteristics of preeclampsia in the reduced uterine
perfusion pressure rat model. Hypertension 75, 561–568. https://doi.org/10.1161/HYPERTENSIONAHA.119.13929 (2020).
38. Calvo, M. S. et al. A Retrospective study in adults with metabolic syndrome: Diabetic risk factor response to daily consumption of
Agaricus bisporus (white button mushrooms). Plant Foods Hum. Nutr. 71, 245–251. https://doi.org/10.1007/s11130-016-0552-7
(2016).
39. Mehrotra, A. et al. Bioavailability of vitamin D2 from enriched mushrooms in prediabetic adults: A randomized controlled trial.
Eur. J. Clin. Nutr. 68, 1154–1160. https://doi.org/10.1038/ejcn.2014.157 (2014).
40. Butterfield, D. A. & Halliwell, B. Oxidative stress, dysfunctional glucose metabolism and Alzheimer disease. Nat. Rev. Neurosci.
20, 148–160. https://doi.org/10.1038/s41583-019-0132-6 (2019).
Scientific Reports | (2021) 11:18450 | https://doi.org/10.1038/s41598-021-97925-w 10
Vol:.(1234567890)www.nature.com/scientificreports/
41. Feng, L. et al. The association between mushroom consumption and mild cognitive impairment: A community-based cross-
sectional study in Singapore. J. Alzheimers Dis. 68, 197–203. https://doi.org/10.3233/JAD-180959 (2019).
42. Yatin, S. M., Varadarajan, S., Link, C. D. & Butterfield, D. A. In vitro and in vivo oxidative stress associated with Alzheimer’s amyloid
beta-peptide (1–42). Neurobiol. Aging. 20, 325–330. https://doi.org/10.1016/s0197-4580(99)00056-1 (1999) (discussion 39–42).
43. Cheah, I. K., Tang, R. M., Yew, T. S., Lim, K. H. & Halliwell, B. Administration of pure ergothioneine to healthy human subjects:
Uptake, metabolism, and effects on biomarkers of oxidative damage and inflammation. Antioxid. Redox. Signal. 26, 193–206.
https://doi.org/10.1089/ars.2016.6778 (2017).
44. Xu, T., Beelman, R. B. & Lambert, J. D. The cancer preventive effects of edible mushrooms. Anticancer Agents Med. Chem. 12,
1255–1263 (2012).
45. Zhang, S. et al. Mushroom consumption and incident risk of prostate cancer in Japan: A pooled analysis of the Miyagi Cohort
Study and the Ohsaki Cohort Study. Int. J. Cancer. 146, 2712–2720. https://doi.org/10.1002/ijc.32591 (2020).
46. Crossland, J., Mitchell, J. & Woodruff, G. N. The presence of ergothioneine in the central nervous system and its probable identity
with the cerebellar factor. J. Physiol. 182, 427–438. https://doi.org/10.1113/jphysiol.1966.sp007830 (1966).
47. Cheah, I. K. et al. Inhibition of amyloid-induced toxicity by ergothioneine in a transgenic Caenorhabditis elegans model. FEBS
Lett. 593, 2139–2150. https://doi.org/10.1002/1873-3468.13497 (2019).
48. Kim, S. J. et al. miR-146a dysregulates energy metabolism during neuroinflammation. J. Neuroimmune Pharmacol. https://d oi.o
rg/
10.1007/s11481-021-09999-y (2021).
49. Awasthi, S. Toll-like receptor-4 modulation for cancer immunotherapy. Front. Immunol. 5, 328. https://doi.org/10.3389/fimmu.
2014.00328 (2014).
50. Barton, S. M. et al. Lipopolysaccharide induced opening of the blood brain barrier on aging 5XFAD mouse model. J. Alzheimer
Dis. 67, 503–513 (2019).
51. Hou, C. et al. Development of a Positron emission tomography radiotracer for imaging elevated levels of superoxide in neuroin-
flammation. ACS Chem Neurosci. 9, 578–586. https://doi.org/10.1021/acschemneuro.7b00385 (2018).
52. Francischetti, I. M. et al. Tempol, an intracellular antioxidant, inhibits tissue factor expression, attenuates dendritic cell function,
and is partially protective in a murine model of cerebral malaria. PLoS One 9, e87140. https://doi.org/10.1371/journal.pone.00871
40 (2014).
53. Babizhayev, M. A. & Yegorov, Y. E. Biomarkers of oxidative stress and cataract. Novel drug delivery therapeutic strategies target-
ing telomere reduction and the expression of telomerase activity in the lens epithelial cells with N-acetylcarnosine lubricant eye
drops: Anti-cataract which helps to prevent and treat cataracts in the eyes of dogs and other animals. Curr. Drug Deliv. 11, 24–61.
https://doi.org/10.2174/15672018113106660062 (2014).
54. Herfert, K. et al. Quantitative rodent brain receptor imaging. Mol. Imaging Biol. 22, 223–244. https://doi.org/1 0.1 007/s11307-019-
01368-9 (2020).
55. McClure, R. et al. Aerosol delivery of curcumin reduced amyloid-beta deposition and improved cognitive performance in a
transgenic model of Alzheimer’s disease. J. Alzheimers Dis. 55, 797–811. https://doi.org/10.3233/JAD-160289 (2017).
56. McClure, R. et al. Inhalable curcumin: Offering the potential for translation to imaging and treatment of Alzheimer’s disease. J.
Alzheimers Dis. 44, 283–295. https://doi.org/10.3233/JAD-140798 (2015).
57. McClure, R. A. et al. Identification of promethazine as an amyloid-binding molecule using a fluorescence high-throughput assay
and MALDI imaging mass spectrometry. NeuroImage Clin. 2, 620–629 (2013).
Acknowledgements
This work was partially supported by This work was partially supported by Vanderbilt CTSA Grant UL1TR002243
from NCATS/NIH (W.P.), R01 AG061138 (W.P.), the VICC Shared Resource Scholarships (W.P.), and The NIH
1S10 OD016245 for the procurement of the Inveon microPET scanner.
Author contributions
Conceptualization: W.P. Data collection and analysis: W.J.B., C.A.W., J.R.H., A.J.R., M.N.T., W.P. Consultation:
F.E.H., T.E.P., R.B.B. Manuscript preparation: W.J.B., A.J.R., M.N.T., F.H., R.B.B., W.P. All authors have read and
agreed to the published version of the manuscript.
Competing interests
The authors declare no competing interests.
Additional information
Supplementary Information The online version contains supplementary material available at https://doi.org/
10.1038/s41598-021-97925-w.
Correspondence and requests for materials should be addressed to W.P.
Reprints and permissions information is available at www.nature.com/reprints.
Publisher’s note Springer Nature remains neutral with regard to jurisdictional claims in published maps and
institutional affiliations.
Open Access This article is licensed under a Creative Commons Attribution 4.0 International
License, which permits use, sharing, adaptation, distribution and reproduction in any medium or
format, as long as you give appropriate credit to the original author(s) and the source, provide a link to the
Creative Commons licence, and indicate if changes were made. The images or other third party material in this
article are included in the article’s Creative Commons licence, unless indicated otherwise in a credit line to the
material. If material is not included in the article’s Creative Commons licence and your intended use is not
permitted by statutory regulation or exceeds the permitted use, you will need to obtain permission directly from
the copyright holder. To view a copy of this licence, visit http://creativecommons.org/licenses/by/4.0/.
© The Author(s) 2021
Scientific Reports | (2021) 11:18450 | https://doi.org/10.1038/s41598-021-97925-w 11
Vol.:(0123456789)You can also read