ABSTRACT IMAGING TRANSCRIPTOMICS OF BRAIN DISORDERS - PSYARXIV
←
→
Page content transcription
If your browser does not render page correctly, please read the page content below
Imaging transcriptomics of brain disorders

                 Aurina Arnatkeviciute1, Ben D. Fulcher2, Mark A. Bellgrove1, and Alex Fornito1
      1
      The Turner Institute for Brain and Mental Health, School of Psychological Sciences, Monash University, Victoria, Australia.
                          2
                            School of Physics, The University of Sydney, Camperdown, NSW 2006, Australia.

                                                           Abstract
Non-invasive neuroimaging is a powerful tool for quantifying diverse aspects of brain structure and function in
vivo and has been used extensively to map the neural changes associated with different brain disorders. However,
most neuroimaging techniques have limited spatiotemporal resolution and offer only indirect measures of
underlying pathological mechanisms. The recent development of anatomically comprehensive gene-expression
atlases has opened new opportunities for studying the transcriptional correlates of non-invasively measured neural
phenotypes, offering a rich framework for evaluating pathophysiological hypotheses and putative mechanisms.
Here, we overview some fundamental methods in imaging transcriptomics and outline their application to
understanding brain disorders of neurodevelopment, adulthood, and neurodegeneration. Converging evidence
indicates that spatial variations in gene expression are linked to normative changes in brain structure during age-
related maturation and neurodegeneration that are in part associated with cell-specific gene expression markers
of gene expression. Transcriptional correlates of disorder-related neuroimaging phenotypes are also linked to
transcriptionally dysregulated genes identified in ex vivo analyses of patient brains. Modeling studies demonstrate
that spatial patterns of gene expression are involved in regional vulnerability to neurodegeneration and the spread
of disease across the brain. This growing body of work supports the utility of transcriptional atlases in testing
hypotheses about the molecular mechanism driving disease-related changes in macroscopic neuroimaging
phenotypes.

Keywords: brain imaging, gene expression, connectome, psychiatric disorders, neurodevelopment,
neurodegeneration
Introduction

The advent of magnetic resonance imaging (MRI) ushered a new era of biological psychiatry, arming researchers
with a powerful tool for studying the neural correlates of mental illness non-invasively. Thousands of research
articles published in the intervening years have shed important light on the disruptions of brain structure and
function that occur in association with a diverse range of psychiatric disorders. However, due to the limited
spatiotemporal resolution of current MRI and other imaging methods and the biophysical properties of the
acquired signals, the resulting imaging-derived phenotypes (IDPs) often represent indirect proxies for the cellular
and molecular processes that ultimately drive disease pathophysiology. As a result, in vivo neuroimaging is an
excellent tool for mapping where changes occur in the brain, and at which specific stage of disease, but it can
offer only limited insight into the physiological mechanisms that underpin these changes.

Over the past two decades, imaging genetics has offered a means for studying the molecular basis of disease-
related IDPs. A growing body of literature indicates that genetics play a substantial role in shaping how the brain
is organized (Arnatkeviciute, Fulcher, Bellgrove, et al., 2021; Bigos & Weinberger, 2010; Fornito et al., 2019;
Hashimoto et al., 2015; Thompson et al., 2001, 2013). Heritability studies show that a range of IDPs are highly
heritable (Arnatkeviciute, et al., 2021; Baaré et al., 2001; Ge et al., 2017; Pizzagalli et al., 2020; Shen et al., 2014;
Thompson et al., 2013) and genome wide association studies (GWAS) have begun to identify robust links to DNA
variation (Elliott et al., 2018; Hibar et al., 2015; Smith et al., 2021; Zhao et al., 2019), uncovering hundreds of
associations between single nucleotide polymorphisms (SNPs) and diverse measures of brain structure, function,
and connectivity (Elliott et al., 2018; Hibar et al., 2015, 2017; Jansen et al., 2019; Satizabal et al., 2019; Smith et
al., 2020).

The general assumption in imaging genetics research is that DNA variants implicated in GWAS, or variants in
linkage disequilibrium, impact protein expression and/or function, thereby influencing cellular form and
physiology to give rise to phenotypic variability. However, multiple factors can influence the transcriptional
activity of a gene and the subsequent abundance of its protein product (Choi & Kim, 2007; Cole, 2009; Fraser et
al., 2005), meaning that allelic variations of DNA can be somewhat distant from the molecular mechanisms
influencing a particular phenotype. Studies of gene expression can more directly interrogate the transcriptional
activity of genes, as measured in post-mortem specimens. Due to the complexities of tissue curation, processing,
and analysis, such investigations have historically been limited to small subsets of brain regions, precluding an
opportunity to link disease-related changes in gene expression to bran-wide IDPs. Over the past decade, advances
in high-throughput tissue processing and analysis pipelines have facilitated the development of brain-wide gene-
expression atlases (M. J. Hawrylycz et al., 2012; Lein et al., 2007), opening new opportunities to investigate how
the spatial patterns of gene expression relate to anatomical variations in brain structure and function in both health
and disease [for a review see (Fornito et al., 2019)]. Of particular relevance to psychiatry, this emerging field of
imaging transcriptomics makes it possible to generate and test hypotheses about the transcriptional correlates of
disease-related changes in IDPs, offering a bridge between molecular function and macroscale measures of brain
dysfunction.

In this review, we consider how imaging transcriptomics can shed light on putative pathophysiological
mechanisms in psychiatric disorders. We first overview some fundamental methods in the field and then examine
applications of these methods to understand neurodevelopment, neuropsychiatric illness, and neurodegeneration.
These studies indicate that regional gene-expression patterns are related to normative changes in brain structure
during age-related maturation and neurodegeneration. Genes related to synaptic signaling, metabolism, and other
neurobiologically relevant categories are consistently associated with clinical alterations in neuropsychiatric
disorders. Disorder-associated expression signatures tend to involve transcriptionally dysregulated genes in post-
mortem brain tissues of patients. Moreover, spatial patterns of gene expression play a role in both regional
vulnerability to neurodegeneration and the spread of neurodegeneration across the brain. Finally, we discuss some
methodological challenges and consider future directions for the field.

Fundamental methods of imaging transcriptomics

Brain-wide imaging transcriptomic studies rely on transcriptional atlases that assay gene expression across
multiple locations in the brain. The methods available for quantifying gene expression depend on a range of factors
including the organism of interest, tissue availability, and the required spatial resolution. In smaller species such
as mice, where specimens are more readily available, gene expression can be measured using in situ hybridization
(Lein et al., 2007) where the transcriptional activity of each gene is measured in separate tissue samples at a
cellular resolution. Tissue availability in humans is very limited, so bulk-tissue microarray (Schulze & Downward,
2001) remains the most accessible method for high-throughput spatial transcriptomics in humans (Hawrylycz et
al., 2012). With microarray, the expression levels of thousands of genes are quantified simultaneously using a
single tissue sample. The Allen Human Brain Atlas (AHBA) provides the most anatomically comprehensive gene-
expression data for the human brain, quantifying expression levels of more than 20,000 genes in 3702 different
regions using microarray (Hawrylycz et al., 2012). Although atlases for developmental (Kang et al., 2011) and
human-specific spatiotemporal gene-expression patterns (Sousa et al., 2017) are also available, the spatial
coverage of these atlases is much sparser compared to AHBA, extending across only 16 brain regions [for an
overview of different gene expression atlases see (Keil et al., 2018)]. The AHBA therefore represents the most
readily accessible resource for linking measures of gene expression to a given brain-wide IDP.

Several considerations about the AHBA must be borne in mind. First, the atlas comprises data from only six
individuals, precluding an opportunity to study in detail individual variability in regional gene expression. While
it appears that expression differences are greater across regions than between people (Hawrylycz et al., 2015), the
full extent and functional significance of inter-individual variation in gene expression remains unclear. Second,
all measures are derived from adult brains, with donors ranging in age from 24 to 57 years; variations in expression
may therefore be related to the myriad endogenous and exogeneous factors that can influence transcriptuonal
activity (Kanherkar et al., 2014). While many genes show neotenous patterns of expression (Goyal et al., 2014),
many others show marked changes in transcriptional activity across the lifespan (Berchtold et al., 2008; Işıldak et
al., 2020). These changes can be tracked for some brain regions through developmental gene-expression atlases
(Kang et al., 2011; Miller et al., 2014), but our understanding of regional differences in the transcriptional activity
of different genes remains incomplete. Third, as gene expression in the AHBA is assayed using bulk tissue

microarray, regional differences in gene expression could reflect variations in the cellular, functional, or
anatomical composition of that region. Single-cell transcriptomics offers a way of disentangling these
contributions, but the anatomical coverage of these atlases remains limited in comparison (Harris et al., 2018;
Lake et al., 2016; Yao et al., 2021). Finally, the relationship between the transcriptional and translational activity
of a gene is complex and influenced by multiple factors (Greenbaum et al., 2003; Gygi et al., 1999; Schwanhäusser
et al., 2011). It is ultimately the latter that determines protein form and abundance and thus cellular function.
Transcriptional atlases thus offer an indirect marker of more proximal molecular drivers of phenotypic variation.

Three main categories of analyses are performed in imaging transcriptomics (Figure 1a). One focuses on regional
gene-expression patterns and aims to identify correlations between spatial variations in gene expression and
anatomically defined IDPs across spatial locations (Romme et al., 2017; Seidlitz et al., 2020). A second category
of analyses considers correlated gene expression (CGE), which quantifies the transcriptional similarity between
pairs of regions across a set of genes. CGE can then be related to IDPs defined at the level of pairs of brain regions,
such as measures of structural or functional connectivity (Arnatkeviciute, et al., 2021; Arnatkevic̆iūtė et al., 2018;
Fulcher & Fornito, 2016; Richiardi et al., 2015). A third analysis category examines gene coexpression, which
quantifies the similarity of spatial expression profiles between pairs of genes, resulting in a gene ´ gene matrix.
Statistical summaries of these gene ´ gene matrices, such as ‘eigengene’ measures of coherent subsets of
coexpressed genes, have been computed and related to IDPs (Forest et al., 2017; Oldham et al., 2008). Note that
in the literature, ‘gene coexpression’ has also been used to refer to analyses of CGE (Fulcher & Fornito, 2016;
Romero-Garcia et al., 2018).

An important consideration in any of these analyses is that both neuroimaging and transcriptional measures
typically exhibit some degree spatial autocorrelation, meaning that values in different brain regions are not
independent of each other. This spatial autocorrelation commonly takes the form of a decaying distance
dependence between regional expression values, such that regions physically closer to each other have values that
are more highly correlated than pairs of distant regions (Alexander-Bloch et al., 2013; Burt et al., 2018; Henderson
& Robinson, 2014; Lau et al., 2021; Roberts et al., 2016; Salvador et al., 2005). This dependence must be
accounted for to ensure valid inference, and multiple approaches have been used (Alexander-Bloch et al., 2019;
Arnatkeviciute, Fulcher, Oldham, et al., 2021; Burt et al., 2018, 2020; Fulcher & Fornito, 2016; Selvaggi et al.,
2021; Váša et al., 2018; Vértes et al., 2016; Wei et al., 2021). A comprehensive comparison of the efficacy of
some of these approaches is provided by Markello and Misic (2020).
Gene A             Gene B                       Gene C                   Gene D
   a

                                                                                                                                 Correlated gene
                                                                                                                                   expression
                                                                                                                          r1,2
            Regions

                                                               Genes
                                              rA,B                                                                  d
                          Gene coexpression                                 Regional expression
                                                                                                                                   Gene C
                                                                              c
   b
                      Regional IDP

                                                                                  Gene expression                                  Gene D

  Controls                        Cases                Difference map                       Case-control difference map

                                                                                                                                   Gene n
Figure 1 Approaches for relating gene expression to neuroimaging data. a) Transcriptional atlas data can be collated into a region x gene
matrix, from which different estimates of gene expression can be quantified. In this example, the regional expression profile of any given
gene, indicating the spatial patterning of the gene’s transcriptional activity, corresponds to a single column of the matrix. A given region’s
expression profile across genes corresponds to a row of the matrix. Correlated gene expression (CGE) is therefore calculated by correlating
pairs of rows (resulting in region x region similarity matrix), while gene coexpression is calculated by correlating pairs of columns (resulting
in gene x gene similarity matrix). b) When applied to brain disorders, spatial maps of a given IDP measures in cases and controls are compared
to yield some kind of difference map. This difference map is then correlated (c) with the spatial maps of each gene (d) in a hypothesis- or
data-driven method. Genes associated with high spatial correlations to the difference map represent transcriptional correlates of the IDP.

Imaging transcriptomics has been most commonly deployed in clinical contexts to investigate associations at the
level of brain regions. More specifically, these analyses involve comparing a spatial map that quantifies case-
control differences in a given IDP to the spatial expression pattern of each gene in either a hypothesis-driven or
data-driven way (Figure 1b). Hypothesis-driven analyses typically focus on specific sets of genes identified a
priori whereas data-driven approaches aim to identify patterns across thousands of genes, which involves scoring
each gene based on its association with a given IDP, either using mass univariate, gene-specific analyses, or
multivariate approaches that relate IDPs to linear combinations of genes (Fulcher & Fornito, 2016; Gao et al.,
2020; Hansen et al., 2021; Richiardi et al., 2015; Seidlitz et al., 2020; Vértes et al., 2016; Whitaker et al., 2016).
Based on experimental and theoretical evidence, genes have been grouped according to their biological and
molecular functions, making it possible to test for the enrichment or over-representation of certain classes of genes
using established annotation systems such as the Gene Ontology (GO) (Ashburner et al., 2000) or the Kyoto
Encyclopedia of Genes and Genomes (KEGG) (Kanehisa & Goto, 2000) through Gene Category Enrichment
Analyses (GCEA). A range of statistical methods have been developed to accommodate different implementations
of these analyses. For instance, when continuous gene scores are used GCEA tests whether a summary score for
each category is higher than expected given some null distribution (Subramanian et al., 2005). Over-representation
analysis (ORA), on the other hand, is used for thresholded lists of genes, where the purpose of the analysis is to
determine if there are any gene sets that are statistically over-represented in that list compared to chance.
Appropriate null models for such analyses are an active area of development (Burt et al., 2020; Fulcher et al.,
2021; Wei et al., 2021). In a recent study, Fulcher et al. (2021) showed that standard null models can dramatically
inflate false positive rates across GO categories. We will discuss some of these issues in more detail below, but
the caveats are important to keep in mind when interpreting the findings presented in the literature. A further
complication is that the gene expression data must be processed before they can be related to imaging measures.
This processing involves multiple steps, each of which requires choices between different processing options
(Arnatkeviciute et al., 2019) that can have a substantial effect on the final results (Markello et al., 2021; Selvaggi
et al., 2021) and care should be taken when thinking about data processing. The recently developed abagen
toolbox can assist in running consistent workflows (Markello, 2021).

Neurodevelopment and its disorders

Age-related changes in cortical structure and function are associated with normal brain development (Giedd &
Rapoport, 2010; Gilmore et al., 2018; Knickmeyer et al., 2008), with cortical thinning being regarded as a
morphological hallmark of cortical maturation (Amlien et al., 2016; Tamnes et al., 2017). Brain-wide changes in
cortical thickness, mostly involving cortical thinning, are also associated with a range of psychiatric disorders
(Khundrakpam et al., 2017; Narr et al., 2009; Niu et al., 2017; Suh et al., 2019; van Haren et al., 2011). Cortical
thickness differences observed in many neurodevelopmental disorders, including schizophrenia, are thus often
thought to arise from altered trajectories of brain maturation (Gogtay et al., 2011; Häfner et al., 1994). These
cortical thickness changes may be driven by changes to neuronal and/or synaptic size and/or density or the
myelination of fibers penetrating the cortical mantle (Natu et al., 2019).

To shed light on the molecular correlates of brain changes that occur in both normal and aberrant
neurodevelopment, imaging transcriptomic studies have used the expression profiles of specific cell-type marker
genes to identify cellular corelates of these IDPs. The expression levels of cell-specific marker genes have been
shown to act as indirect proxies for the relative abundance and/or function of each cell type (Mancarci et al., 2017;
Zeisel et al., 2015). A correlation between the cell-type marker and the IDP is regarded as implicating that cell
type as being linked to the phenotype, but such correlational relationships should be interpreted with some caution.
Indeed, while the relationship between gene expression and cell abundance for some cell types is very strong, not
all cell-type markers demonstrate the same degree of correspondence (Fulcher, 2019).

One analysis of cell-type markers found that regional variations of the magnetization transfer ratio (MTR), which
is commonly used to index myelin content (Schmierer et al., 2004), are associated with CA1 pyramidal and
ependymal cells, but not myelination, in mid-adolescence (mean age = 14 years) (Patel et al., 2019). Considering
that the CA1 pyramidal gene-set is enriched in genes that are also related to dendritic organization, the authors
suggest that variations in MTR across the brain could be related to regional differences in dendritic arborization.
Subsequent longitudinal changes in MTR from mid-to-late adolescence, however, were related to the expression

of oligodendrocyte cell markers and genes involved in myelination (Patel et al., 2019). Similar associations
implicating oligodendrocyte and neurotransmission-related genes were found in relation to changes in both MTR
and cortical thickness between 14 and 24 years through the partial least squares (PLS) regression (Whitaker et al.,
2016). The fact that a single PLS component demonstrated associations with both measures implies that cortical
myelination and thinning may act together as mechanisms of cortical consolidation that are at least in part driven
by genes with correlated expression patterns. Other studies, conducted both cross-sectionally and longitudinally,
indicate that transcriptional markers of astrocytes, microglia, and CA1 pyramidal cells are linked to thicker cortex
in young individuals and enhanced cortical thinning later in life, as shown in Figure 2a (Shin et al., 2018; Vidal-
Pineiro et al., 2020). This suggests that changes in cortical thickness across the lifespan are closely tied to the
expression levels of these genes. Dendritic spine- and dendrite-related genes show associations with cortical
thinning in late childhood (9-12 years) and late adolescence (17-19 years), whereas myelin-specific genes were
related to cortical thinning in mid-adolescence (12-15 years) (Parker et al., 2020). Moreover, the directionality of
the relationship changed over time such that in early maturation, regions with higher expression of those genes
showed greater cortical thinning; in later stages, greater cortical thinning was observed in regions with lower
expression. Multivariate analyses have further indicated that accelerated cortical thinning during the period from
3 to 21 years is associated with increased expression of gene markers for inhibitory and excitatory neurons, in
addition to genes linked to synaptic remodeling and neurodevelopment, mood, and addiction disorders (Ball et
al., 2020). The spatial expression patterns across different gene groups can explain a large proportion of variation
in average cortical thickness across regions, accounting for up to 70% early in life (Shin et al., 2018).

a                                                                           b               CNV enrichment

                                                                                  Chromosome
                                                                                                  PLS rank
                                                                                                                        Morphometric
                                                                                                                       similarity change

    c

Figure 2. Transcriptional correlates of neurodevelopment and neurodevelopmental disorders. a) The relationship between cortical
thinning profile (i.e., the degree of cortical thinning per year) throughout life and gene expression in each of 9 cell types. Both in early and
late life, significant associations (indicated by circles) were identified for astrocyte, microglia and CA1 pyramidal cell markers. b) Regional
morphometric similarity change observed in Turner syndrome (characterized by the loss of the X-chromosome) and chromosome ranking
from a PLS analysis, based on the median rank of gene loadings on a PLS-derived latent variable linking gene expression with regional
morphometric similarity change. The chromosomal gene set for the X chromosome shows the lowest rank, which is consistent with the
chromosomal deletion known to cause the disorder. c) Correspondence between brain changes in ADHD and gene expression. Left: differences
in cortical thickness, surface area and subcortical volumes in ADHD as identified by the ENIGMA Consortium, where larger positive Cohen’s
d correspond to decreases in a particular measure in ADHD patients vs controls. Right: the relationship between regional brain volumes and
the expression of genes involved in apoptosis, autophagy, neurodevelopment, neurotransmission and oxidative stress-related genes. Apoptosis,
autophagy and neurodevelopment-related genes demonstrate significant negative associations such that higher expression of those genes is
associated with reductions in brain volume in ADHD patients. Panel a adapted with permission from (Vidal-Pineiro et al., 2020). Panel b
adapted with permission from (Seidlitz et al., 2020). Panel c adapted with permission from (Hess et al., 2020).

A recent study of different neurogenetic conditions has shown the potential power of imaging transcriptomics for
identifying pathophysiologically relevant links between IDPs and spatial gene expression patterns. The conditions
considered are caused by well-localized genomic copy number variations (CNVs), including Turner syndrome,
Velocardiofacial syndrome, Down syndrome, Wilms Tumor−Aniridia syndrome, and sex chromosome
aneuploidies (XXX, XXY, XYY, XXYY) (Seidlitz et al., 2020). The distinct gene sets defining each of these
conditions are known, leading to clear hypotheses about which specific genes should show correlated expression
patterns with macroscale imaging measures of brain pathology. In this particular analysis, the authors focused on
the average morphometric similarity (MS) of each region to all other brain areas, with MS defined as inter-regional
correlations across multiple imaging measures of regional neuroanatomy and microstructure (Seidlitz et al., 2020).
The analysis revealed that regional differences in MS between cases and controls were related to the specific
spatial expression of causal genes for each disorder (Figure 2b). Similar approaches have been applied to
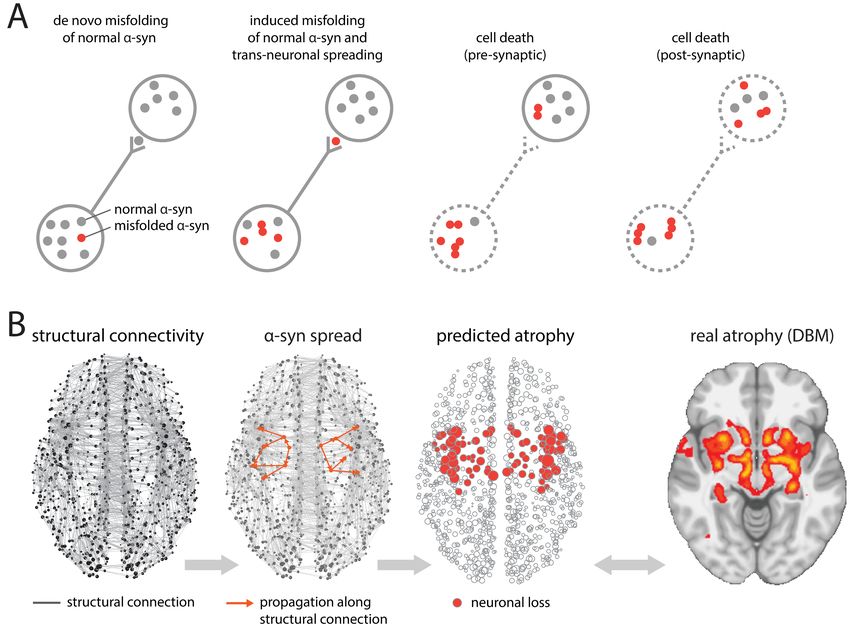
neurodevelopmental disorders with more complex genetics, such as attention-deficit hyperactivity disorder
(ADHD) and autism spectrum disorder (ASD). Measures of ADHD-associated decreases in subcortical volume,
cortical thickness, and surface area, estimated in two large samples through analysis of ENIGMA Consortium
data, were consistently associated with genes implicated in apoptosis and autophagy pathways, such that higher
expression of those genes corresponded to stronger decreases in these brain measures (Hess et al., 2018,
2020)(Figure 2c). Moreover, cell deconvolution analysis, which aims to infer cell-type abundance from gene-
expression levels, identified that smaller regions had elevated levels of astrocytes and oligodendrocyte progenitor
cells, implying a compensatory response of glial cells (Hess et al., 2020). In ASD, two separate studies provide
convergent evidence that changes in both cortical thickness (Romero-Garcia et al., 2019) and regional volumes
(Xie et al., 2020) are related to the expression of genes that are transcriptionally downregulated in ASD post-
mortem cortical tissue. Additionally, the regional distribution of cortical-thickness alterations observed in ASD
was also associated with synaptic transmission genes (Romero-Garcia et al., 2019) whereas changes in regional
volumes were associated with nervous system and ion transport-related genes (Xie et al., 2020).

Together, this work indicates that developmental alterations in cortical properties are associated with the
expression of cell-type marker genes, supporting a link between cellular properties and macroscale phenotypes
measured using non-invasive brain imaging. In particular, the analyses of neurogenetic conditions with known
genetic origins serve as evidence for the utility of imaging transcriptomics for investigating the genetic correlates
of disorder-associated changes.

Psychiatric disorders
Cell-type marker gene analyses have also been applied to study disorders with onset later in life. Using data from
the ENIGMA consortium, one study found that the spatial patterning of cortical thickness differences between
cases and controls for 6 psychiatric disorders, including ADHD, ASD, major depression, OCD, bipolar disorder,
and schizophrenia, is consistently related to the regional expression of transcriptional markers for CA1 pyramidal
cells, astrocytes, and microglia (Patel, Yash et al., 2021) (Figure 3a). These same cell-specific groups of genes
have been consistently linked to cortical thickness across the lifespan (Shin et al., 2018; Vidal-Pineiro et al., 2020),
pointing to shared genetic mechanisms linking neurodevelopmental and adult psychiatric disorders.

a                                                                                 b

                                                                                                                                   Expression (z)
                     First principal component of                                                  f      Lower GBC
           cortical thickness differences across 6 disorders                                           in SST-dense cortex                          SST
                                                                                                                     rs = -0.40*

                                                                             Gene expression (z)
                                                                                                                     rs = -0.33*
                                                                                                                     rs = -0.40*

                                                                                                                                   Expression (z)
                                                                                                                                                    CORT

                Distribution of correlation coefficients

                                                                                                                                   Expression (z)
                                                                                                                                                    NPY
                                                                                                          Cohen’s d
                         Correlation coefficient, rbicor

     b
c                     r = 0.37, p
Other work has focused on various aspects of brain connectivity, in line with the dysconnectivity hypothesis of schizophrenia (Fornito et al., 2012; Stephan et al., 2009). Connectivity can been assessed indirectly, using MS networks (Seidlitz et al., 2018) or structural covariance networks, which quantify inter-regional coupling of morphometric measures such as grey-matter volume or cortical thickness (Alexander-Bloch et al., 2013; Gong et al., 2012; Goulas et al., 2017), or more directly using diffusion MRI (Heuvel et al., 2010; Zalesky et al., 2011, see also (Fornito et al., 2012)). Regional mean MS differences between cases and controls have been linked to the expression of genes regulating synaptic signaling, nervous system development and the adenylate cyclase- modulating G-protein coupled receptor signaling pathway that is responsible for changes in the concentration of cyclic AMP, a molecule used in intracellular signal transduction (Morgan et al., 2019) (Figure 3c). Moreover, genes that were overexpressed in regions with reduced MS were significantly upregulated in post-mortem studies of schizophrenia, suggesting a tight coupling between ex vivo measures and the transcriptional correlates of IDPs measured in vivo. Regional white-matter dysconnectivity in schizophrenia, quantified with diffusion MRI, was significantly correlated with the spatial profile of schizophrenia-related genes identified through the same GWAS (Romme et al., 2017), providing a direct link between structural risk variants, gene expression, and macroscale alterations of connectivity in the disorder. Notably, connectivity changes in bipolar disorder were associated with the expression of risk genes implicated in bipolar disorder, but not schizophrenia, suggesting some level of diagnostic specificity to these associations. There is also some evidence that these genes are specifically linked to diffusion MRI IDPs, given that they have shown only weak associations with other measures (Liu et al., 2019). Studies of Major Depressive Disorder (MDD) have consistently identified links between IDPs and the spatial expression pattern of genes that are also transcriptionally dysregulated in post-mortem studies. Li et al. (2021) used multivariate analysis to identify linear combinations of almost 3000 genes enriched in synapse-related terms and other neurobiologically relevant categories that were related to regional case-control differences in MS. Thirty-four of those genes were also transcriptionally dysregulated in post-mortem tissues, mirroring previous findings (Anderson, Collins, Kong, et al., 2020; Romero-Garcia et al., 2020). These associations were specific to depression and not evident for genes dysregulated in other psychiatric disorders (Li et al., 2021). Functional MRI analysis has revealed that temporal fluctuations in regional signal homogeneity are linked to the expression of several neurobiological gene categories that include synaptic signaling, metabolism, central nervous system development, and neurodegenerative disease (Xue et al., 2020). In a separate study, regional changes in anatomical and functional properties of the brain linked to a history of depression and negative affect were investigated across three large-scale neuroimaging cohorts (Anderson, Collins, Kong, et al., 2020). Depression- related brain-wide decreases in resting state functional amplitude, mean regional strength of functional connectivity and cortical thickness were correlated with gene markers for somatostatin interneurons, in line with the hypothesis that the dysfunction of cortical somatostatin interneurons plays a central role in the onset of depression (Figure 3b). Moreover, these depression-related changes in anatomical and functional maps were correlated with the spatial expression pattern of genes down-regulated in post-mortem specimens from patients. Such associations were not found for other psychiatric disorders, again supporting the specificity of these links between imaging and transcriptional measures (Anderson, Collins, Kong, et al., 2020).
In summary, across different psychiatric disorders and imaging modalities, genes that are spatially correlated with
disorder-related changes in brain structure or function tend to overlap with genes that are transcriptionally
dysregulated in post-mortem samples derived from clinical populations, and/or genes implicated in disease risk
by large-scale GWAS. While there is evidence of diagnostic specificity in some of these associations, some
transcriptional correlates are consistent across disorders and may reflect common genetic influences on disease
risk (Patel, Yash et al., 2021).

Neurodegeneration and associated disorders

Neurodegenerative diseases, such as Huntington’s disease (HD), Alzheimer’s disease (AD) and Parkinson’s
disease (PD), are associated with characteristic neurodegenerative patterns (Ballatore et al., 2007; Johnson et al.,
2021; Seeley, 2017) that are linked to the accumulation of particular neurochemical agents such as amyloid β-
protein (Aβ) and tau in AD, and α-synuclein in PD (Ballatore et al., 2007). Transcriptional atlas data can be used
to identify the molecular correlates of regional vulnerability to disorder-specific neurodegeneration and help
understand how the disease spreads across the brain. For instance, Huntington’s disease is caused by a mutation
in the single gene, HTT (Myers, 2004), but imaging transcriptomics has begun to shed light on other potential
molecular pathways related to brain-wide dysfunction in the disorder, given evidence that degeneration of cortico-
striatal and inter-hemispheric connectivity in pre-manifest HD has been associated with the spatial expression
patterns of genes related to chemical synaptic transmission and cell projections, with the genes most strongly
linked to the IDPs also being transcriptionally dysregulated in post-mortem studies of patients (McColgan et al.,
2018).

In comparison to HD, the genetic mechanisms underlying risk for Alzheimer’s disease are more complex (Jansen
et al., 2019). Cell-type specific marker analyses indicate that decreases in cortical thickness in AD patients
compared to healthy subjects are linked to the expression of the same cell-specific gene groups that are involved
in both age-related changes in cortical thickness and psychiatric disorders; namely CA1 pyramidal cells,
microglia, and astrocytes (Figure 4a). Moreover, genes that were co-expressed with microglial genes were
significantly enriched for AD risk, providing a direct link to the aetiology of the disease and implying a critical
role for neuroinflammation (Vidal-Pineiro et al., 2020). One study first identified spatial clusters of voxels that
showed reduced volume in people carrying a higher number of AD risk alleles (Roshchupkin et al., 2016). These
reductions were then investigated in relation to the expression patterns of genes that are in close proximity to AD
risk loci resulting in a set of 216 genes. Although only five of those genes showed significant associations with
the volumetric reductions, three of them (MEF2C, CLU and SLC24A4) were previously identified as AD risk
genes, linking the spatial patterning of gene expression back to structural risk variants.

Type 2 diabetes (T2D) is associated with increased risk for AD (Lu et al., 2009). Nugent et.al. (2020) investigated
the expression of genes that are close to 46 T2D risk SNPs and found that the spatial expression patterns of just 5
of these genes could explain more than 70% of variance in regional glucose metabolism uptake in both healthy
and probable AD groups, thus demonstrating a link between risk factors for T2D and glucose metabolism in both
normal aging and AD. Similar findings were demonstrated in PD, where regional expression of only 17 genes that
were previously implicated in the disease explained 42% of variance in regional disease-related atrophy patterns
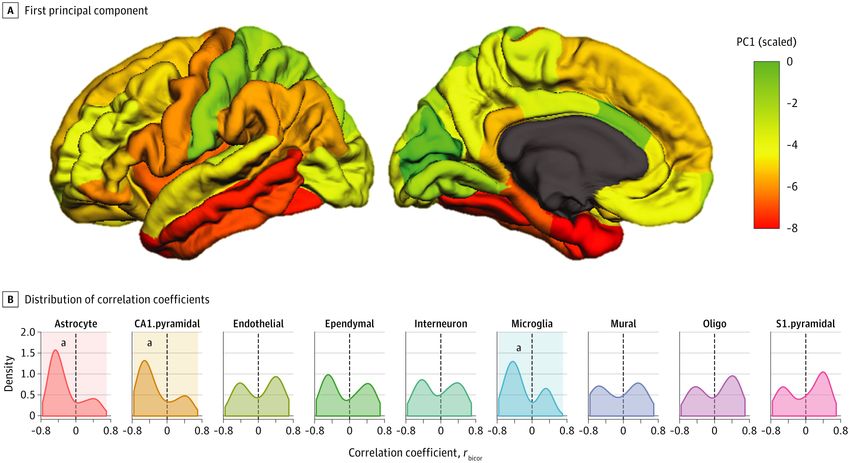
(Freeze et al., 2018). Regional gene expression could also explain 20% of variance in quantitative susceptibility
mapping measures, which index iron deposition (Thomas et al., 2021) (Figure 4b). Genes associated with iron
deposition were transcriptionally dysregulated in post-mortem specimens of patients with PD, PD with dementia
and dementia with Lewy bodies, pointing to common mechanisms that drive regional susceptibility to
neurodegeneration across diagnostic categories.

Other hypothesis-driven work has supported the general involvement of the tau protein in different
neurodegenerative conditions. Regional expression of the MAPT gene, which codes for the tau protein is
associated with the severity of neurodegeneration in Alzheimer’s disease (Grothe et al., 2018) and has been linked
to reduced functional connectivity in patients with Parkinson’s disease (Rittman et al., 2016). At the same time,
the expression of APP, a gene that encodes amyloid precursor protein, was associated with regional amyloid
burden, but not neurodegeneration (Grothe et al., 2018). Together the results from these two studies suggest that
the spread of neurodegeneration in both AD and PD is primarily mediated by tau pathology.

Multiple lines of evidence suggest that neurodegeneration across disorders originates in a relatively small number
of susceptible regions and then propagates along axonal pathways (Brettschneider et al., 2015; Desplats et al.,
2009; Fornito et al., 2015; Jucker & Walker, 2018). These spreading processes can be modelled mathematically
using various diffusion models simulated on an underlying brain-network architecture (Cornblath et al., 2021;
Pandya et al., 2019; Raj et al., 2012). One such model was used to predict the pathological seed regions and pattern
of disease spread in PD and then test the assumption that transcriptional profiles of 67 PD risk genes derived from
a GWAS are associated with disease origination and progression (Freeze et al., 2019). The results indicated that
the expression patterns of those genes are related to the likelihood of a region being identified as the initiation site
for the pathology and are related to early disease spread, but not the resulting regional atrophy pattern. More
specifically, the expression of several immune-related (HLA-DQA1, HLA-DRB6, IL1R2) and lysosomal (GBA,
TMEM175) PD risk genes was most strongly associated with seed regions consistent with a causal role of
lysosomal dysfunction and neuroinflammation in PD pathogenesis (Freeze et al., 2019). Another study proposed
an agent-based S-I-R model where the agents are individual proteins that spread to affect different regions in the
network, leading to regions having the status of either susceptible (S, yet to be infected), infected (I, capable of
transmitting the infection), or removed (R, no longer active in disease spread), as shown in Figure 4c (Zheng et
al., 2019). Incorporating the regional expression of SNCA and GBA genes, which are involved in the synthesis
and clearance of α-synuclein respectively, into the model improved the correspondence between modelled and
empirically-observed atrophy patterns in PD (Zheng et al., 2019). Extending this agent-based model to include a
factor responsible for the transmission probability of pathological agents, by incorporating the expression patterns
of the LRRK2 gene implicated in the development of PD through the transmembrane transport, further improved
model accuracy, supporting a role of LRRK2 in modulating the propagation of misfolded proteins (Yan et al.,
2020). Transcriptional atlas data thus provide a principled way of constraining and parameterizing models of
dynamical processes in both health and disease (see also Deco et al., 2021).
a  Density     Cell-specific gene expression through the AD continuum          c         Modeling neurodegenerative disease propagation

                              Correlation coefficient (r)

 b
                                    QSM score

                                                        PLS2 weight

Figure 4 Gene expression is related to neurodegeneration and neurodegenerative disease spread. a) Cell-specific marker association with
cortical thinning in AD. Correlation distributions quantifying the relationship between cell-specific gene expression profiles for CA1
pyramidal, microglia and astrocyte cell types and cortical thickness reductions in AD (AD vs healthy controls; AD vs Mild Cognitive
Impairment (MCI); MCI vs AD). Vertical axis denotes estimated probability density for the correlation coefficients. Vertical black line denotes
the average correlation coefficient across all genes; shaded grey box indicates the 95% limits of the empirical null distribution. b) Gene
expression is associated with cortical iron decomposition, quantified using quantitative susceptibility mapping (QSM), in Parkinson’s disease.
Cortical maps represent QSM scores and regional linearly weighted sum of gene expression scores defined by the PLS2. c) Schematic
representation of pathology spread across the brain: misfolded α -synuclein propagates via structural connections; simulated neuronal loss
(atrophy) is compared against empirical atrophy, estimated from Parkinson’s disease patients. Simulated and empirical atrophy patterns show
a high level of spatial correspondence (Spearman correlation, r = 0.63, p = 2 ´ 10-5). Panel a adapted with permission from (Vidal-Pineiro et
al., 2020). Panel b adapted with permission from (Thomas et al., 2021). Panel c adapted with permission from (Zheng et al., 2019).

Together, studies of neurodegeneration highlight the role of cell-specific and disorder-related genes in regional
vulnerability to neurodegeneration. Specifically, the involvement of CA1 pyramidal cells, microglia, and
astrocytes is evident across the lifespan, suggesting common mechanisms associated with healthy development,
ageing, and clinical neurodegeneration. Differences in regional vulnerability to neurodegeneration and subsequent
spread of the disease are also linked to the expression patterns of genes involved in disease pathology. The
integration of transcriptional atlas data with models of network dynamics appears to be a particularly fruitful
avenue for testing different hypotheses about disease evolution.

Challenges for the field
The findings considered here highlight the potential of imaging transcriptomics to identify the molecular
correlates of clinically relevant IDPs. However, the field is nascent and several methodological challenges must
be overcome to ensure the robustness of the findings. One such challenge is that the transcriptional atlas data often
require a degree of processing before they are ready for analysis. The processing involves several steps, including
mapping of tissue samples to regions of interest defined using a specified parcellation, selecting representative
gene probes to quantify the expression of a gene, and accounting for gene-expression differences between donor
brains. Some of these steps entail choices that can alter resulting spatial expression maps and affect the final results (Arnatkeviciute et al., 2019; R. D. Markello et al., 2021; Selvaggi et al., 2021). Just as variations in the processing of neuroimaging data can affect final outcomes (Aquino et al., 2020; Botvinik-Nezer et al., 2020; Ciric et al., 2017; Oldham et al., 2020; Parkes et al., 2018), different choices in the processing of expression data can influence one’s findings. Some of these choices have been investigated in detail, leading to the proposal of recommended workflows and open-source toolboxes (Arnatkeviciute et al., 2019; Markello et al., 2021). A second challenge is related to the intrinsic spatial autocorrelation of both gene expression and neuroimaging data. This autocorrelation is such that regions that are in close proximity to each other often exhibit more similar gene expression profiles and IDP values (Arnatkeviciute et al., 2019; Burt et al., 2018; Lau et al., 2021; Roberts et al., 2016; Salvador et al., 2005). Spatially autocorrelated gene-expression patterns are prominent across species, including in mouse (Fulcher & Fornito, 2016; Lau et al., 2021) and human (Arnatkeviciute et al., 2019; Krienen et al., 2016; Pantazatos & Li, 2017; Richiardi et al., 2015, 2017), with gene-expression correlations decaying approximately exponentially with separation distance. Moreover, the correlation length scales with brain size across mouse development (Lau et al., 2021). The spatial autocorrelation of gene-expression patterns results in non-independent spatial samples, and thus requires more careful statistical analysis than applying traditional statistical methods that assume independence. Accordingly, studies that have used parametric statistical methods or randomization approaches that do not preserve the intrinsic spatial autocorrelation of the data, will yield lenient estimates of statistical significance and inflate the false-positive rates (Markello & Misic, 2020). Alternative null models, such as premutation-based procedures that preserve the spatial structure of the data (A. F. Alexander- Bloch et al., 2019; Váša et al., 2018), model-based techniques that generate surrogate data that preserve spatial autocorrelation structure (Burt et al., 2018, 2020), or regression-based measures that account for distance effects (Fulcher & Fornito, 2016), are required for valid significance testing between spatial maps. Notably, the performance of different spatially constrained randomization techniques can depend on the research context (Markello & Misic, 2020). A third challenge relates to characterizing the specificity of gene effects in hypothesis-driven analyses. Are the observed effects for selected genes exclusive or could other gene sets show similar associations with IDPs? Gene specificity should be examined relative to randomly selected subsets of random genes of the same size as the hypothesized set. One recent study has demonstrated that even among the associations (identified through linear regression) that survive the spatial null significance testing, 42% are not specific to selected genes but can be found for a wide range of random genes, and only 5% of associations could surpass both spatial and random gene nulls, suggesting that gene and spatial specificity should be evaluated in tandem for appropriate significance testing (Wei et al., 2021). Moreover, other properties of spatial gene expression, such as their tissue specificity and the strength of coexpression between genes in a tested set, need to be considered in order to provide a null distribution that is adequate for evaluating the specificity of the relationships between IDPs and brain-specific variations in gene expression (Fulcher et al., 2021; Wei et al., 2021). A fourth challenge concerns statistical inference in GCEA. Traditional GCEA workflows were developed for the investigation of individual tissue samples or structural DNA variation and were not designed to deal with spatially embedded atlas data. The approaches have nonetheless been used in virtually all enrichment analyses in imaging
transcriptomics studies thus far. Under the traditional workflow, the statistical significance of a gene category is
computed with respect to a null distribution generated by randomizing gene-to-category assignments. Fulcher et
al. (2021) showed that this approach, when used to test for enrichment of correlations with random brain-wide
phenotypic maps, can lead to an average inflation in the false-positive rate across all GO categories exceeding
500-fold. The false-positive bias is largely driven by gene–gene coexpression within a category, such that
categories containing genes with more consistent expression patterns are more susceptible to this bias. This effect
is additionally modulated by gene-specific variations in spatial autocorrelation properties. These issues raise
concerns regarding to the validity of many enrichment analyses that apply GCEA to transcriptional atlas data,
considering that GO categories with the highest false-positive rates tend to be related to brain function and, as
shown by Fulcher et al. (2021), are among the most frequently reported in the literature. One way to address this
problem is to randomize the IDP rather than the gene-expression data. Depending on the hypothesis, it may be
appropriate to randomize the IDP in a way that accounts for its intrinsic spatial autocorrelation [e.g., (Burt et al.,
2020; Markello & Misic, 2020)]. With this approach, the number of significantly enriched categories observed
for several neural phenotypes measured in human and mouse dropped considerably when compared to the
standard implementation; for example, 9 out of 14 GCEA analyses performed by Fulcher et al. (2021) yielded
significantly enriched GO categories under the conventional null, whereas only one analysis revealed significant
enrichment under a random phenotype null and none under a null using random spatially autocorrelated
phenotypes null. These results highlight the importance of performing enrichment analyses with respect to
carefully designed null models and indicate the need for caution when interpreting GCEA reports in imaging
transcriptomics.

Conclusions
Imaging transcriptomics has been applied in diverse clinical settings across the lifespan. IDPs of
neurodevelopmental conditions have been linked to gene groups involved in cell death and neuronal
communication, or those known to play a causal role in the disorder. For disorders with later onset, specific
transcriptional correlates of IDPs are related to transcriptionally dysregulated genes in clinical post-mortem
samples and genes implicated in disease risk by GWAS. Transcriptional correlates of connectivity-related
phenotypes show some evidence of disorder specificity whereas those related to cortical thickness may be
disorder-general. In neurodegeneration, the expression of pathology-related genes for specific diseases is related
to regional vulnerability and spread of the disease.

As the field develops, we anticipate that the refinement of existing methodologies will enable more robust and
rigorous inference. Such methods, when coupled with increasingly more comprehensive and precise
transcriptional atlas data, measured across more individuals and multiple points across the lifespan, will offer a
powerful framework for identifying the molecular correlates of disease-related brain changes observed in vivo,
and thus for linking microscale models of disease pathophysiology with macroscale measures of brain
dysfunction.
Acknowledgements

AF was supported by the National Health and Medical Research Council of Australia (IDs: 1146292 and 1197431)
and Sylvia and Charles Viertel Charitable Foundation. MAB was supported by a National Health and Medical
Research Council of Australia Senior Research Fellowship.
References

Alexander-Bloch, A. F., Mathias, S. R., Fox, P. T., Olvera, R. L., Göring, H. H. H.,

       Duggirala, R., Curran, J. E., Blangero, J., & Glahn, D. C. (2019). Human Cortical

       Thickness Organized into Genetically-determined Communities across Spatial

       Resolutions. Cerebral Cortex (New York, NY), 29(1), 106–118.

       https://doi.org/10.1093/cercor/bhx309

Alexander-Bloch, A. F., Vértes, P. E., Stidd, R., Lalonde, F., Clasen, L., Rapoport, J., Giedd,

       J., Bullmore, E. T., & Gogtay, N. (2013). The anatomical distance of functional

       connections predicts brain network topology in health and schizophrenia. Cerebral

       Cortex (New York, N.Y.: 1991), 23(1), 127–138. https://doi.org/10.1093/cercor/bhr388

Alexander-Bloch, A., Giedd, J. N., & Bullmore, E. (2013). Imaging structural co-variance

       between human brain regions. Nature Reviews Neuroscience, 14(5), 322–336.

       https://doi.org/10.1038/nrn3465

Amlien, I. K., Fjell, A. M., Tamnes, C. K., Grydeland, H., Krogsrud, S. K., Chaplin, T. A.,

       Rosa, M. G. P., & Walhovd, K. B. (2016). Organizing Principles of Human Cortical

       Development—Thickness and Area from 4 to 30 Years: Insights from Comparative

       Primate Neuroanatomy. Cerebral Cortex, 26(1), 257–267.

       https://doi.org/10.1093/cercor/bhu214

Anderson, K. M., Collins, M. A., Chin, R., Ge, T., Rosenberg, M. D., & Holmes, A. J.

       (2020). Transcriptional and imaging-genetic association of cortical interneurons, brain

       function, and schizophrenia risk. Nature Communications, 11(1), 2889.

       https://doi.org/10.1038/s41467-020-16710-x

Anderson, K. M., Collins, M. A., Kong, R., Fang, K., Li, J., He, T., Chekroud, A. M., Yeo, B.

       T. T., & Holmes, A. J. (2020). Convergent molecular, cellular, and cortical
neuroimaging signatures of major depressive disorder. Proceedings of the National
Academy of Sciences. https://doi.org/10.1073/pnas.2008004117
Aquino, K. M., Fulcher, B. D., Parkes, L., Sabaroedin, K., & Fornito, A. (2020). Identifying
and removing widespread signal deflections from fMRI data: Rethinking the global
signal regression problem. NeuroImage, 212, 116614.
https://doi.org/10.1016/j.neuroimage.2020.116614
Arnatkeviciute, A., Fulcher, B., Bellgrove, M., & Fornito, A. (2021). Where the genome
meets the connectome: Understanding how genes shape human brain connectivity.
PsyArXiv. https://doi.org/10.31234/osf.io/hqgz7
Arnatkeviciute, A., Fulcher, B. D., & Fornito, A. (2019). A practical guide to linking brain-
wide gene expression and neuroimaging data. NeuroImage, 189, 353–367.
https://doi.org/10.1016/j.neuroimage.2019.01.011
Arnatkeviciute, A., Fulcher, B. D., Oldham, S., Tiego, J., Paquola, C., Gerring, Z., Aquino,
K., Hawi, Z., Johnson, B., Ball, G., Klein, M., Deco, G., Franke, B., Bellgrove, M. A.,
& Fornito, A. (2021). Genetic influences on hub connectivity of the human
connectome. Nature Communications, 12(1), 4237. https://doi.org/10.1038/s41467-
021-24306-2
Arnatkeviciute, A., Fulcher, B. D., Pocock, R., & Fornito, A. (2018). Hub connectivity,
neuronal diversity, and gene expression in the Caenorhabditis elegans connectome.
PLOS Computational Biology, 14(2), e1005989.
https://doi.org/10.1371/journal.pcbi.1005989
Ashburner, M., Ball, C. A., Blake, J. A., Botstein, D., Butler, H., Cherry, J. M., Davis, A. P.,
Dolinski, K., Dwight, S. S., Eppig, J. T., Harris, M. A., Hill, D. P., Issel-Tarver, L.,
Kasarskis, A., Lewis, S., Matese, J. C., Richardson, J. E., Ringwald, M., Rubin, G.M., & Sherlock, G. (2000). Gene Ontology: Tool for the unification of biology.
Nature Genetics, 25(1), 25–29. https://doi.org/10.1038/75556
Baaré, W. F. C., Hulshoff Pol, H. E., Boomsma, D. I., Posthuma, D., de Geus, E. J. C.,
Schnack, H. G., van Haren, N. E. M., van Oel, C. J., & Kahn, R. S. (2001).
Quantitative Genetic Modeling of Variation in Human Brain Morphology. Cerebral
Cortex, 11(9), 816–824. https://doi.org/10.1093/cercor/11.9.816
Ball, G., Seidlitz, J., Beare, R., & Seal, M. L. (2020). Cortical remodelling in childhood is
associated with genes enriched for neurodevelopmental disorders. NeuroImage, 215,
116803. https://doi.org/10.1016/j.neuroimage.2020.116803
Ballatore, C., Lee, V. M.-Y., & Trojanowski, J. Q. (2007). Tau-mediated neurodegeneration
in Alzheimer’s disease and related disorders. Nature Reviews Neuroscience, 8(9),
663–672. https://doi.org/10.1038/nrn2194
Berchtold, N. C., Cribbs, D. H., Coleman, P. D., Rogers, J., Head, E., Kim, R., Beach, T.,
Miller, C., Troncoso, J., Trojanowski, J. Q., Zielke, H. R., & Cotman, C. W. (2008).
Gene expression changes in the course of normal brain aging are sexually dimorphic.
Proceedings of the National Academy of Sciences, 105(40), 15605–15610.
Bigos, K. L., & Weinberger, D. R. (2010). Imaging genetics—Days of future past.
NeuroImage, 53(3), 804–809. https://doi.org/10.1016/j.neuroimage.2010.01.035
Botvinik-Nezer, R., Holzmeister, F., Camerer, C. F., Dreber, A., Huber, J., Johannesson, M.,
Kirchler, M., Iwanir, R., Mumford, J. A., Adcock, R. A., Avesani, P., Baczkowski, B.
M., Bajracharya, A., Bakst, L., Ball, S., Barilari, M., Bault, N., Beaton, D., Beitner, J.,
… Schonberg, T. (2020). Variability in the analysis of a single neuroimaging dataset
by many teams. Nature, 582(7810), 84–88. https://doi.org/10.1038/s41586-020-2314-
9Brettschneider, J., Tredici, K. D., Lee, V. M.-Y., & Trojanowski, J. Q. (2015). Spreading of
pathology in neurodegenerative diseases: A focus on human studies. Nature Reviews
Neuroscience, 16(2), 109–120. https://doi.org/10.1038/nrn3887
Burt, J. B., Demirtaş, M., Eckner, W. J., Navejar, N. M., Ji, J. L., Martin, W. J., Bernacchia,
A., Anticevic, A., & Murray, J. D. (2018). Hierarchy of transcriptomic specialization
across human cortex captured by structural neuroimaging topography. Nature
Neuroscience, 21(9), 1251–1259. https://doi.org/10.1038/s41593-018-0195-0
Burt, J. B., Helmer, M., Shinn, M., Anticevic, A., & Murray, J. D. (2020). Generative
modeling of brain maps with spatial autocorrelation. NeuroImage, 220, 117038.
https://doi.org/10.1016/j.neuroimage.2020.117038
Choi, J. K., & Kim, S. C. (2007). Environmental Effects on Gene Expression Phenotype
Have Regional Biases in the Human Genome. Genetics, 175(4), 1607–1613.
https://doi.org/10.1534/genetics.106.069047
Ciric, R., Wolf, D. H., Power, J. D., Roalf, D. R., Baum, G. L., Ruparel, K., Shinohara, R. T.,
Elliott, M. A., Eickhoff, S. B., Davatzikos, C., Gur, R. C., Gur, R. E., Bassett, D. S.,
& Satterthwaite, T. D. (2017). Benchmarking of participant-level confound regression
strategies for the control of motion artifact in studies of functional connectivity.
NeuroImage, 154, 174–187. https://doi.org/10.1016/j.neuroimage.2017.03.020
Cole, S. W. (2009). Social Regulation of Human Gene Expression. Current Directions in
Psychological Science, 18(3), 132–137. https://doi.org/10.1111/j.1467-
8721.2009.01623.x
Cornblath, E. J., Li, H. L., Changolkar, L., Zhang, B., Brown, H. J., Gathagan, R. J., Olufemi,
M. F., Trojanowski, J. Q., Bassett, D. S., Lee, V. M. Y., & Henderson, M. X. (2021).
Computational modeling of tau pathology spread reveals patterns of regionalYou can also read