Acoustofluidic phase microscopy in a tilted segmentation-free configuration - arXiv.org
←
→
Page content transcription
If your browser does not render page correctly, please read the page content below

Acoustofluidic phase microscopy in a tilted
segmentation-free configuration
Cite as: Biomicrofluidics 15, 014102 (2021); https://doi.org/10.1063/5.0036585
Submitted: 06 November 2020 . Accepted: 17 December 2020 . Published Online: 05 January 2021

  Julián Mejía Morales,     Björn Hammarström,        Gian Luca Lippi,   Massimo Vassalli, and   Peter Glynne-Jones

ARTICLES YOU MAY BE INTERESTED IN

Leveraging multimodal microscopy to optimize deep learning models for cell segmentation
APL Bioengineering 5, 016101 (2021); https://doi.org/10.1063/5.0027993

Injectable biocompatible poly(2-oxazoline) hydrogels by strain promoted alkyne–azide
cycloaddition
Biointerphases 16, 011001 (2021); https://doi.org/10.1116/6.0000630

Preface: A Two-Day Conference on Flexible Electronics for Electric Vehicles (FlexEV-2020)
AIP Conference Proceedings 2294, 010001 (2020); https://doi.org/10.1063/12.0001375

Biomicrofluidics 15, 014102 (2021); https://doi.org/10.1063/5.0036585                                      15, 014102

© 2021 Author(s).
Biomicrofluidics                                                                                 ARTICLE            scitation.org/journal/bmf

    Acoustofluidic phase microscopy in a tilted
    segmentation-free configuration
    Cite as: Biomicrofluidics 15, 014102 (2021); doi: 10.1063/5.0036585
    Submitted: 6 November 2020 · Accepted: 17 December 2020 ·                                                           View Online   Export Citation    CrossMark
    Published Online: 5 January 2021

    Julián Mejía Morales,1,2,a)              Björn Hammarström,3,4       Gian Luca Lippi,1        Massimo Vassalli,5
    and Peter Glynne-Jones3

    AFFILIATIONS
    1
        Institut de Physique de Nice, Université Côte d’Azur, CNRS, 06560 Valbonne, France
    2
        Department of Experimental Medicine, University of Genova, 16149 Genova, Italy
    3
        Engineering Sciences, University of Southampton, SO17 1BJ Southampton, United Kingdom
    4
        KTH Royal Institute of Technology, 100 44 Stockholm, Sweden
    5
        James Watt School of Engineering, University of Glasgow, G12 8LT Glasgow, United Kingdom

    a)
        Author to whom correspondence should be addressed: julian.mejia@inphyni.cnrs.fr

    ABSTRACT
    A low-cost device for registration-free quantitative phase microscopy (QPM) based on the transport of intensity equation of cells in continu-
    ous flow is presented. The method uses acoustic focusing to align cells into a single plane where all cells move at a constant speed. The
    acoustic focusing plane is tilted with respect to the microscope’s focal plane in order to obtain cell images at multiple focal positions. As the
    cells are displaced at constant speed, phase maps can be generated without the need to segment and register individual objects. The pro-
    posed inclined geometry allows for the acquisition of a vertical stack without the need for any moving part, and it enables a cost-effective
    and robust implementation of QPM. The suitability of the solution for biological imaging is tested on blood samples, demonstrating the
    ability to recover the phase map of single red blood cells flowing through the microchip.

    Published under license by AIP Publishing. https://doi.org/10.1063/5.0036585

    I. INTRODUCTION                                                            interference), computational simplicity, operation with partially
                                                                               coherent illumination sources, and the lack of constraints on
          Quantitative Phase Microscopy (QPM) is a computational
                                                                               hardware.
    approach that utilizes bright field optics to generate cell phase
    maps.1,2 Each pixel of a phase map brings information on the                     QPM is a powerful label-free technique offering high sensitiv-
    optical thickness of the sample, a convolution between the actual          ity, long term non-invasive imaging, and robust morphometric
    thickness and the refractive index (RI). For an homogeneous mate-          quantification of living cells.2,5 For example, QPM has been effec-
    rial of known RI, the QPM technique provides a direct measure of           tively used to measure the RI and the osmotic-induced volume
    the volume. QPM has demonstrated to be effective in many appli-            changes in erythrocytes,3 providing a precise morphometric
    cations, and it offers significant advantages over traditional micros-     description of cells. The same approach on white blood cells
    copy when imaging transparent phase objects, such as live cells in         allowed for the identification of robust biomarkers suitable for dis-
    culture medium.3                                                           criminating between healthy and diseased states.6 Moreover, for
          Two main families of QPM implementation exist, either based          nonhomogeneous materials, such as living cells, QPM can be seen
    on interferometry [as in Digital Holography (DH)4] or associated           as a contrast enhancement technique to highlight organelles and
    with the numerical processing of a stack of defocused bright field         structures with different RIs. This perspective has been adopted to
    images [making use of the Transport of Intensity Equation (TIE)2].         describe intracellular motility and dynamic evolution.7,8
    The latter presents several advantages which render it simpler and         Furthermore, QPM has been used to detect cell parasites such as
    less expensive than DH-based QPM:4 less stringent mechanical               Plasmodium falciparum inside Red Blood Cells (RBCs).9,10
    stability and requirements on path length (since it avoids                 Traditional bright field and phase contrast microscopy, including

Biomicrofluidics 15, 014102 (2021); doi: 10.1063/5.0036585                                                                                              15, 014102-1
Published under license by AIP Publishing.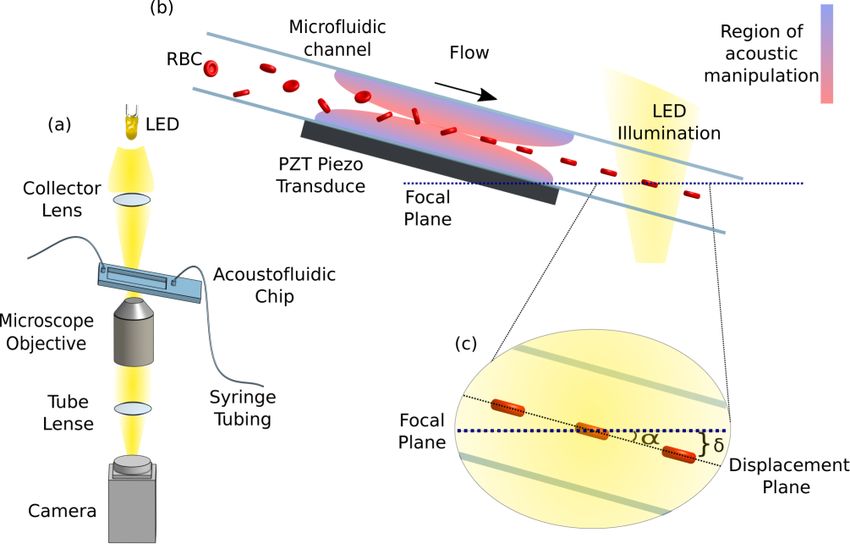
Biomicrofluidics                                                                                                ARTICLE            scitation.org/journal/bmf

    Differential Interference Contrast (DIC) microscopy, is less suitable                     to a region of a similar amount of defocusing. Individual stripes are
    for identifying complex structures such as the mitochondrial net-                         assembled into stacks for processing. Minimal registration is
    works inside the cell due to the low absorption and scattering con-                       needed, as the imaging rate is matched to the flow rate such that
    trast of the biological samples.2 On the other hand, QPM enables                          objects appear in the same position in each stripe.
    such structure visualization, together with their dynamics, with                                In a normal microfluidic channel, the parabolic flow profile
    high contrast.11,12                                                                       would cause flowing cells to move with a wide distribution of veloc-
          The main limit to the applicability of TIE-based QPM is the                         ities depending on their proximity to the walls. The acoustic focus-
    need for acquiring a stack of images across the focal plane with well                     ing moves all cells to the same position in the flow profile, ensuring
    defined focal offsets. Typically, this requires the mechanical transla-                   that they all move at the same speed and maintain a fixed arrange-
    tion of either the camera or the object,13 introducing an expensive                       ment within the focused plane.18 The described configuration,
    hardware component and requiring a longer and delicate imaging                            therefore, allows for high throughput by retrieving the phase map
    procedure. This is particularly detrimental for the implementation                        of several cells at once, leading to a performance increase without
    of high throughput imaging procedures for diagnostic purposes.                            special optical elements.
    Some solutions have been proposed to achieve high throughput                                    Cell orientation is also manipulated by the acoustic field.
    TIE-based QPM, either implementing strategies for fast scanning                           Previous work19 has shown that in an acoustic planar standing
    of the focal plane using tunable lenses14 or using smart optical con-                     wave, RBCs are caused to rotate such that the disk of the cell lies
    figurations to obtain one-shot TIE imaging.15–17 However, these                           within the pressure nodal plane. In our setup, this creates a “flat”
    approaches require rather expensive optical components or sub-                            view of the cells which exposes a maximal area of each cell to the
    stantial modifications to the standard bright field microscopy                            optics, and we conjecture that this leads to optimal information
    apparatus.                                                                                from the image compared with other possible orientations.
          In this work, we propose a simple and inexpensive technique                         Additionally, by aligning cells to the center of the flow channel,
    for a fast, real-time implementation of TIE cytometry by combining                        where the shear stress gradients are at a minimum and symmetri-
    a microfluidic channel, in a tilted configuration, with cell acoustic                     cal, the cells are not induced to “tumble” as would be found in
    focusing. A transmission microscope is used to acquire images of                          other arrangements.20 This is important as the method described
    the cells, levitated by the acoustic field, and translated by the fluid                   here relies on a lack of rotation between exposures.
    flow through the optical system’s focal plane, where the latter                                 Our configuration, thus, enables the realization of an inexpen-
    forms a controlled angle with the acoustic field’s focal plane located                    sive device usable for cytometry-based diagnosis, a highly desirable
    inside the microfluidic channel [cf. Fig. 1(b)]. Images are divided                       goal (particularly) in low-income countries, where access and
    along the flow direction into stripes so that each stripe corresponds                     quality of health care must be coupled to low costs.

                                                                                              II. MATERIALS AND METHODS
                                                                                              A. Chip production
                                                                                                    The microfluidic chip used in this work is based on a previ-
                                                                                              ously proposed geometry.18,21 In short, three layers of double sided
                                                                                              adhesive transfer tape sheet (468MP, 3M, USA) were joined to
                                                                                              produce a bond film 320 μm thick. Using a laser cutter, the joined
                                                                                              bond film was cut into 5  7:5 cm pieces with a 6 mm wide
                                                                                              channel running diagonally across. The cut pieces were sandwiched
                                                                                              between two double width microscope slides (1  50  75 mm3 ),
                                                                                              and access holes to the microchannel of 1 mm diameter were
                                                                                              drilled at both ends of the channel.
                                                                                                    Underneath a portion of the fluid channel, a piezoelectric
                                                                                              transducer of lead zirconate titanate (PZ-26, Ferroperm,
                                                                                              Kvistgaard, Denmark) was attached with epoxy (Epotek-301,
                                                                                              Epoxy Technology, Inc., USA). The size of the transducer was
                                                                                              (1  25  50 mm3 ), and a wrap-around electrode was created on
      FIG. 1. Experimental configuration. (a) A pulsed light emitting diode (LED)             the top-surface, in contact with the glass, using conductive silver
      illuminates the inclined microfluidic channel equipped with acoustic focusing.
                                                                                              paint (SCP Silver Conductive Paint, Electrolube Ltd., UK).
      The images are collected by using a microscope and acquired with a digital
      camera. (b) A cross-sectional view of the microfluidic chip. The red blood cells              To drive the piezoelectric transducer, a TTi TG1006 signal
      (RBCs) initially travel in random orientations before entering the acoustic field       generator was used in conjunction with a custom amplifier based
      created by the transducer. The radiation forces rotate the RBCs to be parallel to       around a high frequency op-amp (linear technologies, LT1210).
      the chamber walls and align them into a plane in the device center where they           Frequency was set at 2.286 MHz with a voltage amplitude of 2 Vpp
      move with uniform velocity. (c) The device tilt, relative to the optical axis, causes   to achieve the acoustic focusing. This results in an acoustic pressure
      them to move diagonally through the focal plane defined by the microscope
      objective, thereby producing images with a controlled amount of defocusing.
                                                                                              node along the device’s half-height center plane, which creates
                                                                                              acoustic radiation forces that direct blood cells toward that plane.18

Biomicrofluidics 15, 014102 (2021); doi: 10.1063/5.0036585                                                                                                  15, 014102-2
Published under license by AIP Publishing.
Biomicrofluidics ARTICLE scitation.org/journal/bmf
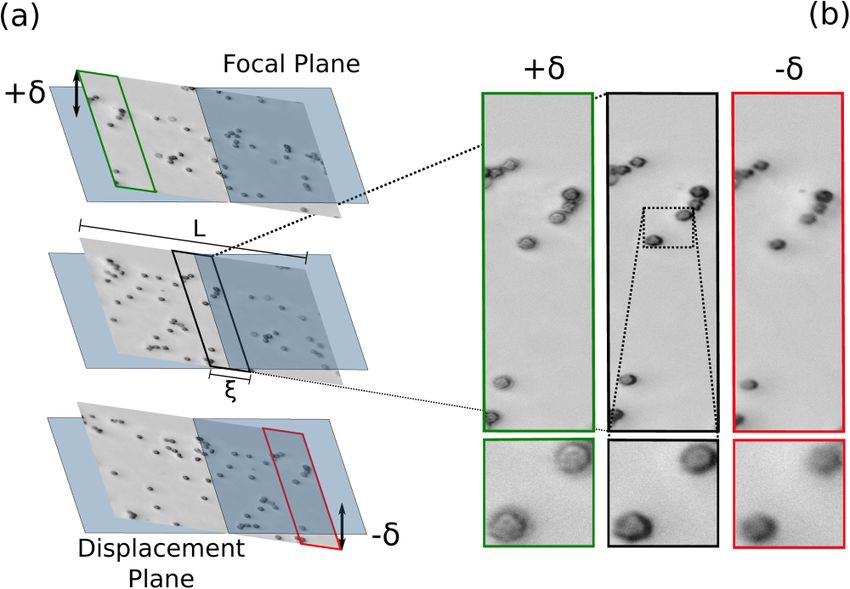
B. Microscopy setup image’s length along the direction of the flow [cf. Fig. 2(a)]. The
The microscopy setup in this work is based on an inverted floating objects are acoustically focused in the same plane so that
transillumination microscope equipped with an Olympus they all move with the same speed v. If a series of five images is
LMPLFLN 50X Objective, NA ¼ 0:5 and field of view (FoV), a acquired with a delay τ ¼ ξ=v, the same objects imaged in a stripe
m at time t will be in the stripe m þ 1 at time t þ τ but at a differ-
square of side 0.53 mm [cf. Fig. 1(a)]. The microfluidic chip is posi-
ent vertical position. Thus, if we call zm (x, y), the distance from
tioned in the standard XY stage using a custom 3D printed frame.
The tilt angle of the flow plane is controlled using glass slides as the focal plane of each point of the stripe m, we can write
spacers mounted under one end of the chip; three 1 mm thick zm (x, y) zmþ1 (x, y) ¼ δ=5, where δ is the maximum defocusing
slides were used to achieve an angle of 3.5 , thus providing a total [see Figs. 1(c) and 2(a)]. Taking this into account, a virtual inten-
sity stack ^I(x, y, z) can be constructed using the five intensity
change in the field of view of Δz 15 μm.
stripes Im2 (t 2τ) Imþ2 (t þ 2τ) containing the same field of
With normal illumination, a particle traversing the field of view
creates significant motion blur during the camera’s exposure time. To view at different heights. Little deviations might arise in the align-
avoid this effect, pulsed illumination was implemented to capture the ment of the stripes by simple translation, mainly due to optical
cell images during short pulses of light. For this purpose, the original aberrations. To correct for this deviation, the position of the stripes
was finely tuned based on a strict registration procedure.23
filament was replaced by a high intensity light emitting diode, LED
(LZ1-00G102, LED Engin, CA, USA). This was driven by a custom
driver circuit.22 The duration of the pulses of light and their synchro- E. Solution of the TIE
nization with the camera triggering were controlled by a microproces- The solution of the TIE, based on the two-dimensional Fast
sor (Arduino Uno, Arduino). Pulse length was set to 10 μs. Fourier Transform (FFT), is fast and computationally simple.4,24
First, the right hand side of Eq. (1), which represents the change of
C. Blood samples intensity along the z axis, is computed by taking the forward deriv-
ative evaluated at the in-focus plane z ¼ 0, the standard procedure
Rat’s blood was mixed with lithium heparin at 20 IU/ml. The
in the QPM TIE-based approach.12,25,26 Then, a two dimensional
blood was centrifuged at 2000 rpm for 5 min and the plasma and
FFT is applied, to the obtained derivative, to retrieve the phase gra-
buffy coat removed by using Pasteur pipet. 50 μl of the centrifuged
dient ∇? f(x, y). A periodic boundary condition was applied to the
blood was diluted with 5 ml of a hypotonic solution of PBS buffer
stack when calculating the 2D FFT, which was useful to convert the
(Sigma Aldrich #P4417) obtaining a cell count of 3 103 cells/μl,
rectangular symmetry of the stack to a squared one. Indeed, a
equivalent to dilute 3400 folds the mice blood’s original samples. The
diluted blood samples provided a suitable cell density for imaging, in
our case 40–70 cells in each field of view (FOV). Experiments were
conducted at room temperature (around 20 C) and carried out
within 48 h of blood collection.
A syringe pump (Harvard Apparatus Pump Elite 11) and a
10 ml glass syringe were used to pump the samples through the
device at 200 μl/min. Our previous work18 had shown that the pulsed
illumination used here with 10 μs exposure time resulted in insignifi-
cant motion blur at the flow rates we demonstrate. The optical results
presented here are, thus, not significantly dependent on flow rates,
and with the RBCs near the center of the channel, we do not antici-
pate any significant shear stress induced changes in the RBCs.
D. Image acquisition and processing
Images were acquired using a Hamamatsu Flash 4.0 C11440
monochrome camera set at 90 fps and 12 bits depth. All parameters
were manually controlled, and any auto-balance feature was
switched off. To eliminate artifacts due to partially uneven illumi-
nation and fixed objects in the field of view (dust and debris), an FIG. 2. Schematics of the experimental setup. (a) Acoustic focusing forces
image of the static background IBG was extracted from the median floating particles to flow along a plane (in gray) that is tilted with respect to the
focal plane (in cyan). Samples in different regions of the image will be at differ-
over time of the first ten images. The adoption of the median
ent distances from the focal plane. If z is the coordinate along the optical axis,
(instead of the average) ensures that image features associated with objects in the central stripe (black frame) will correspond to z ¼ 0, while objects
particles passing through the frame are not given significant weight in the first and last stripe (green and red, respectively) will sit at a higher dis-
in the average (image averaging leads to particle’s trails). The back- tance from the focal plane, z ¼ +δ for them. The image of length L was
ground image IBG was then subtracted from every acquired image divided in five stripes of identical width ξ. (b) Images from each strip, taken
ICCD and the difference I ¼ ICCD IBG used to recover the phase. sequentially, to show the distribution of particles acquired at each vertical posi-
tion, as defined by the stripes. The time series is converted into a series of ver-
Each image I(t) was divided into five stripes Im (t), tical stacks by aligning the requisite stripes from images.
m ¼ 2, 1 2, of identical width ξ ¼ L=5, where L is the
Biomicrofluidics 15, 014102 (2021); doi: 10.1063/5.0036585 15, 014102-3
Published under license by AIP Publishing.Biomicrofluidics ARTICLE scitation.org/journal/bmf
square symmetry is more favorable for 2D FFT calculations and is representation. The effectiveness of the method is highlighted in
less prompt to artifacts of high frequencies. In addition, the 10th Fig. 3(b), where two phase profiles are shown, one obtained on a
percentile of the frequencies with larger amplitude jf (u, ν)j was clump of cells (blue dotted profile) and the second on an isolated
removed to eliminate the periodic noise, regardless of its high- or RBC (red dotted profile). This picture demonstrates the quantitative
low-frequency nature. Finally, a second 2D FFT was applied to information carried by the TIE reconstruction. Aggregated cells
obtain the desired phase map f(x, y).14 The computational TIE (blue) are, in fact, higher than the single RBC (about twice as
solution was based on the Numpy Pyhton library.27 much) and present a rounded shape. In contrast, the red profile
clearly highlights the expected donut-like shape of the isolated
III. RESULTS RBC, which is acoustically trapped in a planar configuration.
The acquired ^I(x, y, z) stack can be exploited to calculate the
optical thickness of the sample (phase reconstruction) using the IV. DISCUSSION AND CONCLUSION
TIE,25 A simple chip geometry was utilized, with a rectangular cross
section where the width was much larger than the thickness. In this
@I(x, y, z)
∇? ½I0 (x, y)∇? f(x, y) ¼ k , (1) configuration, the flow was laminar with a parabolic velocity profile
@z z¼0 (objects close to the center of the chip flow faster than objects near
the walls). This geometry was previously adopted to perform image
where k is the wavenumber, ∇? is the in-plane gradient, I0 (x, y) cytometry on single algae, demonstrating a strong focusing effi-
¼ ^I(x, y, 0) is the image in the focal plane, f(x, y) is the phase (to be ciency, also resulting in a narrow velocity distribution of the float-
reconstructed), and @z indicates the derivative along the optical axis ing objects.28
evaluated at z ¼ 0. Under the assumption of a homogeneous and par- The adoption of a tilted configuration to obtain motion-free
tially coherent illumination, this equation can be numerically solved vertical stacks of floating objects has been previously suggested as a
to finally obtain a quasi-3D real-time reconstruction of the object. low-cost method to perform TIE-based QPM reconstruction.25,29,30
The numerical solution of the TIE has been described in Sec. II E. Here, we propose a substantial improvement, provided by the inte-
The proposed approach has been adopted here to study a gration of the acoustic focusing mechanism. Two main advantages
sample of murine blood. Figure 3(a) shows reference images of are associated with this configuration. First, all objects flow through
RBCs acquired with this method. For each sample, the in-focus the field of view in the same plane so that an efficient stacking with
bright field stripe (first column, m ¼ 0) and the phase reconstruc- controlled distances between planes is achieved for all objects, not
tion (third column) are reported, together with the phase gradient only for those that were by chance in the correct region. The ability
(central column). The phase gradient ∇? f(x, y) is calculated to finely control the distance between planes is crucial for the
from the last column and offers a high contrast qualitative quality of the reconstruction, which is based on the calculation of the
derivative. Moreover, focusing objects to a single plane means that
they all move with the same velocity, and the motion can be effi-
ciently approximated as a rigid translation. The majority of RBCs
were observed to have rotated in the acoustic manipulation region to
orient themselves within the pressure nodal plane and present a
“flat” view.19 Furthermore, due to the absence of significant shear
stresses at the channel half-height, no significant cell rotation was
observed between the successive exposures required to build up the
QPM image. To reconstruct the virtual stack in this condition, we
are not required to isolate and track the motion of individual cells,
resulting in a more rapid and efficient image processing that can
incorporate aggregates and objects of unexpected size.
The proposed device offers a low-cost approach to obtain physi-
cal maps associated with the refractive index and thickness of the
sample that can be further manipulated and exploited for different
aspects depending on the needs of the specific application. QPM
maps can be rendered as 3D-like images of the sample, in which
single objects can be effectively segmented using simple and fast
threshold-based algorithms, thus enabling effective extraction of real-
time morphological features (see image 3 and Ref. 31). Moreover, the
same setup is suitable for addressing high throughput recognition of
infected cells, where the presence of an intracellular parasite is
FIG. 3. (a) The left column shows the stripe of the brightfield image of the known to directly impact the phase map, as in the case of malaria
RBCs in the focal plane; the center column shows the gradient of the phase infections.32 While QPM is primarily considered an imaging techni-
rf(x, y) and the right column shows the phase of the images f(x, y). (b)
Phase profile for a single RBC and for a clustered group of RBCs.
que, it measures a physical quantity that relates to the refractive
index, and this offers the possibility of using the system as a
Biomicrofluidics 15, 014102 (2021); doi: 10.1063/5.0036585 15, 014102-4
Published under license by AIP Publishing.Biomicrofluidics ARTICLE scitation.org/journal/bmf
9
spectroscopic device for the identification of the sample’s material J. Jung, L. E. Matemba, K. Lee, P. E. Kazyoba, J. Yoon, J. J. Massaga, K. Kim,
properties, as recently proposed for the recognition of microplastics in D.-J. Kim, Y. Park, and Y. Park, “Characterizations of erythrocytes from individ-
sea water.33 The method is based on the acquisition of image stripes uals with sickle cell diseases and Malaria infection in Tanzania using a portable
quantitative phase imaging unit,” in International Conference on Photonics and
that can accommodate more than one cell at the time (10 cells at
Imaging in Biology and Medicine (Optical Society of America, 2017),
the same time were mapped during experiments), thus increasing p. W3A.115.
the overall potential throughput (in terms of cells/s). 10
M. T. Rinehart, H. S. Park, K. A. Walzer, J.-T. A. Chi, and A. Wax, Sci. Rep. 6,
In conclusion, the segmentation-free TIE-based setup pro- 1–9 (2016).
posed in this paper demonstrates a robust high throughput 11
Y. Ma, S. Guo, Y. Pan, R. Fan, Z. J. Smith, S. Lane, and K. Chu,
low-cost single cell in-chip QPM. The simple implementation J. Biophotonics 12, e201900011 (2019).
offers a nonexpensive solution, suitable for environments where the 12
S. S. Kou, L. Waller, G. Barbastathis, and C. J. R. Sheppard, Opt. Lett. 35,
cost is a core requirement, but where throughput and accuracy are 447–449 (2010).
13
mandatory. Examples include the identification of rare infected P. K. Poola, V. Jayaraman, K. Chaithanya, D. Rao, and R. John, OSA Contin.
cells in tropical diseases,34 screening applications in veterinary or 1, 1215 (2018).
14
C. Zuo, Q. Chen, W. Qu, and A. Asundi, Opt. Express 21, 24060–24075
food science,35,36 or the identification of specific micrometric
(2013).
targets in environmental samples.28,33 15
K. Lee and Y. Park, Opt. Lett. 39, 3630 (2014).
16
L. Waller, S. S. Kou, C. J. R. Sheppard, and G. Barbastathis, Opt. Express 18,
AUTHORS’ CONTRIBUTIONS 22817 (2010).
17
W. Yu, X. Tian, X. He, X. Song, L. Xue, C. Liu, and S. Wang, Appl. Phys. Lett.
J.M.M. and B.H. contributed equally to this manuscript. 109, 071112 (2016).
18
R. Zmijan, U. S. Jonnalagadda, D. Carugo, Y. Kochi, E. Lemm, G. Packham,
SUPPLEMENTARY MATERIAL M. Hill, and P. Glynne-Jones, RSC Adv. 5, 83206 (2015).
19
O. Jakobsson, M. Antfolk, and T. Laurell, Anal. Chem. 86, 6111 (2014),
Supplemental material provides a detailed description for the pMID: 24863098.
reconstruction of virtual stacks for transport of intensity equation 20
F. Merola, P. Memmolo, L. Miccio, R. Savoia, M. Mugnano, A. Fontana,
QPM implementation. G. d’Ippolito, A. Sardo, A. Iolascon, A. Gambale, and P. Ferraro, Light Sci. Appl.
6, e16241 (2016).
ACKNOWLEDGMENTS
21
P. Glynne-Jones, R. J. Boltryk, and M. Hill, Lab Chip 12, 1417 (2012).
22
C. Willert, B. Stasicki, J. Klinner, and S. Moessner, Meas. Sci. Technol. 21,
The authors would like to thank Dr. Stéphane Barland (UCA 075402 (2010).
23
Nice) and Dr. Marco Sartore (ElbaTech SRL) for fruitful discus- S. van der Walt, J. L. Schönberger, J. Nunez-Iglesias, F. Boulogne,
sions. J.M.M. acknowledges the funding for international mobility J. D. Warner, N. Yager, E. Gouillart, and T. Yu, and the scikit-image contribu-
France–Italy provided by the Université Franco Italienne (UFI, tors, PeerJ 2, e453 (2014).
Project No. C2-1031) and the Mexican Council of Science and
24
T. Sun, Z. Zhuo, W. Zhang, J. Lu, and P. Lu, Laser Phys. 28, 125601 (2018).
Technology (CONACyT) scholarship (No. 471712). P.G.J. gratefully
25
S. S. Gorthi and E. Schonbrun, Opt. Lett. 37, 707 (2012).
26
E. Bostan, E. Froustey, M. Nilchian, D. Sage, and M. Unser, “Variational phase
acknowledges fellowship funding by the UK EPSRC (No. EP/
imaging using the transport-of-intensity equation,” IEEE Trans. Image Process.
L025035/1). This work has also been supported by the French gov- 25(2), 807–817 (2016).
ernment through the UCAJEDI Investments in the Future project 27
C. R. Harris, K. J. Millman, S. J. van der Walt, R. Gommers, P. Virtanen,
managed by the National Research Agency (ANR) with Reference D. Cournapeau, E. Wieser, J. Taylor, S. Berg, N. J. Smith, R. Kern, M. Picus,
No. ANR-15-IDEX-01. S. Hoyer, M. H. van Kerkwijk, M. Brett, A. Haldane, J. F. del Río, M. Wiebe,
P. Peterson, P. Gérard-Marchant, K. Sheppard, T. Reddy, W. Weckesser,
DATA AVAILABILITY H. Abbasi, C. Gohlke, and T. E. Oliphant, Nature 585, 357 (2020).
28
B. Hammarström, M. Vassalli, and P. Glynne-Jones, J. Appl. Phycol. 32, 339
The data that support the findings of this study are available (2019).
from the corresponding author upon reasonable request. 29
N. C. Pégard and J. W. Fleischer, J. Biomed. Opt. 18, 040503 (2013).
30
V. K. Jagannadh, M. D. Mackenzie, P. Pal, A. K. Kar, and S. S. Gorthi, Opt.
Express 24, 22144 (2016).
REFERENCES 31
N. O. Loewke, S. Pai, C. Cordeiro, D. Black, B. L. King, C. H. Contag, B. Chen,
1
A. Barty, K. A. Nugent, D. Paganin, and A. Roberts, Opt. Lett. 23, 817 (1998). T. M. Baer, and O. Solgaard, IEEE. Trans. Med. Imaging 37, 929 (2018).
2
Y. Park, C. Depeursinge, and G. Popescu, Nat. Photonics 12, 578 (2018). 32
N. R. Patel, V. K. Chhaniwal, B. Javidi, and A. Anand, Advanced Microscopy
3
C. L. Curl, C. J. Bellair, P. J. Harris, B. E. Allman, A. Roberts, K. A. Nugent, Techniques IV; and Neurophotonics II (OSA, 2015).
and L. M. D. Delbridge, Cell. Physiol. Biochem. 17, 193–200 (2006). 33
V. Bianco, P. Memmolo, P. Carcagnì, F. Merola, M. Paturzo, C. Distante, and
4
W.-J. Zhou, X. Guan, F. Liu, Y. Yu, H. Zhang, T.-C. Poon, and P. P. Banerjee, P. Ferraro, Adv. Intel. Syst. 2, 1900153 (2020).
Appl. Opt. 57, A229–A234 (2018). 34
T. Go, J. H. Kim, H. Byeon, and S. J. Lee, J. Biophotonics 11, e201800101
5
S. Zhang, J. Cheng, and Y.-X. Qin, PLoS ONE 7, e38343 (2012). (2018).
6 35
I. Vasilenko, V. Metelin, M. Nasyrov, V. Belyakov, A. Kuznetsov, and F. A. M. Ramírez, E. M. Rodriguez, C. A. O. Castelblanco, and M. Camacho,
E. Sukhenko, Quant. Phase Imaging 9336, 2078661 (2015). in Optical Methods for Inspection, Characterization, and Imaging of Biomaterials
7
C. Martinez Torres, B. Laperrousaz, L. Berguiga, E. Boyer Provera, J. Elezgaray, III, edited by P. Ferraro, M. Ritsch-Marte, S. Grilli, and C. K. Hitzenberger
F. E. Nicolini, V. Maguer-Satta, A. Arneodo, and F. Argoul, Quant. Phase (SPIE, 2017).
Imaging II 9718, 97182C (2016). 36
B. Rappaz, B. Breton, E. Shaffer, and G. Turcatti, Comb. Chem. High
8
T. Yamauchi, H. Iwai, and Y. Yamashita, Opt. Express 19, 5536 (2011). Throughput Screen. 17, 80 (2014).
Biomicrofluidics 15, 014102 (2021); doi: 10.1063/5.0036585 15, 014102-5
Published under license by AIP Publishing.You can also read