Assessment of land sensitivity to degradation using MEDALUS model - a case study of Grdelica Gorge and Vranjska Valley (southeastern Serbia) ...
←
→
Page content transcription
If your browser does not render page correctly, please read the page content below
iForest                                                                                                     Research Article
                                                                                                          doi: 10.3832/ifor3871-015
                                                                                                                vol. 15, pp. 163-170
          Biogeosciences and Forestry

Assessment of land sensitivity to degradation using MEDALUS model - a
case study of Grdelica Gorge and Vranjska Valley (southeastern Serbia)

Sara Lukić (1),                                   Land degradation is a complex issue caused by diverse drivers, each of which
                                                  should be considered in the analysis of land sensitivity to degradation. This
Aleksandar Baumgertel (1),                        study identifies the areas most sensitive to land degradation in the Grdelica
Snežana Obradović (2),                            Gorge and Vranjska Valley, which are unique in terms of natural and socioeco -
Ratko Kadović (1),                                nomic conditions. Land-use changes and inappropriate land management have
Jelena Beloica (1),                               led to serious degradation in this region. The flexible and multifactorial ap-
                                                  proach of the Mediterranean Desertification and Land Use (MEDALUS) model
Damjan Pantić (2),                                allowed comprehensive land degradation sensitivity analysis in the study area.
Predrag Miljković (1),                            The main factors driving soil degradation were assessed by estimating climate
Snežana Belanović Simić (1)                       quality index, soil quality index, and vegetation quality index, and the main
                                                  socioeconomic indicators by management quality index and social quality in-
                                                  dex. The results showed that forest cover is the main factor to contrast land
                                                  degradation, and even minor adverse changes in forest characteristics, such as
                                                  structure, canopy cover, health, and quality, could trigger degradation pro-
                                                  cesses. The vegetation quality index was defined in terms of the current vege-
                                                  tation’s capacity to protect soil from erosion, drought resistance, and fire risk.
                                                  Detailed data on forest vegetation cover was obtained from the National For-
                                                  est Inventory (NFI). The environmentally sensitive area (ESA) index generated
                                                  through the analysis classified 26.11% of the total study area as critical,
                                                  69.53% as fragile, and 2.70% as either prone to or unaffected by degradation
                                                  processes. According to the ESA index, the areas covered by forests with opti-
                                                  mal species composition and high canopy cover were the least susceptible to
                                                  degradation. The areas under intensive agricultural production without any ap-
                                                  plication of conservation measures were the most susceptible to degradation.
                                                  Future strategies for optimal land-use patterns are discussed, such as the in-
                                                  tergration of woody species in croplands to protect soil against degradation
                                                  and meet human needs in the areas prone to degradation.

                                                  Keywords: Land Degradation, Sensitivity, MEDALUS, Vegetation Cover, Spatial
                                                  Analysis

Introduction                                      cation (UNCCD 1994). Together with natu-         The transition from forest to other land
  Land degradation and desertification are        ral causes of the land’s sensitivity to degra-   uses, such as cropland or settlements, is in-
serious problems causing numerous ad-             dation and desertification, which are            evitably associated with deforestation, one
verse global and local effects. They impact       strongly related to climatic features, soil      of the common drivers of degradation, and
all spheres of the environment, leading to        properties, and vegetation types, human          is a great threat to ecological health in a
irrecoverable ecological losses and affect-       activities are usually the direct drivers of     wide range of environmental and socioeco-
ing human well-being (Santini et al. 2010).       degradation and desertification processes        nomic situations (Gharibreza et al. 2020). It
Degradation processes that occur in arid,         (Salvati & Zitti 2008). Changes in land use      generally results in ecological problems, in-
semi-arid, and dry sub-humid areas where          resulting from human activity represent          cluding habitat loss, extinction of species
the productivity of the soil depends on wa-       the common driving force of degradation          and communities, increased CO2 emissions,
ter availability, are referred to as desertifi-   and desertification processes nowadays.          and many others. Human actions can also
                                                                                                   improve the environment through sustain-
    (1) Department of Ecological Engineering for Soil and Water Resources Protection, Univer-      able land management practices and effec-
sity of Belgrade, Faculty of Forestry (Serbia); (2) Department of Forestry, University of Bel-     tive policies (Huang et al. 2020).
grade, Faculty of Forestry (Serbia)                                                                  A thorough understanding of the land’s
                                                                                                   sensitivity to degradation and desertifica-
@ Sara Lukić (sara.lukic@sfb.bg.ac.rs)                                                             tion is crucial when considering both im-
                                                                                                   provement options and the risk of addi-
Received: May 12, 2021 - Accepted: Feb 21, 2022                                                    tional degradation (Olsson et al. 2019). Esti-
                                                                                                   mating land sensitivity to degradation and
Citation: Lukić S, Baumgertel A, Obradović S, Kadović R, Beloica J, Pantić D, Miljković P,         desertification requires an integrated ap-
Belanović Simić S (2022). Assessment of land sensitivity to degradation using MEDALUS model        proach and detailed analyses of the inter-
- a case study of Grdelica Gorge and Vranjska Valley (southeastern Serbia). iForest 15: 163-       play of natural and human factors and their
170. – doi: 10.3832/ifor3871-015 [online 2022-05-07]                                               role in driving land degradation (Mirzabaev
                                                                                                   et al. 2015). Accurate estimation is needed
Communicated by: Agostino Ferrara                                                                  to prevent land degradation and support
                                                                                                   the planning and improvement of land

© SISEF https://iforest.sisef.org/                                     163                                                 iForest 15: 163-170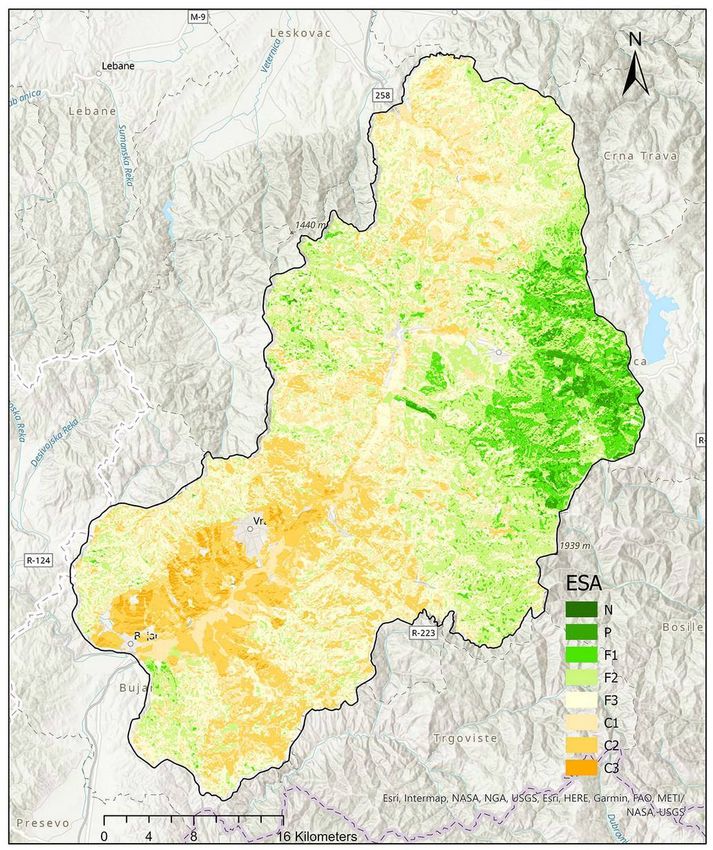
Lukić S et al. - iForest 15: 163-170
management at any level (Salvati et al. ponent from management quality index The area is characterized by an erodible
iForest – Biogeosciences and Forestry
2012). and its implementation in MEDALUS algo- parent rock with very disturbed and bro-
Among the available models for assess- rithm as separate layer (social quality in- ken layers weathered to different degrees.
ment of land degradation, the Mediter- dex), it could be possible to assess the The most common soil types in the study
ranean Desertification and Land Use model quality of human interactions with the en- area are leptosols, cambisols, vertisols, lu-
(MEDALUS) is widely used due to its flexi- vironment to some extent. The parameters visols, and fluvisols (Lukić 2013). The associ-
bility in the selection of the main indices of of the ESA indicators, defined in detail be- ation of Hungarian oak and Turkey oak
land degradation, its relatively simple appli- low, enabled a thorough investigation of (Quercetum frainetto-cerris Rud. 1949) is
cation, and its rapid implementation (Kos- the spatial patterns of sensitivity to land the most common forest type at altitudes
mas et al. 1999, Salvati et al. 2015, Prăvălie degradation. Areas with high ESA values up to 600 m a.s.l. in the area of Grdelica
et al. 2020). The assessment of the environ- have been identified as ideal locations for Gorge and Vranjska Valley. Montane beech
mentally sensitive areas (ESAs) identified land management interventions, especially forests (Fagetum moesiacae montanum
by the MEDALUS method was a broader to improve the vegetation cover quality Jov. 1953) are present from 800 to 1300 m
approach guided by several complex and and to protect valuable communities in the asl. In the valley of the South Morava River,
interrelated factors linked to specific local study area. Rapid and comprehensive iden- the most common communities are forests
environmental and human-induced condi- tification of the drivers of degradation and of broom and pedunculate oak (Genisto
tions (Mirzabaev et al. 2015, Olsson et al. alteration of human activities through im- elatae-Quercetum roboris Horv. 1938 s. lat.)
2019). The spatial distribution of areas with proved land management and policies en- and forests of willow and poplar (Salici-
high ESA index values reflects the com- ables control of degradation processes to Populetum albae Drees. 1936 – Tomić
bined impact of environmental conditions reduce or prevent adverse effects on hu- 2004). The area is also characterized by the
and factors such as demographic trends, man well-being and serious disruptions in presence of rare and scattered species and
the effects of land management, and the the environment. communities and the presence of relict and
quality of environmental policy (Ferrara et The aim of this study is to: (i) estimate endemic forest communities (Mišić 1981).
al. 2020). sensitivity to land degradation in an area The area of Grdelica Gorge and Vranjska
The MEDALUS model was originally de- subject to interplay among numerous natu- Valley is socioeconomically underdevel-
veloped for the Mediterranean region but ral and human factors using the MEDALUS oped and demographically depopulated.
has been successfully applied worldwide model; (ii) underline the potentials and
(Ferrara et al. 2020), in Europe (Contador value of data provided in Forest Manage- Methodology
et al. 2009, Salvati et al. 2015, Prăvălie et al. ment plans (special or general plans) and The land degradation sensitivity analysis
2020), Asia (Dindaroğlu 2015), Africa (Bakr National Forest Inventory (NFI) data in en- to identify ESAs was conducted according
et al. 2012, De Pina Tavares et al. 2015), and vironmental modeling; and (iii) identify the to the modified MEDALUS model described
South America (Vieira et al. 2015). In Serbia, areas critically endangered by degradation by Kosmas et al. (1999). This model en-
the MEDALUS model has been applied in using Local Moran’s I analysis. abled analyzing both the dominant envi-
certain specific locations (Momirović et al. ronmental and human-induced degrada-
2019, Perović et al. 2021). Materials and methods tion factors that characterize the study
This study aims at assessing the sensitiv- area. The analysis was based on five indica-
ity to land degradation of an area subject Study area tors of quality related to the driving forces
to interplay among numerous natural and The area of Grdelica Gorge and Vranjska of land degradation in the area of Grdelica
human factors. In Grdelica Gorge and Vran- Valley (42° 22′ to 42° 55′ N; 19° 21′ to 20° 00′ Gorge and Vranjska Valley: climate quality
jska Valley areas, the component of demo- E) covers 1716.94 km2 (Fig. 1). This area has index (CQI), soil quality index (SQI), vege-
graphic pressure significantly affects land a hydrographic network consisting of 137 tation quality index (VQI), management
use patterns (Djorović 2005), as well as the torrential flows, with a total catchment quality index (MQI), and social quality in-
quality of land management. In this study, area of 1700.33 km2. Pronounced altitudinal dex (SoQI).
management and social quality indices differences over short distances, dissected The proposed ESA Index was evaluated
were analyzed separately in MEDALUS al- relief, and steep slopes contribute to an in- by the five quality indicators, as in eqn. 1:
gorithm as proposed by De Pina Tavares et creased potential for degradation pro-
al. (2015) and Vieira et al. (2015), because in cesses, particularly erosion. The continen- ESA =(CQI⋅SQI⋅VQI⋅MQI⋅SoQI )1/ 5 (1)
addition to natural characteristics, analysis tal climate of the study area is tempered by
of population dynamics enables to better the influence of the Mediterranean climate The quality indicators were defined by pa-
understand the degradation process and (Perović et al. 2019). The average annual air rameters relevant to the study area’s sensi-
directions of management actions to con- temperature is 10.9 °C, and the average an- tivity to land degradation processes. The
trol degradation (De Pina Tavares et al. nual precipitation is 672 mm, based on ob- range of parameter values was weighted
2015). By extraction of demographic com- servations from 1949 to 2017 (RHSS 2018). according to the sensitivity to degradation
and standardized from 1 (low sensitivity) to
2 (high sensitivity). For more accurate
weighting of selected parameters, remote
sensing data were combined with data
from available databases. The analysis ex-
cluded the areas under settlements and
bodies of water, which encompass 28.46
km2 and represent 1.66% of the total area of
the Grdelica Gorge and Vranjska Valley,
hereafter referred to as mask areas. The
analyses of CQI, SQI, VQI, MQI, SoQI, and
overall ESA were performed in ArcMap®
ver. 10.5.1 (ESRI, Redlands, CA, USA).
Climate quality index
The Climate Quality Index (CQI) was rep-
resented by four parameters that reflect
Fig. 1 - Study area of Grdelica Gorge and Vranjska Valley (Southeastern Serbia). the impact of climate on degradation pro-
164 iForest 15: 163-170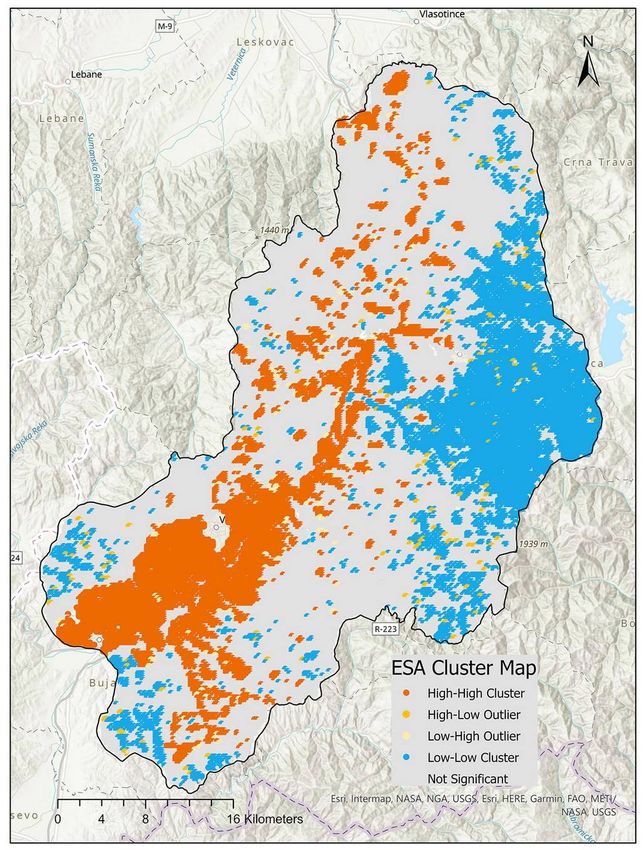
Land degradation drivers and assessment of land sensitivity to degradation

cesses: aridity index (AI), modified Four-        CORINE Land Cover data (CGLS 2012) and           terial for the original data).

                                                                                                                                                    iForest – Biogeosciences and Forestry
nier’s index (MFI), exposure (E), and rainfall    National Forest Inventory data (NFI 2009).         The VQI was calculated according to eqn.
(R). The parameters of CQI were obtained          General data on land cover were obtained         6:
according to the data for period from 1983        from CORINE and adjusted according to                                      1/ 4
to 2016 (RHSS 2018).                              more specific data on forest type (decidu-         VQI=(PC⋅EP⋅DR⋅FR )                      (6)
  The AI was calculated according to eqn. 2:      ous, coniferous, or mixed) and stand con-
                                                  servation (conserved, thinned, or devas-
   AI = P                                 (2)     tated stand) obtained from NFI.                  Management quality index
         PET
                                                    Stand conservation describes the degree          Management quality reflects the human
where P represents the precipitation, and         of canopy stocking, the proportion of prin-      contribution to land degradation in the en-
PET the potential evapotranspiration, ob-         cipal and minor tree species, and the            vironment. It was analyzed by assessing
tained according to the Penman-Monteith           health, risks, and quality of the stand in the   the impact of land-use patterns on the en-
method. The MFI was calculated according          inventory unit.                                  vironment, represented as land-use inten-
to eqn. 3:                                          A conserved stand is characterized by a        sity (LUI) and policy enforcement (PE),
        12
           pi2                                    dense to complete canopy (1.0-0.6), good         which characterizes the extent of imple-
  F =∑                                 (3)        tree health, good-quality trees, and a favor-    mentation of existing environmental regu-
      i =1 p                                      able ratio of principal and minor tree           lations. The LUI map was obtained by
where pi is the rainfall in each month, and       species. A thinned stand is characterized        grouping CORINE Land Cover data into
p the annual rainfall, to estimate rainfall ag-   by an incomplete canopy (0.4-0.6), good          three categories according to Prăvălie et al.
gressiveness (Szilagyi et al. 2016).              tree health, and good-quality trees, but a       (2017). Policy enforcement was obtained
  The environmental conditions relevant           less favorable ratio of principal and minor      by integrating CORINE data with data on
for vegetation growth are represented by          tree species. A degraded stand is charac-        the forest primary function derived from
E, which describes solar radiation and tem-       terized either by a broken canopy (below         the NFI. The primary function is either de-
perature conditions, and by R, the amount         0.4), by poor tree health and poor-quality       termined in advance as a legal requirement
of rainfall. Classes and assigned indices for     trees or by a completely unfavorable ratio       or determined subsequently based on spe-
calculating the CQI are presented in Tab. S1      of principal and minor tree species (favor-      cific criteria such as slope steepness, close-
(Supplementary material). The CQI was cal-        ing minor species over the principal spe-        ness of water source, road network, or in-
culated according to eqn. 4:                      cies).                                           dustrial area, population density etc.
                                                    Weighting indices for stands’ capacity to      Classes and assigned indices for calculation
  CQI =( AI⋅MFI⋅E⋅R)1 /4                   (4)    protect soil from erosion are basically de-      of the MQI according to Prăvălie et al.
                                                  fined according to Salvati & Bajocco (2011)      (2017) are presented in Tab. S1 (Supple-
                                                  and Contador et al. (2009) who assigned          mentary material). The MQI was calculated
Soil quality index                                weighting indices for vegetation classes         according to eqn. 7:
  The parameters of the SQI were selected         derived from the CORINE Land Cover map.
based on moisture availability and soil re-       Erosion protection function of forest cover        MQI =(LUI⋅PE)1/ 2                        (7)
sistance to erosion processes, being these        depends mostly on canopy cover closure
the most important factors for the estab-         and species composition (Vatandaşlar et al.
lishment and survival of vegetation as a          2020), species-specific functional traits        Social quality index
permanent erosion control measure. The            (Seitz et al. 2016), species richness (Salvati     Social quality was analyzed by assessing
parameters that define these conditions           et al. 2015, Song et al. 2019), etc.             the pressure of human actions on the eco-
are: parent material (PM), weighted ac-             We used the data on forest type and            system that leads to land degradation and
cording to its susceptibility to weathering,      stand conservation obtained from NFI to          desertification. Two main parameters were
which predicts its resistance to erosion          slightly adjust the weighting indices, taking    used: population density (PD) and old age
(Schaetzl & Thompson 2015); organic mat-          into account that the stand conservation         index (OAI). PD represents the total popu-
ter (OM), the main indicator of soil quality      parameter defined through the degree of          lation per unit area and is closely related to
and stability of soil structure, which pre-       canopy stocking, tree health and quality,        the level of human pressure on natural re-
dicts both the resistance of soil to erosion      and the ratio of principal and minor tree        sources (De Pina Tavares et al. 2015). The
and water availability to vegetation (Six et      species affects the stand’s ability to pro-      OAI represents the ratio of the number of
al. 2000); soil depth (SD); and slope (S).        tect the soil from erosion. The weighting        inhabitants older than 65 years of age to
The original data used to perform this anal-      indices used to perform this analysis are        the total number of inhabitants (Kosmas et
ysis are presented in Tab. S1 (Supplemen-         given in Tab. S2 (Supplementary material).       al. 2014) and emphasizes the number of
tary material). The data on SQI parameters          DR was obtained through CORINE Land            older people in relation to the total popula-
was obtained according to the 89 soil pro-        Cover data by grouping land cover types          tion (De Pina Tavares et al. 2015). Older
files (Fig. 1). The SQI was calculated accord-    (see Tab. S1 in Supplementary material). FR      people puts more pressure on natural re-
ing to eqn. 5:                                    was obtained by combining CORINE Land            source by applying tillage techniques and
                                                  Cover and NFI data. Data on the stand unit       breeding livestock in obsolete manner
  SQI =( PM⋅OM⋅SD⋅S)1 /4                   (5)    in the NFI contain information on the mix-       which usually adversely impact the soil and
                                                  ture of tree species in the stand. The           vegetation condition. Classes and assigned
                                                  flammability of the forest depends on the        weights of indices for calculation of SoQI,
Vegetation quality index                          stand structure, the biological and ecologi-     according to De Pina Tavares et al. (2015),
  Vegetation was analyzed for its capacity        cal characteristics of each species in the       are presented in Tab. S1 (Supplementary
to protect soil from erosion, drought resis-      mixture, and their relationships (Vasić 1992,    material).
tance, and fire risk. The VQI was calculated      Fernandes 2009, Xanthopoulos et al. 2012).         The SoQI was calculated according to
by four standard parameters (Kosmas et al.        Stands in the Republic of Serbia are divided     eqn. 8:
1999): plant cover (PC), erosion protection       into six classes of flammability (Vasić 1992),
(EP), drought resistance (DR), and fire risk      from the least endangered class (VI cate-                                                  (8)
                                                                                                     SoQI =( PD⋅OAI )1/2
(FR).                                             gory, or very low flammability), which in-
  PC was obtained from the normalized dif-        cludes bare lands, to the most endangered
ference vegetation index (NDVI) common-           class (I category, or extremely high flam-       Statistical analysis
ly used to assess vegetation cover (Moha-         mability), which includes pine and larch           Spatial correlation was performed to
med 2013). EP was defined by combining            forests (see Tab. S1 in Supplementary ma-        identify collinearity among quality indices

iForest 15: 163-170                                                                                                                          165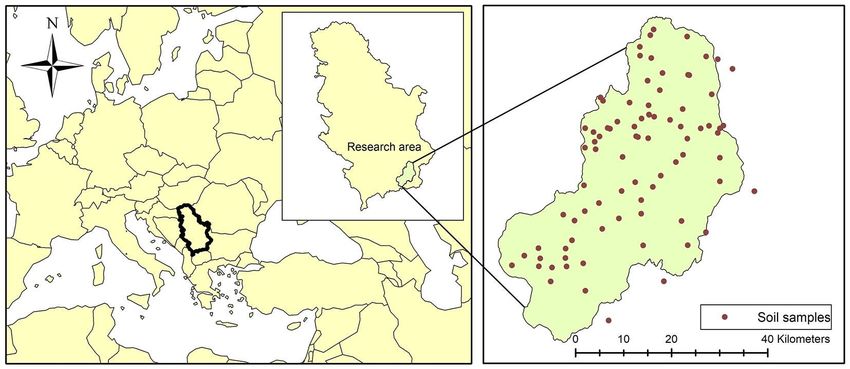
Lukić S et al. - iForest 15: 163-170
Results and discussion
iForest – Biogeosciences and Forestry
Tab. 1 - Quality indices CQI, SQI, VQI, MQI and SoQI distribution by quality classes.
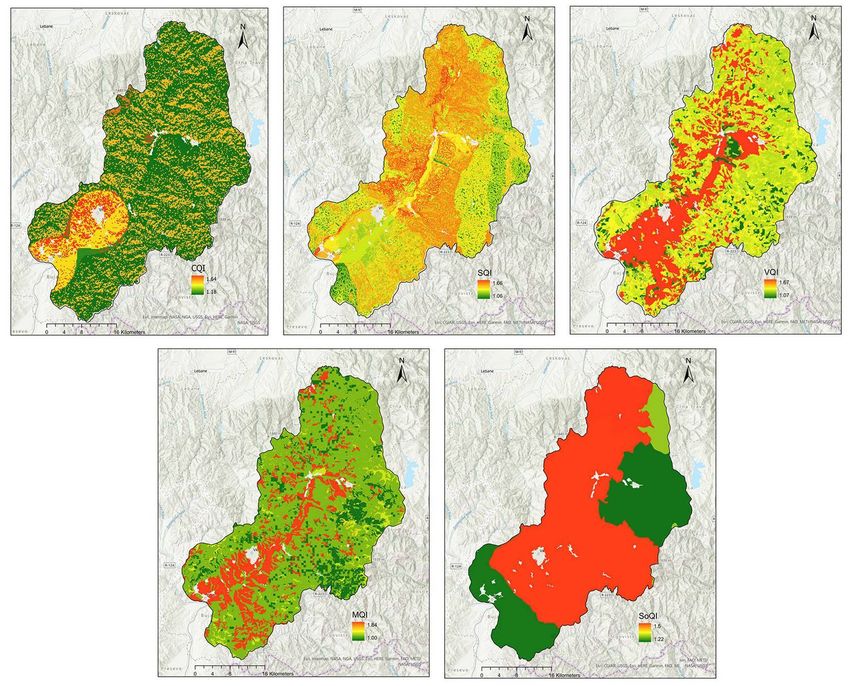
Climate quality index
Class area Class area The CQI shows that most of the studied
Indices Class range Class
(km2) (%) area is high quality (56.51%), while 37.50% is
< 1.3 high 970.25 56.51 medium quality (Tab. 1). The high CQI in the
Climate quality index
1.3-1.5 medium 643.86 37.50 northern and central parts of the study
(CQI) area could be correlated with favorable air
> 1.5 low 74.37 4.33 temperature and precipitation conditions,
< 1.13 high 19.26 1.12 mediated by the Kukavica and Ostrozub
Soil Quality Index mountains (Fig. 2). Such favorable condi-
1.13-1.45 medium 1161.42 67.64
(SQI) tions are reflected in the good health of
> 1.45 low 507.80 29.58
the stands and the presence of preserved
< 1.13 high 98.45 5.73 rare and endemic communities such as
Vegetation Quality Lauroceraso-Fagetum montanum Jov. 1967.
1.13-1. 41 medium 1065.87 62.08
Index (VQI) High to medium climate quality in the
> 1.41 low 524.82 30.57
southern and southeastern parts of the
< 1.25 high 1294.13 75.37 study area results from less steep terrains
Management Quality allowing warmer air masses to break
1.25-1.5 medium 86.87 5.06
Index (MQI)
> 1.5 low 308.22 17.95 through from the Mediterranean (Perović
et al. 2019). This part of the study area is
< 1.3 high 308.04 17.94 also characterized by the presence of en-
Social quality index
(SoQI)
1.3-1.4 medium 212.22 12.36 demic species of the Balkan Peninsula such
> 1.4 low 1168.22 68.04 as Acer intermedium Panč., which forms in
this area the specific communities Fagio-Ac-
Mask areas - - 28.46 1.66
eri intermediae-colurnetum Jov. 1955 and
Total area - - 1716.94 100.00 Querco-Aceri intermediae-colurnetum Miš.
et Din. 1971 (Mišić 1981). The southwestern
and central parts of the study area along
(CQI, SQI, VQI, MQI, SoQI) and correlation fied statistically significant clusters of high the wider portions of the South Morava
of each index with ESA value. The analysis and low ESA values as well as outliers ex- River (4.33% of the studied area) are of low
was performed with the Band Collection hibiting ESA values statistically different climate quality. Significant drivers of degra-
Statistics tool in ArcMap® ver. 10.5.1 (ESRI, from their neighbors. The analysis was per- dation processes in this part of the studied
Redlands, CA, USA). formed in ArcGIS® Pro ver. 2.6 (ESRI, Red- area are temperature extremes and the ir-
The spatial distribution of ESA patterns lands, CA, USA) and tested using 999 per- regular distribution of precipitation (Kosta-
was obtained using Anselin Local Moran’s I mutations with a significance level of 0.05. dinov et al. 2018) with frequent high-inten-
analysis (Anselin 1995). The analysis identi- sity showers.
Fig. 2 - Spatial distribution
of quality indices CQI, SQI,
VQI, MQI and SoQI.
166 iForest 15: 163-170Land degradation drivers and assessment of land sensitivity to degradation
Soil quality index
iForest – Biogeosciences and Forestry
Tab. 2 - Classes of Environmentally Sensitive Areas (ESA) in the area of Grdelica Gorge
The SQI of the majority of the studied
and Vranjska Valley.
area (67.64%) resulted to be medium qual-
ity, 29.58% of the area was low quality, and
only 1.12% of the area was high quality. The Total area Total area
ESA Class Subclass Score range
(km2) (%)
central, northern, and western parts of the
study area showed low SQI values (Fig. 1). Unaffected N ≥ 1.00 ≤ 1.170 1.33 0.08
The central part is characterized by parent Potential P > 1.170 ≤ 1.225 45.10 2.62
rocks prone to weathering, mostly shale, Fragile F1 > 1.225 ≤ 1.275 255.11 14.86
sandstones, and conglomerates (Tanasije-
vić 1956, Schaetzl & Thompson 2015). The F2 > 1.275 ≤ 1.325 542.23 31.58
fragility of the soils formed on parent rock F3 > 1.325 ≤ 1.375 396.43 23.09
prone to weathering is further increased Critical C1 > 1.375 ≤ 1.425 173.76 10.12
by the absence of permanent vegetation
C2 > 1.425 ≤ 1.530 158.08 9.21
cover, especially on steep slopes. In such
conditions, soils can neither maintain pro- C3 > 1.530 116.43 6.78
ductivity nor resist erosion (Gharibreza et Mask area - - 28.46 1.66
al. 2020). The southern and eastern parts Total - - 1716.94 100.00
of the area showed medium SQI values.
The eastern part of the study area is char-
acterized by soils with a higher organic with high population pressure. The areas Social quality index
matter content formed mostly on granites of high vegetation quality include preserv- The SoQI analysis showed that 68.04% of
and granodiorites (Tanasijević 1956). The ed rare and endemic communities in areas the study area has low social quality (Tab.
reduced susceptibility of those parent of low population pressure, mostly at 1). The areas of low social quality are inhab-
rocks to weathering (Schaetzl & Thompson higher altitudes, at small and isolated sites. ited by a population largely over 65 years
2015) and higher organic matter content The dominant vegetation type in the me- of age, which indicates a high proportion
offering increased soil structure stability dium-quality areas is deciduous forests re- of older people relative to the total popula-
(Six et al. 2000) results in higher soil resis- presenting the natural vegetation of the tion (De Pina Tavares et al. 2015, Perović et
tance to degradation. In the southern part study area. Although natural, deciduous al. 2021). In addition, the population den-
of the study area, soils are deep, which is forests have a reduced potential to provide sity in the areas of low social quality is
likely a result of less pronounced relief and sufficient soil protection during the non- greater than 100 inhabitants per square
moderate slopes, among other reasons, growing season (Contador et al. 2009). De- kilometer, which adversely affects the so-
considering that slope is strongly nega- ciduous forests are not greatly endangered cial quality index of the entire area. Anthro-
tively correlated to soil depth (Mehnatkesh in terms of drought resistance and fire risk. pogenic impact, expressed in terms of pop-
et al. 2013). Natural grasslands and pastures are also of ulation density, reflects the level of human
medium vegetation quality. pressure on natural resources (De Pina Tav-
Vegetation quality index ares et al. 2015). Human pressure on crop-
The VQI assessment showed that about Management quality index land, especially land without a clearly de-
one-third (30.57%) of the study area is char- The high management quality estimated fined management policy, can directly ad-
acterized by low vegetation quality, 62.08% for 75.37% of the study area could be re- versely affect the soil condition (Prăvălie et
of the total study area exhibited medium lated to the implementation of sustainable al. 2017). The eastern parts of the study
vegetation quality, and 5.73% had high veg- management policies, mainly in the nature area (covering 17.94% of the total study
etation quality (Tab. 1). Low vegetation protection and forestry sector. The areas area) are high social quality as a conse-
quality mostly corresponds to areas of in- of high management quality coincide with quence of their lower population density
tensive agriculture and high population forests, natural grasslands, and pasture ar- (Fig. 1).
pressure. These areas are situated along eas where agricultural activities are absent
the entire course of the South Morava Riv- (Fig. 1). Sustainable management practices Environmentally sensitive area index
er, especially in the southern parts where are mostly implemented in these areas, According to the synthesis map of the
the river broadens in the valley, creating fa- such as protection regimes, where rare and ESA index (Fig. 3), the majority of the
vorable conditions for agricultural activi- endangered forest communities are pres- Grdelica Gorge and Vranjska Valley (69.53%,
ties. Conventional agricultural production, ent. The low management quality covers or 1,193.78 km2) was classified as fragile (F1,
the dominant land-use pattern in this part 17.95% of the area and is mainly located on F2, and F3). One-third (31.58%) of the total
of the study area, is characterized by agri- agricultural and bare land (Tab. 1), where investigated area (542.23 km2) was in the
cultural activities mostly carried out with- conservation measures are lacking. The ab- subclass F2.
out conservation measures (Fig. 1). Conser- sence of conservation measures is a con- The highest sensitivity classes (C) repre-
vation measures in agriculture include the tradiction of sustainable management sent one-quarter (26.11%) of the total area
cultivation of a cover crop providing suffi- practice (Mehmet Tuğrul 2020). of Grdelica Gorge and Vranjska Valley, or
cient protection against degradation (Lóp-
ez-Vicente et al. 2020). In addition, low veg-
etation quality is a consequence of the ab- Tab. 3 - Spatial correlation matrix of quality indices and ESA.
sence of natural forest vegetation in this
part of the study area. The areas with a
- CQI SQI VQI MQI SoQI ESA
high vegetation quality are small and iso-
lated throughout the study area (Fig. 1). CQI 1.000 -0.023 0.149 0.147 0.065 0.529
Transitional areas of forests and shrubland SQI - 1.000 0.051 -0.120 0.209 0.347
belong to the categories of vegetation
VQI - - 1.000 0.275 0.147 0.675
most resistant to drought (Contador et al.
2009, Prăvălie et al. 2017) and less prone to MQI - - - 1.000 0.023 0.536
fire risk (Contador et al. 2009, Fernandes SoQI - - - - 1.000 0.448
2009, Xanthopoulos et al. 2012). The resis- ESA - - - - - 1.000
tance to fire is especially important in areas
iForest 15: 163-170 167Lukić S et al. - iForest 15: 163-170
maritime climate, these factors suggested
iForest – Biogeosciences and Forestry
Fig. 3 - The synthe- that the southern part of the study area
sis map of ESA would be less susceptible to degradation.
index in the area However, intensive agriculture is the domi-
of Grdelica Gorge nant land use therein, precisely due to the
and Vranjska Val- favorable environmental conditions. Inten-
ley. sive agriculture leads to soil depletion by
overexploitation, loss of soil organic mat-
ter (Gomiero 2016) and acceleration of ero-
sion processes (Gharibreza et al. 2020). In
addition, agricultural management policies
are insufficiently implemented in this area.
As a consequence, the area is character-
ized by high sensitivity to degradation (Fig.
2). The overlooked importance of sustain-
able agricultural measures and insufficient-
ly implemented regulatory measures in
conventional agricultural practices lead to
serious land degradation (Gomiero 2016). A
significant positive correlation between
the MQI and ESA index (r = 0.536) in the
study area indicates the importance of sus-
tainable land management in controlling
land degradation. Statistically significant
clustering of high ESA index values coin-
cides with areas of low management, so-
cial, and vegetation quality (Fig. 3). These
areas are located in the valley along the
South Morava River course in the southern
part of the study area, or are scattered on
pronounced relief and steep slopes in the
448.28 km2. Subclass C1 covers 10.12% of most sensitive to degradation processes northern part of the study area. The lack of
the total area (173.76 km2). Classes N and P are located in the southern part of the forest vegetation due to intensive agricul-
are the least represented in the investi- study area, which is characterized by a ture and high population pressure in the
gated area, covering 0.08% and 2.62% of the wide river valley, milder slopes, and deeper southern part of the study area has also
total area, respectively (Tab. 2). soils compared to the northern part. Com- contributed to higher land susceptibility to
According to the ESA index, the areas bined with the favorable impact of a milder degradation. A positive correlation be-
tween MQI and VQI (r = 0.275 – Tab. 3) indi-
cates the importance of proper land man-
Fig. 4 - Spatial pat-
agement in the maintenance of natural
tern of ESAs to
vegetation cover, especially forest cover
degradation in
which is the most effective vegetation type
Grdelica Gorge and
for controlling land degradation (Salvati et
Vranjska Valley.
al. 2015).
The areas of low sensitivity to land degra-
dation (NP, P, and F1) are located in the
eastern part of the study area and include
high-altitude areas protected by forest veg-
etation. Statistically significant clustering
of low ESA index values also coincides with
eastern areas characterized by medium
vegetation quality, high to medium man-
agement quality, and high social quality
(Fig. 4). The lower sensitivity to degrada-
tion in these areas is probably a conse-
quence of more favorable climatic condi-
tions (lower air temperatures and higher
precipitation). Particularly low sensitivity to
land degradation is shown by small, scat-
tered areas throughout the eastern part of
the study area, which are characterized by
the presence of undisturbed, natural au-
tochthonous forests. The low population
pressure in this area is the main reason of
such forest remains. The sustainable forest
management carried out in this area allows
a higher canopy cover which mitigates
both water and wind erosion and permits a
large accumulation of soil organic matter.
Further, soil organic matter affects the ag-
gregation and stability of the soil structure
168 iForest 15: 163-170Land degradation drivers and assessment of land sensitivity to degradation
and is generally an indicator of soil quality CGLS (2012). Corine land cover 2012. Copernicus selection of indicators for land degradation and
iForest – Biogeosciences and Forestry
that decreases soil susceptibility to degra- Global Land Service - CGLS, web site. [online] desertification monitoring: methodological ap-
dation. A strong positive correlation was URL: http://land.copernicus.eu/pan-european/ proach. Environmental Management 54: 951-
observed between the ESA index and VQI corine-land-cover/clc-2012 970. - doi: 10.1007/s00267-013-0109-6
(r = 0.675), suggesting the importance of Contador JFL, Schnabel S, Gutiérrez AG, Fernán- Kosmas C, Kirkby MJ, Geeson N (1999). The ME-
vegetation cover in controlling land degra- dez MP (2009). Mapping sensitivity to land DALUS project - Mediterranean desertification
dation in the study area. degradation in Extremadura, SW Spain: on the and land use: manual on key indicators of de-
sensitivity to land degradation in SW Spain. sertification and mapping environmentally sen-
Conclusions Land Degradation and Development 20: 129- sitive areas to desertification. Project ENV4 CT
Various factors are driving the degrada- 144. - doi: 10.1002/ldr.884 95 0119, Directorate-General Science, Research
tion in the area of Grdelica Gorge and Vran- De Pina Tavares J, Baptista I, Ferreira AJD, Fer- and Development, Brussels, Belgium, pp. 88.
jska Valley. The MEDALUS model, which al- reira AJD, Amiotte-Suchet P, Coelho C, Gomes Kostadinov S, Braunović S, Dragićević S, Zlatić M,
lows adjustment to local conditions and S, Amoros R, Dos Reis EA, Mendes AF, Costa L, Dragović N, Rakonjac N (2018). Effects of ero-
data availability, was applied for land de- Bentub J, Varela L (2015). Assessment and map- sion control works: case study Grdelica Gorge,
gradation sensitivity analysis. The results ping the sensitive areas to desertification in an the South Morava River (Serbia). Water 10:
indicate that most of the Grdelica Gorge insular Sahelian mountain region - Case study 1094. - doi: 10.3390/w10081094
and Vranjska Valley area is susceptible to of the Ribeira Seca Watershed, Santiago Island, Lukić S (2013). The effects of ameliorative af-
land degradation, largely depending on the Cabo Verde. Catena 128: 214-223. - doi: 10.1016/j. forestation in Grdelička Gorge and Vranjska Val-
type and quality of the vegetation cover. catena.2014.10.005 ley. PhD thesis, Department of Ecological Engi-
Forested areas with optimal species com- Dindaroğlu A (2015). Resistance to the reclama- neering of Soil and Water Resources Protec-
position and high canopy cover are the tion of environmentally sensitive areas through tion, University of Belgrade, Serbia, pp. 227.
least sensitive to degradation, while areas the establishment of a new forest ecosystem. López-Vicente M, Calvo-Seas E, Alvarez S, Cerdà
under intensive agricultural production are Fresenius Environmental Bulletin 24: 1195-1203. A (2020). Effectiveness of cover crops to re-
the most sensitive. The areas of intensive Djorović M (2005). Vodna i eolska erozija zem- duce loss of soil organic matter in a rainfed
agriculture are also under high population ljišta [Water and wind soil erosion]. Acta Bio- vineyard. Land 9 (7): 230. - doi: 10.3390/land907
pressure and are insufficiently managed in logica Jugoslavica, Belgrade, Serbia, pp. 440. 0230
terms of conservation measures, leading to [in Serbian] Mehmet Tuğrul K (2020). Soil management in
greater sensitivity. Forests in this area are Fernandes PM (2009). Combining forest struc- sustainable agriculture. In: “Sustainable Crop
generally well managed in contrast to agri- ture data and fuel modelling to assess fire haz- Production” (Hasanuzzaman M, Carvalho Min-
cultural land. ard in Portugal. Annals of Forest Science 66 (4): hoto Teixeira Filho M, Fujita M, Assis Rodrigues
According to our results, 95.64% of the 415p1-415p9. - doi: 10.1051/forest/2009013 Nogueira T eds). IntechOpen, London, UK. -
Grdelica Gorge and Vranjska Valley area Ferrara A, Kosmas C, Salvati L, Padula A, Man- doi: 10.5772/intechopen.88319
falls into the fragile and critical sensitivity cino G, Nolè A (2020). Environmentally sensi- Mehnatkesh A, Ayoubi S, Jalalian A, Sahrawat KL
classes. Of the total area, 69.53% is consid- tive areas to land degradation and desertifica- (2013). Relationships between soil depth and
ered fragile, and 31.58% belongs to the F2 tion (LDD) at the global level: updating the terrain attributes in a semi arid hilly region in
subclass; 26.11% of the area is considered MEDALUS-ESA framework for worldwide LDD western Iran. Journal of Mountain Science 10
critical, and 10.12% is in the C1 subclass. assessment. Land Degradation and Develop- (1): 163-172. - doi: 10.1007/s11629-013-2427-9
These results can help administrators de- ment 31: 1593-1608. - doi: 10.1002/ldr.3559 Mirzabaev A, Nkonya E, Goedecke Johnson JT,
velop strategies for optimal land-use pat- Gharibreza M, Zaman M, Porto P, Fulajtar E, Per- Anderson W (2015). Global drivers of land de-
terns. In the areas most endangered by saei L, Eisaei H (2020). Assessment of defor- gradation and improvement. In: “Economics of
degradation, mandatory application of estation impact on soil erosion in loess forma- Land Degradation and Improvement - A Global
conservation measures alongside agricul- tion using 137Cs method (case study: Golestan Assessment for Sustainable Development”
tural production should be taken as an ap- Province, Iran). International Soil and Water (Nkonya E, Mirzabaev A, von Braun J eds).
propriate management practice. The pro- Conservation Research 8 (4): 393-405. - doi: Springer Science+Business Media BV, Nether-
tective effect of vegetation against degra- 10.1016/j.iswcr.2020.07.006 lands, pp. 167-196.
dation support the incorporation of woody Gomiero T (2016). Soil degradation, land scarcity Mišić V (1981). Sumska vegetacija klisura i kan-
species in agricultural production, thus pro- and food security: reviewing a complex chal- jona istočne Srbije [Forest vegetation of gorges
tecting against land degradation and ad- lenge. Sustainability 8: 281. - doi: 10.3390/su803 and canyons of eastern Serbia]. Institut za bi-
dressing the socioeconomic needs of the 0281 ološka istraživanja “Siniša Stanković”, Bel-
population living in the investigated area. Huang J, Zhang G, Zhang Y, Guan X, Wei Y, Guo R grade, Serbia, pp. 328 [in Serbian]
(2020). Global desertification vulnerability to Mohamed ES (2013). Spatial assessment of de-
Acknowledgments climate change and human activities. Land De- sertification in north Sinai using modified ME-
This work was carried out as part of the gradation and Development 1-12. - doi: 10.1002/ DALUS model. Arabian Journal of Geosciences
project “Investigation of Climate Change ldr.3556 6: 4647-4659. - doi: 10.1007/s12517-012-0723-2
and Its Environmental Impact: Monitoring Kosmas C, Kairis O, Karavitis C, Ritsema C, Salvati Momirović N, Kadović R, Perović V, Marjanović
of Impact and Adaptation and Mitigation” L, Acikalin S, Alcalá M, Alfama P, Atlhopheng J, M, Baumgertel A (2019). Spatial assessment of
(III43007 2011-2018), funded by the Ministry Barrera J, Belgacem A, Sole-Benet A, Brito J, the areas sensitive to degradation in the rural
of Education, Science, and Technological Chaker M, Chanda R, Coelho C, Darkoh M, Dia- area of the municipality Cukarica. International
Development of the Republic of Serbia mantis I, Ermolaeva O, Fassouli V, Fei W, Feng J, Soil and Water Conservation Research 7: 71-80.
(contract no. 451-03-9/2021/14/2000169). Fernandez F, Ferreira A, Gokceoglu C, Gonzalez - doi: 10.1016/j.iswcr.2018.12.004
D, Gungor H, Hessel R, Juying J, Khatteli H, Khi- NFI (2009). The National forest inventory of the
References trov N, Kounalaki A, Laouina A, Lollino P, Lopes Republic of Serbia: the growing stock of the
Anselin L (1995). Local indicators of spatial asso- M, Magole L, Medina L, Mendoza M, Morais P, Republic of Serbia. Ministry of Agriculture,
ciation - LISA. Geographical Analysis 27 (2): 93- Mulale K, Ocakoglu F, Ouessar M, Ovalle C, Pe- Forestry and Water Management, Forest Direc-
115. - doi: 10.1111/j.1538-4632.1995.tb00338.x rez C, Perkins J, Pliakas F, Polemio M, Pozo A, torate, Belgrade, Serbia. [ISBN 978-86-83285-
Bakr N, Weindorf DC, Bahnassy MH, El-Badawi Prat C, Qinke Y, Ramos A, Ramos J, Riquelme J, 21-1]
MM (2012). Multi-temporal assessment of land Romanenkov V, Rui L, Santaloia F, Sebego R, Olsson L, Barbosa H, Bhadwal S, Cowie A, Del-
sensitivity to desertification in a fragile agro- Sghaier M, Silva N, Sizemskaya M, Soares J, usca K, Flores-Renteria D, Hermans K, Jobbagy
ecosystem: environmental indicators. Ecologi- Sonmez H, Taamallah H, Tezcan L, Torri D, Un- E, Kurz W, Li D, Sonwa DJ, Stringer L (2019).
cal Indicators 15: 271-280. - doi: 10.1016/j.ecolind. garo F, Valente S, De Vente J, Zagal E, Zeiliguer Land degradation. In: “Climate Change and
2011.09.034 A, Zhonging W, Ziogas A (2014). Evaluation and Land: an IPCC Special Report on Climate
iForest 15: 163-170 169Lukić S et al. - iForest 15: 163-170
Change, Desertification, Land Degradation, 6/j.apgeog.2010.04.006 Faculty of Forestry, Belgrade, Serbia, pp. 261 [in
iForest – Biogeosciences and Forestry
Sustainable Land Management, Food Security, Salvati L, Gemmiti R, Perini L (2012). Land degra- Serbian]
and Greenhouse Gas Fluxes In Terrestrial dation in Mediterranean urban areas: an unex- UNCCD (1994). United Nations convention to
Ecosystems” (Shukla PR, Skea J, Calvo Buendia plored link with planning? Land degradation in combat desertification. A/AC. 214/27, Paris,
E, Masson-Delmotte V, Pörtner HO, Roberts Mediterranean urban areas. Area 44: 317-325. - France.
DC, Zhai P, Slade R, Connors S, van Diemen R, doi: 10.1111/j.1475-4762.2012.01083.x Vasić M (1992). Šumski požari, priručnik za šu-
Ferrat M, Haughey E, Luz S, Neogi S, Pathak M, Salvati R, Salvati L, Corona P, Barbati A, Ferrara marske inženjere i tehničare [Forest fires, hand-
Petzold J, Portugal Pereira J, Vyas P, Huntley E, A (2015). Estimating the sensitivity to desertifi- book for forest engineers and technicians].
Kissick K, Belkacemi M, Malley J eds). IPCC, cation of Italian forests. iForest 8: 287-294. - Javno preduzeće za gazdovanje šumama “Srbi-
Geneva, Switzerland, pp. 345-436. doi: 10.3832/ifor1111-008 jašume”, Univerzitet u Beogradu, Šumarski
Perović V, Kadović R, Djurdjević V, Braunović S, Santini M, Caccamo G, Laurenti A, Noce S, Valen- fakultet, Belgrade, Serbia, pp. 105. [in Serbian]
Čakmak D, Mitrović M, Pavlović P (2019). Ef- tini R (2010). A multi-component GIS frame- Vatandaşlar C, Yavuz M, Leuchner M (2020). Ero-
fects of changes in climate and land use on soil work for desertification risk assessment by an sion control service of forest ecosystems: a
erosion: a case study of the Vranjska Valley, integrated index. Applied Geography 30: 394- case study from Northeastern Turkey. In:
Serbia. Regional Environmental Change 19: 415. - doi: 10.1016/j.apgeog.2009.11.003 “Smart Geography, Key Challenges in Geogra-
1035-1046. - doi: 10.1007/s10113-018-1456-x Schaetzl RJ, Thompson ML (2015). Soils: genesis phy” (Nedelkov S, Zhelezov G, Ilieva N, Nikol-
Perović V, Kadović R, Djurdjević V, Pavlović D, and geomorphology (2nd edn). Cambridge Uni- ova M, Koulov B, Naydenov K, Dimitrov S eds).
Pavlović M, Čakmak D, Mitrović M, Pavlović P versity Press, New York, USA, pp. 778. EUROGEO Book Series, Springer Nature AG,
(2021). Major drivers of land degradation risk in Seitz S, Goebes P, Song Z, Bruelheide H, Härdtle Switzerland, pp. 443-455.
Western Serbia: current trends and future sce- W, Kühn P, Li Y, Scholten T (2016). Tree species Vieira RMSP, Tomasella J, Alvalá RCS, Sestini MF,
narios. Ecological Indicators 123: 107377. - doi: and functional traits but not species richness Affonso AG, Rodriguez DA, Barbosa AA, Cunha
10.1016/j.ecolind.2021.107377 affect interril erosion processes in young sub- APMA, Valles GF, Crepani E, De Oliveira SBP, De
Prăvălie R, Săvulescu I, Patriche C, Dumitraşcu tropical forests. Soil 2: 49-61. - doi: 10.5194/soil- Souza MSB, Calil PM, De Carvalho MA, Valeri-
M, Bandoc G (2017). Spatial assessment of land 2-49-2016 ano DM, Campello FCB, Santana MO (2015).
degradation sensitive areas in southwestern Six J, Paustian K, Elliott ET, Combrink C (2000). Identifying areas susceptible to desertification
Romania using modified MEDALUS method. Soil structure and organic matter: I. Distribu- in the Brazilian northeast. Solid Earth 6: 347-
Catena 153: 114-130. - doi: 10.1016/j.catena.2017. tion of aggregate-size classes and aggregate- 360. - doi: 10.5194/se-6-347-2015
02.011 associated carbon. Soil Science Society America Xanthopoulos G, Calfapietra C, Fernandes P
Prăvălie R, Patriche C, Săvulescu I, Sîrodoev I, Journal 64 (2): 681-689. - doi: 10.2136/sssaj2000. (2012). Fire hazard and flammability of Euro-
Bandoc G (2020). Spatial assessment of land 642681x pean forest types. In: “Post-fire Management
sensitivity to degradation across Romania. A Song Z, Seiz S, Li J, Goebes P, Schmidt K, Kühn P and Restoration of Southern European For-
quantitative approach based on the modified (2019). Tree diversity reduced soil erosion by ests” (Moreira F, Arianoutsou M, Corona P, De
MEDALUS methodology. Catena 187: 104407. - affecting tree canopy and biological soil crust Las Heras J eds). Managing Forest Ecosystems
doi: 10.1016/j.catena.2019.104407 development in a subtropical forest experi- 24, Springer Science+Business Media BV, Neth-
RHSS (2018). Meteorological Annual I - Climato- ment. Forest Ecology and Management 444: erlands, pp. 79-92.
logical Data. Republic Hydrometeorological 69-77. - doi: 10.1016/j.foreco.2019.04.015
Service of Serbia, Belgrade, Web site. [online] Szilagyi J, Irimus IA, Toganel C, Szilagyi E (2016). Supplementary Material
URL: http://www.hidmet.gov.rs/latin/meteorol Rainfall aggressiveness evaluation in Reghin
ogija/klimatologija_godisnjaci.php Hills using Fournier index. Riscuri si Catastrofe Tab S1 - Parameters of quality indices: CQI,
Salvati L, Zitti M (2008). Regional convergence 18: 83-89. SQI, VQI, MQI and SoQI classes, corre-
of environmental variables: empirical evidences Tanasijević D (1956). Pedological and agrochemi- sponding weights, and data sources.
from land degradation. Ecological Economics cal soil properties and the state of soil erosion
68: 162-168. - doi: 10.1016/j.ecolecon.2008.02. in Grdelička gorge and Vranjska valley. Soil Sci- Tab S2 - Weighting indices for the ability of
018 ence Institute, Belgrade, Serbia, pp. 200 [in Ser- stands to provide erosion control.
Salvati L, Bajocco S (2011). Land sensitivity to de- bian]
sertification across Italy: past, present, and fu- Tomić Z (2004). Sumarska fitocenologija [For- Link: Lukic_3871@suppl001.pdf
ture. Applied Geography 31: 223-231. - doi: 10.101 estry phytocenology]. University of Belgrade
170 iForest 15: 163-170You can also read