ANTÍGONA SEGURA,1,*, JAMES F. KASTING,1,* VICTORIA MEADOWS,2,* MARTIN COHEN,3,* JOHN SCALO,4 DAVID CRISP,5,* REBECCA A.H. BUTLER,5,* and GIOVANA ...
←
→
Page content transcription
If your browser does not render page correctly, please read the page content below
BIOSIGNATURES FROM EARTH-LIKE PLANETS AROUND M DWARFS
                         (Astrobiology, in press)

  ANTÍGONA SEGURA,1,*,† JAMES F. KASTING,1,* VICTORIA MEADOWS,2,* MARTIN
 COHEN,3,* JOHN SCALO,4 DAVID CRISP,5,* REBECCA A.H. BUTLER,5,* and GIOVANA
                                 TINETTI6,*
       1
         Department of Geosciences, The Pennsylvania State University, University Park,
Pennsylvania.
       2
         Infrared Processing and Analysis Center and 5NASA Jet Propulsion Laboratory,
California Institute of Technology; and 6California Institute of Technology/National Research
Council, Pasadena, California.
       3
         Radio Astronomy Laboratory, University of California, Berkeley, Berkeley, California.
       4
         Department of Astronomy, University of Texas, Austin, Texas.
       *
         Members of the NASA Astrobiology Institute.
       †
         Present address: Infrared Processing and Analysis Center, California Institute of
Technology, Pasadena, California.

                                          ABSTRACT
Coupled one-dimensional photochemical-climate calculations have been performed for
hypothetical Earth-like planets around M dwarfs. Visible/near-infrared and thermal-
infrared synthetic spectra of these planets were generated to determine which biosignature
gases might be observed by a future, space-based telescope. Our star sample included two
observed active M dwarfs—AD Leo and GJ 643—and three quiescent model stars. The
spectral distribution of these stars in the ultraviolet generates a different photochemistry
on these planets. As a result, the biogenic gases CH4, N2O, and CH3Cl have substantially
longer lifetimes and higher mixing ratios than on Earth, making them potentially
observable by space-based telescopes. On the active M-star planets, an ozone layer similar
to Earth’s was developed that resulted in a spectroscopic signature comparable to the
terrestrial one. The simultaneous detection of O2 (or O3) and a reduced gas in a planet’s
atmosphere has been suggested as strong evidence for life. Planets circling M stars may be
good locations to search for such evidence.

Key Words: Habitable planets—M dwarfs—Biosignatures—Biomarkers—Terrestrial
Planet Finder.
INTRODUCTION
         OW-MASS MAIN SEQUENCE STARS of spectral class M (M dwarfs, or dM stars) are the most

L        abundant stars in the galaxy, representing about 75% of the total stellar population.
         Relative to our Sun, M stars have many unusual characteristics. Their low masses (0.08–
         0.8 M) allow them to have main sequence lifetimes on the order of 1011 years (or more),
         i.e., significantly longer than the current age of the universe. Because of their low
effective temperatures their spectra are dominated by molecular absorption bands that
redistribute their radiated energy in a distinctly non-blackbody fashion. Most M stars also exhibit
significant temporal variability as a consequence of phenomena occurring within the region from
their photospheres to their coronae. As a result, they emit large amounts of short-wavelength
(SW) ultraviolet (UV) radiation and x-rays during their active periods.
         Given these stellar characteristics, and the likely general characteristics of planets within
the habitable zone (HZ) of an M star, the potential habitability of planets around M dwarfs has
been questioned by a number of authors (e.g., Dole, 1964; Kasting et al., 1993). We discuss
some of the apparent problems below. It seems likely that planets do form around such stars, and
there is new observational evidence to support this. Numerical simulations predicted that
Neptune-like and terrestrial-type planets may be common around M stars, given sufficient disk
mass (Wetherill, 1996; Laughlin et al., 2004), though formation of gas giants may be inhibited
(Laughlin et al., 2004). This prediction has been borne out by the detection of a Neptune-size
planet (~18 M) around the M2.5 star GJ 436 (Butler et al., 2004). Because of the small mass of
M stars, Neptune-like and possibly even terrestrial planets can be detected using the radial
velocity and transit photometry techniques from ground-based telescopes (Doyle and Deeg,
2002; Kürster et al., 2003; Hatzes, 2004; Sozzetti et al., 2004). Recently, an even smaller (~7.5
M), possibly rocky, planet has been discovered around the dM4 nearby star, GJ 876 (E.J. Rivera
et al., manuscript submitted for publication). Presently, three projects are searching for planets
around M stars: the radial velocity program using the Hobby-Eberly telescope (Endl et al.,
2003); the astrometric program Stellar Planet Survey (STEPS) (Pravdo et al., 2004, 2005), which
uses the Palomar 5-m telescope; and the Keck radial velocity program (Marcy et al., 1998).
         Although Earth-mass planets around M stars—or any main sequence star besides the
Sun—have yet to be discovered, we assume for now that these planets will eventually be found
around M stars.
         The HZ, as defined by Hart (1978) and Kasting et al. (1993), is the region around a star
where a planet can maintain liquid water at its surface. For an M dwarf, the HZ is so close to the
star that the planets are likely to become tidally locked within a relatively short time after they
form (Dole, 1964; Kasting et al., 1993). A planet with this characteristic, termed a "synchronous
rotator," receives starlight on only one hemisphere, while the other hemisphere remains forever
in the dark. If the dark side of the planet gets too cold, then the volatile compounds that make up
the atmosphere and oceans may freeze out to form a giant ice cap. This process is sometimes
termed “atmospheric collapse.” Detailed models have shown that this is not an insurmountable
impediment to planetary habitability for planets with even modestly dense atmospheres (Haberle
et al., 1996; Joshi et al., 1997; Joshi, 2003). Given an insolation equal to that on Earth, a 100-
mbar CO2 atmosphere (~1/10th of the Earth’s atmospheric mass) would transport sufficient heat
to the dark side to avoid atmospheric collapse. Earth-like planets that are relatively far out in the
HZ of M stars are likely to have high CO2 concentrations as a consequence of the carbonate–
silicate cycle feedback (Kasting et al., 1993). High CO2 levels increase the radiative cooling time
of the atmosphere, thereby allowing heat to be transferred effectively from one hemisphere to

                                                                                                    2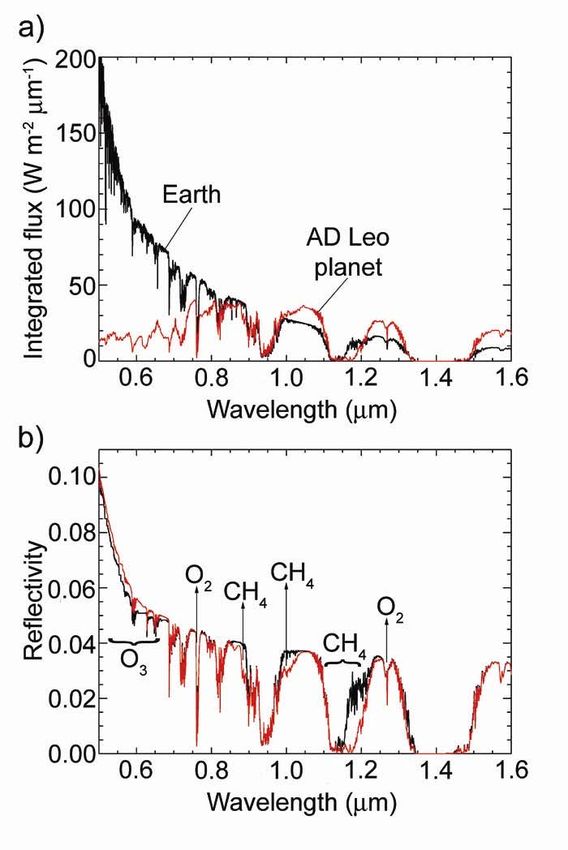
another. If an extensive ocean is present, even a low-CO2 planet like Earth (fCO2 = 300 ppmv)
might remain clement, provided that a vigorous atmospheric hydrological cycle transports heat
from the dayside to the nightside (Joshi, 2003).
         In our Solar System, Venus and Titan are examples of nearly tidally locked bodies with
dense super-rotating atmospheres. The surface temperature on Venus is believed to be nearly
constant on both the day- and nightside. For Titan, equator-to-pole gradients in the troposphere
could be as large as 20°, according to the information available at present (not including the most
recent Cassini-Huygens results). However, the atmospheres on both these planets have
significantly normalized the surface temperatures, even though Titan is a synchronous rotator
with Saturn, and Venus rotates with a 243-day period (yet the atmosphere rotates once every 4
days). It is important to note that not all close-in planets become synchronous rotators. Mercury,
for example, is in a 3:2 spin/orbit resonance, meaning that it rotates three times for every two
revolutions around the Sun.
         Another question with regard to the potential habitability of M-star planets is a deficiency
in photosynthetically active radiation (PAR), which lies predominantly in the wavelength range
400–720 nm. Photosynthesis can proceed at wavelengths longer than 720 nm, but it does not
produce oxygen (Heath et al., 1999). PAR emitted by M stars is diminished by the large number
of photospheric absorption bands, notably those of molecular TiO between 459 nm and 625 nm
(Heath et al., 1999, Fig. 4), and the redder bands near 690 and 705 nm. But this problem may be
partially compensated by the perpetual illumination that a photosynthetic organism would
receive on the dayside of the tidally locked planet (Heath et al., 1999). Furthermore, the
minimum PAR flux required to sustain marine photosynthesis is only ~5  10-4 of the average
flux incident at the Earth’s surface (McKay, 2000). By comparison, the typical PAR flux for a
habitable planet circling one of the M stars studied here is about 0.1 times Earth's flux. Hence,
the lack of PAR should not prevent M-star planets from harboring O2-producing organisms.
         A potentially more serious problem is the temporal variability of M dwarfs. The most
prominent features of this activity are flares—sudden, unpredictable releases of energy that range
from “microflares,” with energies as small as can be detected (~1028 erg of radiative energy
release), to flares with blue and UV energies as large as 1034–1037 ergs in the most active dMe
stars [H emission line main sequence M stars (see Hawley and Pettersen, 1991; Liebert et al.,
1999; Güdel et al., 2003, Table 1)]. Comparably energetic x-ray flares have been observed in
other M stars [e.g., AU Mic (Cully et al., 1993), EV Lac (Favata et al., 2000)]. For the strongest
flare stars, it is estimated that flares more energetic than ~1032 ergs (the largest energies observed
so far for solar flares) occur at a rate of roughly one per day, depending on their overall coronal
luminosity (Audard et al., 2000, Fig. 4). Each flare is a unique event that can evolve on time
scales from tens of seconds to a day or more (Houdebine, 2003). The frequency and lifetime of
the flares depend on the energy of each event: large flares occur less often but last longer than
the small ones (Gershberg, 1989).
         In an Earth-like atmosphere, the energy released by x-rays can be absorbed and re-
emitted, cascading down to longer wavelengths that affect ozone (O3) chemistry in the
stratosphere and below (Smith et al., 2004a,b). M dwarfs are generally much more active than
solar-like stars (Gershberg et al., 1999), and so it is not easy to extrapolate the consequences of
that activity to biological evolution on an M-star planet. For illustration of the more intense
activity of M stars relative to solar-like stars of the same age, we compare the ROSAT soft x-ray
coronal luminosities of  Cen (G2V+K1V) and its distant binary companion Proxima Cen
(M5.5Ve). According to Huensch et al. (1998) Lx ~1020 W for  Cen, while Lx ~1021 W for

                                                                                                    3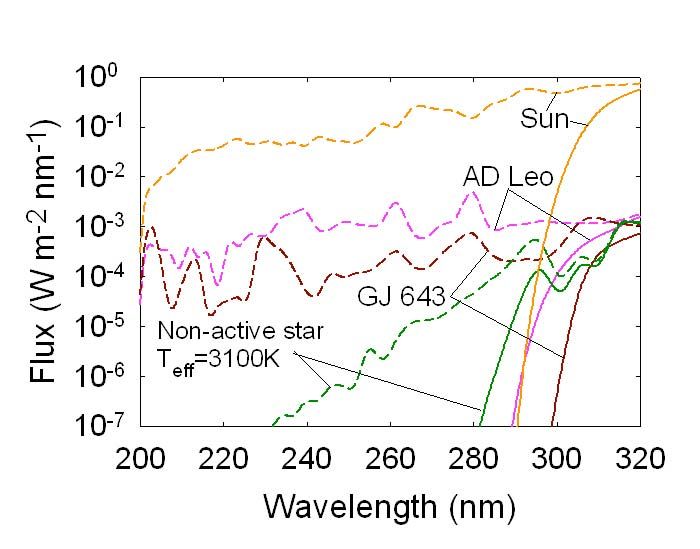
Proxima Cen (Güdel et al., 2004, Table 4). Considering that Proxima Cen is at least a factor of
10-2 fainter than  Cen in bolometric luminosity, this shows that (Lx/Lbol) is at least 103 times
larger for Proxima Cen. The M star Proxima Cen would be absolutely and effectively (for a
planet in the liquid water HZ) a stronger source of x-rays than the G star  Cen, which has the
same age.
         Yet another problem for M-star planets is the possible erosion of the planet’s atmosphere
caused by high extreme UV emissions and strong stellar winds (Lammer et al., 2004). Earth-like
planets may lose their atmospheres because of extreme UV-driven hydrodynamic escape if they
have a mass less than a specific minimum value that varies with each star (Lammer et al., 2004).
This is certainly a phenomenon that deserves to be carefully studied. However, we do not feel
that the present state of such investigations precludes the possibility that some M-star planets can
retain substantial atmospheres.
         If Earth-like planets around M dwarfs do exist and do harbor living organisms, the
remaining question is whether we will be able to detect any spectroscopic signature of that life.
Those spectral features whose presence or abundance can be attributed to life are called
"biomarkers" or "biosignatures" (Des Marais et al., 2002; Kaltenegger et al., 2002). For planets
with Earth’s atmospheric composition around F, G, and K stars, O2 and O3 are the biosignatures
that are most likely to be detectable (Owen, 1980; Leger et al., 1993; Angel and Woolf, 1996;
Des Marais et al., 2002; Selsis et al., 2002; Segura et al., 2003). O2 is produced almost entirely
by photosynthesis on Earth, while O3 is generated by O2 photochemistry. Nitrous oxide (N2O)
and methane (CH4) have been considered as possible biosignatures for Earth-like atmospheres.
Biology is believed to be the principal producer of N2O on modern Earth, with denitrification of
the soil by bacteria currently identified as the main source process (Stein and Yuk, 2003).
Methane has both biological and non-biological sources. Biological production is by
methanogenic bacteria (i.e., methanogens) that live in a variety of anaerobic environments,
including the intestines of ruminants (especially cows) and the flooded soils underlying rice
paddies. These biological sources appear to outweigh abiotic sources (principally submarine
outgassing) by a factor of at least 30. [Kasting and Catling (2003) had estimated this factor to be
300, based on measurements of abiotically produced methane emanating from midocean ridge
vents (Kelley et al., 2001). The measured methane concentrations have since increased by a
factor of 10 (Kelley et al., 2005), so the ratio of biotic to abiotic production rates is decreased by
this same factor. Work in progress demonstrates that the vent methane is indeed abiotic (D.
Kelley, personal communication).] Although N2O has no strong features in the visible below 1.0
µm, it has several bands in the mid-infrared (MIR), principally at 7.8, 8.5, and 17 µm. Methane
has relatively strong molecular bands at visible and near-infrared (IR) wavelengths in regions of
the spectrum between 0.76 and 1.2 µm, and in the MIR near 7.7 µm. CH4 and N2O would be
hard to detect in the MIR on modern Earth, primarily because of their low concentration (1.7 and
0.3 ppmv, respectively), but also because of the presence of water vapor in our atmosphere,
which depresses the observed spectrum strongly in the 5–8 µm wavelength region. However,
CH4 might be more detectable on a planet like the early Earth, which had much higher
atmospheric CH4 concentrations (Schindler and Kasting, 2000; Segura et al., 2003).
         During the next decade a new generation of space-based telescopes, including two
Terrestrial Planet Finder (TPF) missions under study by NASA and the Darwin mission being
studied by ESA, will hopefully be able to detect and characterize habitable planets around other
stars in both the visible/near-IR and thermal-IR parts of the spectrum. The first scheduled NASA
mission is TPF-C, which is a coronagraph that will operate in the visible and near-IR. TPF-I and

                                                                                                    4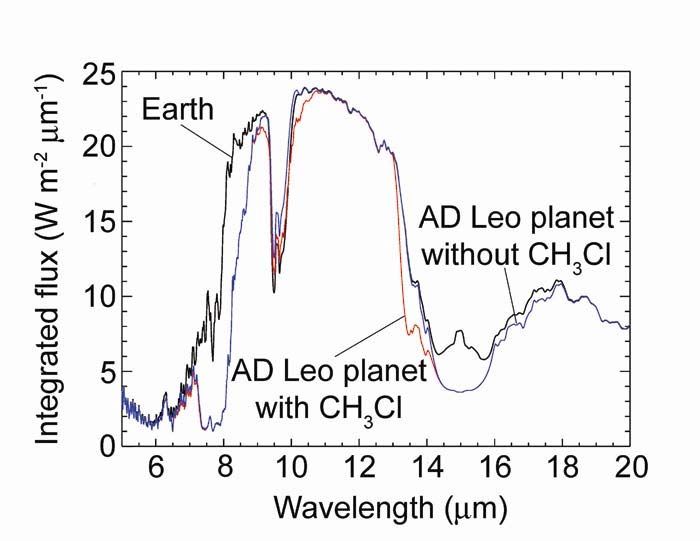
Darwin are envisioned as free-flying interferometers that will operate at thermal IR wavelengths.
Despite the large numbers of M dwarfs in the solar neighborhood, these M-star systems are not
easy to study with these missions, as their HZs lie extremely close to their parent stars, thus
requiring high spatial resolution. The interferometers offer the best possibility for doing so, as
their baseline can be lengthened by flying the spacecraft farther apart. However, even TPF-C
may be able to observe at least part of the HZ around a few M stars, given its predicted 8-m-long
telescope axis and 60 mas (= 4 /D) resolution at 0.6 µm. A list of possible TPF target stars may
be found at http://planetquest.jpl.nasa.gov/Navigator/library/basdtp.pdf.
        In this work, we have taken a first step toward understanding which biosignatures may be
observable on Earth-like planets around such stars. Using a one-dimensional, coupled
photochemical/radiative-convective model we have time-stepped the atmospheric state to
equilibrium to determine the abundance of stratospheric ozone and other biogenic gases on
hypothetical Earth-like planets around M stars. The M stars chosen as the host stars for this study
include two observed M dwarfs (AD Leo and GJ 643, both high-activity M stars) and a suite of
hypothetical M dwarfs with different photospheric temperatures, which display no
chromospheric activity. These two sets of M stars are used to bracket and illustrate the extremes
of the phenomena likely to be observed. As a first approximation we have used time-averaged
UV spectra that do not include large flares. A subsequent study will deal with the vastly more
complicated, time-dependent problem. Synthetic spectra calculated for these planets will
eventually be part of a support library for planet detection and characterization missions, posted
at the Virtual Planetary Laboratory website http://vpl.ipac.caltech.edu.

                                     MODELS AND DATA
Photochemical and climate models
        A one-dimensional photochemical model (Pavlov and Kasting, 2002) and a radiative-
convective model (Pavlov et al., 2000) were used for this work. They were applied in a loosely
coupled mode, as described in Segura et al. (2003). All of the simulations were performed with a
constant surface pressure of 1 atm. The nitrogen (N2) and oxygen (O2) abundances were set equal
to Earth’s present atmospheric level (PAL), while the CO2 mixing ratio was kept constant at 335
ppmv. The models were tuned to reproduce average observed terrestrial vertical profiles for
water vapor, temperature, and ozone (see Fig. 1 in Segura et al., 2003). For the extrasolar planet
calculations, stellar fluxes were scaled so as to produce a surface temperature equal to Earth’s
average surface temperature (288 K). They were then rescaled to account for the additional
greenhouse warming by methane. Thus, the objective of the present study was to see what would
happen if Earth were orbiting in the HZ of an M star at the same relative location as for Earth
today. The limitations and uncertainties in our codes are discussed by Segura et al. (2003).
        There are, admittedly, some inconsistencies in the present study. Earth is thought to lie
near the inner edge of the Sun’s HZ, currently estimated to be located at ~0.95 AU (Kasting et
al., 1993). As discussed earlier, a planet farther out in the HZ would need a denser atmosphere
and a larger amount of CO2 or some other greenhouse gas to maintain a comparable surface
temperature in the presence of lower stellar flux. Unfortunately, such planets cannot be simulated
self-consistently with our present model because our long-wavelength (LW) radiative transfer
routine, from Mlawer et al. (1997), is valid only for a limited range of CO2 partial pressures
close to that of modern Earth. [Alternative long-wave radiative transfer algorithms that can
handle high CO2 concentrations, e.g., that of Pavlov et al. (2000), exist, but they do a poor job in
the Doppler region and, hence, yield inaccurate stratospheric temperature profiles.] So, we have

                                                                                                  5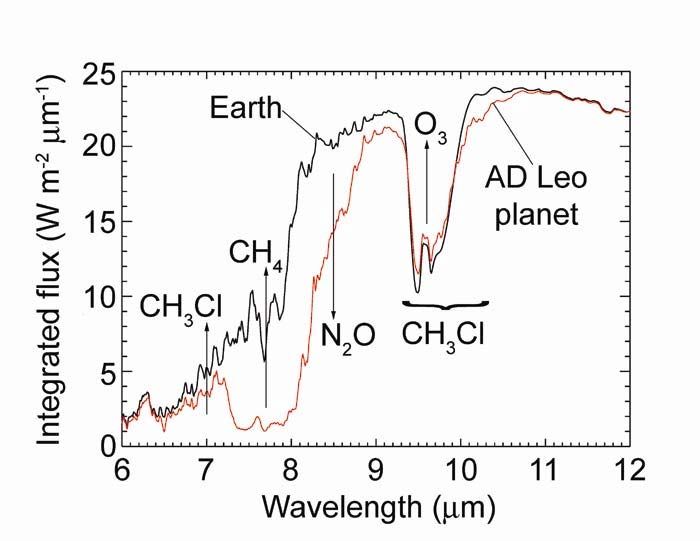
chosen to model low-CO2 planets similar to the low-CO2 planets studied previously around F-G-
K stars (Segura et al., 2003). CO2 has only a small influence on atmospheric photochemistry at 1
PAL O2, so the assumed position of the planet in the HZ should have little influence on our
results, other than its direct effect on the strength of the CO2 absorption bands. In high-CO2
atmospheres, the 9.4- and 10.4-µm CO2 bands can either shield or create a possible “false
positive” for the 9.6-µm O3 band, as pointed out by Selsis et al. (2002). Some sensitivity studies
on the effects of higher CO2 levels are described in the Discussion.
         We have also restricted our calculations to planets with Earth’s present O2 concentration,
whereas in our previous work we modeled atmospheres with as little as 105 PAL of O2. The
present calculations are intended to illustrate possibilities, as opposed to exhausting them. Low-
O2 atmospheres on M-star planets would be better studied with a time-dependent model that
captured the dangerously high surface radiation fields that should accompany stellar flares.
         The biogenic trace gases H2, CH4, N2O, CO, and CH3Cl were included in the
photochemical model with the same fixed surface fluxes we computed in our previous work
(Segura et al., 2003). These compounds were originally chosen because they are the more
abundant or active biogenic compounds in Earth’s present atmosphere. Methyl chloride, for
example, is the most abundant chlorine compound and has a direct effect on the tropospheric
ozone chemistry. Other biogenic compounds like ammonia or ethylene were not included in the
present code because their photochemical lifetimes are short and their spatial distribution is
restricted to the troposphere.
         The surface fluxes used for the biogenic compounds were those needed to produce their
observed mixing ratios in Earth’s present atmosphere: 1.31  1012 g of H2/year, 9.54  1014 g of
CH4/year, 1.32  1013 g of N2O/year, 2.35  1015 g of CO/year, and 7.29  1012 g of CH3Cl/year.
The negative sign on the H2 flux indicates that the calculated flux is downward, i.e., that the
surface is a net sink for H2. Most of these fluxes are somewhat higher than more accurate
estimates for surface fluxes, which reflects the relatively limited accuracy of our one-
dimensional photochemical model. [For example, the best estimate for the modern methane flux
is 535 Tg of CH4/year (Houghton et al., 1994), or about 40% lower than the value found here.]
Using these fluxes is equivalent to assuming that biological production of trace gases is exactly
the same as on Earth and that it is not affected by such things as changes in the surface UV flux.
This might not be realistic, but it is a logical first step in understanding possible biosignatures on
M-star planets and arguably more reasonable than assuming fixed mixing ratios, which would
imply systematic changes in biogenic production rates for each star examined. Using these
assumptions, the two models were iterated until their solutions converged. The resulting pressure
and temperature profiles, along with the calculated mixing ratios of H2O, O3, CO2, CH4, N2O,
and CH3Cl, were then introduced into a line-by-line radiative transfer model, SMART (the
Spectral Mapping Atmospheric Radiative Transfer model). SMART (Meadows and Crisp, 1996;
Crisp, 1997) was used to calculate a high-resolution spectrum of each planet for a solar zenith
angle of 60°, which approximates the average illumination observed in a planetary disk-average.
The radiances shown are the integrated upward fluxes over the hemisphere, divided by
steradians, to approximate the mean radiance seen in the disk-average.

Stellar data
        Spectra of M stars with complete wavelength coverage are hard to find. Most M dwarfs,
even strong dMe flare stars, emit UV fluxes below the limit of detection by space-borne UV
telescopes. Flares are easier to observe in the UV, but few, if any, observations have been

                                                                                                     6
synchronized to detect UV, visible, and near-IR emission so as to form a complete,
contemporaneous spectrum. Theoretical models for M-star photospheric emission are available,
but such models lack the chromospheric activity that is responsible for the emission of SW UV
radiation ( < 200 nm).
For this work, we compiled time-averaged spectra of the stars AD Leo and GJ 643. AD
Leo is an M4.5V star, effective temperature 3400 K (Leggett et al., 1996), located at a distance
of 4.9 pc from the Sun. This star is one of the most active M dwarfs, and it has been observed
over the entire spectral range, albeit during different stages of activity. The International
Ultraviolet Explorer (IUE) satellite acquired 114 separate spectra of AD Leo: 64 far-UV spectra
(115.1–179.7 nm; SW range) and 50 near-UV spectra (179.7–334.9 nm; LW range). The IUE
coverage includes the great flare of 1985 and its aftermath, as well as other epochs in which the
presence of strong emission lines signifies intense activity.
To represent the average quiescent spectrum of this star, we avoided all IUE spectra
showing obvious emission lines indicative of above-average chromospheric activity, and
combined subsets of 40 typical LW and 17 typical SW spectra. We first corrected all these IUE
spectra for known artifacts and problems of calibration (Massa et al., 1998) and then reprocessed
them using the software described by Massa and Fitzpatrick (2000).
The co-added SW and LW spectra were merged by multiplicative scaling in their region
of overlap, preferentially retaining the higher signal-to-noise SW portion. The integrated flux for
the AD Leo Lyman line, 9.97 10-12 ergs cm-2 s-1, was provided by Brian E. Wood (University
of Colorado, Denver) based on Hubble Space Telescope data. At the top of the planetary
atmosphere this flux is 3.9 102 ergs cm-2 s-1. The quiescent optical spectrum from 355.5 nm to
900 nm is from Pettersen and Hawley (1989). It was extended to 1012 nm using an independent
spectrum from Leggett et al. (1996), who also provide near-IR spectra in the J, H, and K
windows covering, respectively, 965.6–1354.5, 1437.5–1853.0, and 1995.2–2409.0 nm. The
photospheric emission beyond 2410 nm and into the far-IR was taken from a NextGen model
(Hauschildt et al., 1999) atmosphere (Teff = 3400 K, log g = 5.0, [Fe/H] = 0.0; see Leggett et al.,
1996). The model’s synthetic spectrum matches the observed continuum shapes in the JHK
windows, though the observed steam bands at the edges of these near-IR windows appear much
weaker than in the synthetic spectrum. These discrepancies account for our reliance on observed
IR spectra whenever these are available. The resulting complete spectrum was thus composed of
empirical IUE data below 335 nm, empirical optical and near-IR spectra from 335 to 2410 nm
(with small unobserved regions between the JHK windows), and a NextGen synthetic spectrum
longward of 2410 nm.
GJ 643 is an M3.5V star, Teff = 3200 K (Berriman et al., 1992), located 6.5 pc from the
Sun. The IUE archive contains 23 spectra. Our UV spectrum was constructed by co-adding all 13
usable SW spectra and five usable LW IUE spectra. In this case, the Lyman line was included
in the IUE observations (see the long line at the left of Fig. 1a) and has a total top-of-atmosphere
flux of 2.2 103 ergs cm-2 s-1. The merged IUE spectrum was combined with an observed red
optical spectrum (Henry et al., 1994) and with JHK near-IR spectra (Leggett et al., 2000). These
data were extended into the far-IR using a NextGen synthetic spectrum for 3100 K, log g = 5.0,
and [Fe/H] = -0.5 (Leggett et al., 2000).
Because M stars exhibit a large range in activity levels (see Discussion), it is also of interest to
examine the detectability of biosignatures for stars with very low levels of chromospheric and
coronal activity, the so-called "basal" M stars. Empirical UV spectra are available for only the
most active stars, so as extreme examples we have included a subsample of
7Figure 1. Normalized complete (a) and UV spectra (b) for two observed active M dwarfs, a synthetic inactive M star,
and for the Sun. Stellar fluxes were normalized in such a way as to produce a surface temperature similar to that on
present Earth (288 K).
8synthetic spectra using purely theoretical model atmosphere spectra, which have no
chromospheric emission at all. We selected models with effective temperatures of 3650, 3400,
and 3100 K, corresponding to main sequence stars of spectral types M1, M3, and M5,
respectively, according to the theoretical effective temperature scale of Allard et al. (1997). The
spectral type-effective temperature scale remains uncertain for M stars (Leggett et al., 1996; see
Jones et al., 2005 and references therein), so the spectral types could be different by one to two
spectral subclasses on observed M dwarfs. All of the stars are assumed to have solar metallicity.
The non-active model stars were taken from the BaSeL website (www.astro.mat.uc.pt/BaSeL/).
The surface Lyman flux of the M dwarfs is on the order of 106 ergs cm-2 s-1 (Doyle et al.,
1990). This value was scaled for all the planets around model stars, which resulted in a total top-
of-atmosphere flux of 2.3 10-3 ergs cm-2 s-1 for the M5, 1.6 10-3 ergs cm-2 s-1 for the M3, and
1.2 10-3 ergs cm-2 s-1 for the M1.
These models are interpolations in frequency and altitude of the NextGen cool star model
atmospheres developed by Allard et al. (1997) and should be similar to the Hauschildt et al.
(1999) model grids. They are notable for their inclusion of tens of millions of molecular and
atomic lines in the opacity function. These models compute spectra all the way from the IR down
to the far UV, but they treat only the photospheric emission; hence, no chromospheric UV flux is
calculated by these models. (This is clear in Fig. 1b: The active M stars exhibit strong UV fluxes,
while the model M dwarf emits almost no UV radiation shortward of 250–300 nm.)
RESULTS
The stellar flux received for each Earth-like planet around one of these stars was
calculated by normalizing the full wavelength range stellar spectra so as to produce a mean
planetary surface temperature of 288 K, as described above. As a result of this normalization,
we obtained the stellar fluxes at the top of each planet atmosphere, which are shown in Fig. 1.
The fluxes used by Segura et al. (2003) for the Earth around the Sun, an F2V star, and a K2V
star are included for comparison. The normalization takes into account the different albedo that
Earth would have for different wavelength distributions of incident radiation (Kasting et al.,
1993). For these M stars, the albedo correction (Afac) was 0.9, i.e., the normalized flux was
reduced by this factor to compensate for the greater absorption of redder stellar radiation by the
planet's atmosphere. The final distances of these planets from their parent stars was calculated
from r = 1 AU [(L/L)/Afac]1/2 and are presented in Table 1.
Figure 1b shows the estimated UV flux from the M stars and from the F-G-K stars studied
earlier. According to these data, the two observed M stars outshine the Sun (in a time-averaged
sense) at wavelengths shorter than ~190 nm (GJ 643) or ~170 nm (AD Leo). By contrast, for 200
nm < < 350 nm, the Sun outshines the M stars by a factor of ~100. This is important to the
discussion of ozone/methane photochemistry that follows. The non-active (model) M star
exhibits almost no UV flux shortward of 250 nm. As the cutoff for O2 photolysis is below this
wavelength (Fig. 2), one can expect that a planet around such a star should have a much thinner
ozone layer than does Earth. This result was anticipated by W.R. Sheldon in a poster presented
at a Gordon Conference during the early 1990s, and the idea was first explored numerically in a
paper that he co-authored several years later (Kasting et al., 1997).
9Figure 2. Absorption coefficients of O2, O3 , N2O and CH4 as a function of wavelength Compiled by Mark Allen
(JPL/Caltech). O2: Kirby et al (1979); Watanabe (1985); Ackerman (1971); Kley (1984); Hudson (1974). O3 :
Denmore et al. (1990). N2O: Denmore et al. (1990). CH4 : De Reilhac and Damany (1997); Backx et al. (1975); Lee
et al. (1997); Lee and Chiang (1983); Mount et al. (1997); Mount and Mood (1978).
10Spectral signatures from planets are produced in the visible via interactions of the planetary
atmosphere and surface with the reflected radiation from the parent star. In the MIR, these
features are produced when emitted surface and atmospheric thermal radiation interacts with the
atmosphere as it escapes to space. Consequently, at visible wavelengths the detectability of a
spectral feature is relatively insensitive to temperature and influenced primarily by the column-
integrated abundance of a given constituent in the atmosphere. However, in the case of the MIR,
the observed features depend not only on the concentrations and vertical distribution of the
components of the planet's atmosphere, but on the vertical temperature profile as well. Figure 3
shows the temperature, ozone, and water vapor profiles of Earth-like planets circling the active
M stars and the Sun. The results of the non-active M-star planets are not shown on these graphics
because their atmospheres are not able to reach equilibrium given the biogenic fluxes we have
used in the model. The reason for this behavior will be explained later in this section.
Although the active M-star planets in our sample exhibit ozone layers that are
comparable to that on Earth (Table 2 and Fig. 3b), their stratospheres are cooler than that of
present Earth (Fig. 3a). This is due primarily to the lower near-UV fluxes received by the M-star
planets. Indeed, the planet circling GJ 643 has an ozone layer that is 50% thicker than Earth's.
This result is expected, as both stars emit much UV radiation shortward of 200 nm, which is
capable of dissociating O2, thereby forming O3. The high water vapor abundances in the upper
stratospheres of the active M-star planets (Fig. 3c) are a consequence of their high methane
concentrations. Methane is oxidized in the stratosphere by the (net) reaction: CH4 + 2 O2
CO2 + 2 H2O. Thus, each CH4 molecule that is oxidized results in the production of 2 H2O
molecules. Despite the high water vapor abundances in the stratosphere, H2O remains well above
condensation values in all cases, so stratospheric clouds should not be present.
In Earth’s present atmosphere, the biogenic compounds methyl chloride (CH3Cl), N2O,
and CH4 are present in small concentrations (0.5 ppbv, 0.3 ppmv, and 1.7 ppmv, respectively).
However, on planets around M stars, their concentrations could conceivably be much larger.
Other biogenic trace gases might be more abundant as well, but these are the only ones that we
have studied. Figure 4 shows calculated vertical mixing ratio profiles for N2O, CH4, and CH3Cl
for Earth and for the active M-star planets. The results for N2O are what one might expect, given
that this gas photolyzes at wavelengths shorter than 220 nm (Fig. 2). The N2O concentration for
the active M-star planets increases over the Earth’s current concentration by a factor of 3, which
puts it at ~1 ppmv. N2O concentrations of this magnitude will likely still be difficult to detect
with missions like TPF or Darwin, except for stars in which the UV chromospheric emission is
far below the levels in strong flare stars. As explained in the next section, it is possible that most
M dwarfs fall into this category.
The results for CH4 are surprising: The active M-star planets have concentrations exceeding 300
ppmv—an increase by nearly a factor of 200 relative to present Earth. This behavior can be
explained by the effect that the M star spectral energy distribution has on the photochemical
removal of CH4. In high-O2 atmospheres like Earth’s, photolysis of methane (requiring < 145
nm) is slow, so the high far-UV flux from M stars has little effect on its abundance. Instead,
methane is destroyed mainly by the same photochemical reaction sequence that is important in
Earth’s troposphere today:
11Figure 3. Model results for a planet like Earth around two active M dwarfs and the Sun:
(a) temperature, (b) ozone number densities, and (c) water mixing ratios.
12O3 + h ( < 310 nm) O2 + O(1D)
O(1D) + H2O 2 OH
CH4 + OH CH3 + H2O
CH3 + O2 + M CH3O2 + M … CO (or CO2) + H2O
This reaction sequence takes place throughout the troposphere and lower stratosphere. Most of
the photons that create O(1D) in Earth’s lower atmosphere are at wavelengths between 200 nm
and 310 nm, as O2 absorbs wavelengths shorter than 200 nm high up in the stratosphere or
mesosphere.
As we saw earlier, M dwarfs emit very little UV radiation at wavelengths between 200
nm and 300 nm (see Fig. 1b). Active M stars emit lots of shorter-wavelength UV radiation, but
these photons are used primarily to dissociate O2, as both its absorption coefficient and
concentration are higher than those of other atmospheric gases (Figs. 2 and 4). Consequently,
little O(1D) is produced in the atmospheres of our M-dwarf planets, and the predicted
tropospheric concentrations of the hydroxyl radical, OH•, are lower by a factor of 105 than they
are on Earth (~1 cm-3 compared with ~106 cm-3). Thus, instead of having a photochemical
lifetime of 10–12 years (Houghton et al., 1994), as on Earth, CH4 has a predicted lifetime of
about 200 years on an M-star planet. The lifetime of methane is not simply inversely
proportional to [OH], as methane can diffuse upward through the atmosphere to altitudes where
more UV photons and more OH are available. This is calculated, though, in our photochemical
model. In the troposphere, OH is the major sink of methyl chloride, as well. Because of the
reduced concentration of OH on the M-star planets, the concentration of CH3Cl increases
dramatically compared with the terrestrial value (Fig. 4c).
The synthetic planetary spectra for Earth-like planets in orbit around M stars clearly show
the effect of the different stellar spectral energy distributions. This is apparent in both the visible
and MIR spectra. For the planet orbiting AD Leo [and GJ 643(data not shown)], ozone and
methane have strong absorption features in the MIR (9.6 µm and 7.7 µm, respectively) (Figs. 5
and 6), with the O3 feature being of comparable strength to Earth’s. In contrast, the CH4 feature
is far stronger for the AD Leo planet than for Earth, as a consequence of the much higher CH4
concentration. Interestingly, methyl chloride, which has spectral features in the MIR in the range
6.5–7.5, 9.3–10.3, and 13–14.8 µm, is also seen in the AD Leo planet spectrum, where it is
relatively easy to detect, compared with the Earth spectrum.
Figure 7 shows the comparison of the Earth and the AD Leo planet with and without methyl
chloride to illustrate the effect of methyl chloride in the spectra of the AD Leo planet. It can be
seen that the CH3Cl feature at 9.3–10.3 µm coincides with the O3 9.6-µm band, and acts to
enhance and broaden the absorption feature associated with the O3 band at 9.6 µm. Methyl
chloride absorption is also seen strongly in the 13–15 µm region, and a weaker feature can be
discerned near 7 µm. The CH3Cl modification of the strength of the 9.6-µm ozone band could be
mistakenly used to infer higher O2 levels. To guard against this misinterpretation, it would be
necessary to look for the 13–15-µm CH3Cl absorption feature as well. However, the 13–15-µm
feature also extensively modifies the SW profile of the CO2 band, and could introduce errors in
the interpretation of the atmospheric temperature profile using the CO2 band. SEGURA ET AL:
Planets around M stars
13Figure 4. Vertical mixing ratios of the biogenic gases (a) N2O, (b) CH4 and (c) CH3 Cl for Earth-like planets around
two M dwarfs and for Earth itself. Planets are identified by their parent stars. For Earth, the surface mixing ratios of
the gases are fixed at their observed values. For the M-star planets, the surface flux is fixed at the value calculated for
Earth.
14Figure 7. IR spectra from an Earth-like planet around AD Leo with CH3 Cl (red) and without CH3 Cl (blue). The
spectrum from Earth is shown for comparison (black).
15On Earth, 60% of the sources of CH3Cl are unknown, while the known sources come from biological and human activity. These include tropical forests (Yokuchi et al., 2002), biomass burning, planktonic algae (Harper et al., 2003), and degradation of organic matter in soils (Keppler et al., 2000). Other human activities, such as the incineration of municipal and industrial wastes, are relatively minor sources (
Figure 5. a) Complete IR spectra (5 to 25 m) for Earth-like planets around the Sun (black) and AD Leo (red). b)
Brightness spectra for the same planets.
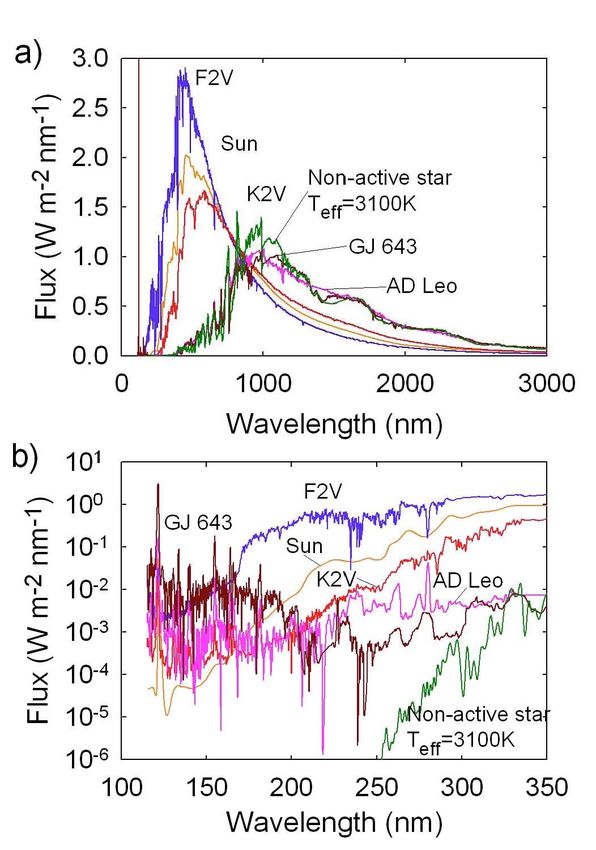
17Figure 8. Complete visible/near IR spectra (0.5-1.5 m): a) Spectra for Earth-like planets around the Sun (black),
AD Leo (red) b) Reflected spectra for the same planets. Black--Earth; red--AD Leo planet.
18To get around this problem, we changed the lower boundary condition for methane in the
photochemical model from a fixed flux to a fixed mixing ratio of 5 10-4 (500 ppmv). This value
is approximately what would be maintained if volcanoes produced the same amount of reduced
gases as on Earth and hydrogen escaped with the diffusion-limited rate (Hunten, 1973; Walker,
1977; Kasting and Catling, 2003). (This would entail some high-altitude breakdown of CH4 into
H2 or H that is not explicitly included in the model.) We also changed the lower boundary
conditions for H2 and CO to fixed deposition velocities of 2.4 10-4 cm/s and 1.2 10-4 cm/s,
respectively. These values correspond to maximum air–sea transfer rates estimated using the
“piston velocity” approach (Broecker and Peng, 1982; P. Kharecha et al., manuscript in
preparation). (If this assumption is not made, then H2 and CO can also “run away” in these
model atmospheres.) Given these boundary conditions, the methane flux necessary to sustain 500
ppmv of methane is 9.4 1014 g/year (99% of our present Earth value) for the planet around the
hottest star (Teff = 3650 K), 5.5 1014 g/year (57% of the Earth value) for the planet around the
star with Teff = 3400 K, and 2 1014 g/year (21% of the Earth value) for the coolest star of our
sample (Teff = 3100 K). High mixing ratios of N2O and CH3Cl were also obtained for all the
quiescent stars (Fig. 9). Non-active stars have less CH3Cl than active stars because the OH
abundance on the quiescent M stars ranges from 102 to 103 molecules/cm3, while the active stars
have ~1 molecule of OH/cm3.
The intriguing implication of these results is that the simultaneous detection of O2 (or O3)
and CH4, N2O, or CH3Cl in a distant planetary atmosphere may be significantly easier for Earth-
like planets orbiting M stars than for an Earth-like planet around a star like our Sun. This
detection would be most easily accomplished in the thermal-IR, where the strong 7.7-µm CH4
band and 9.6-µm O3 band are clearly visible in our simulated spectra (Fig. 6). The simultaneous
detection of O2 and methane might also be possible in the visible/near-IR as well using the 0.76-
µm O2 band and either the 1.0-µm or the stronger, and likely more detectable, 1.2-µm CH4 band.
Lovelock (1965) suggested many years ago that the simultaneous presence of O2 and a reduced
gas such as N2O or CH4 would constitute the strongest possible spectroscopic evidence for life.
[Lederberg (1965) had made a similar argument about thermodynamic disequilibrium as
evidence for life without specifying the nature of the compounds to be observed.] Thus, despite
the caveats to M-star planet habitability raised in the Introduction, the potential enhanced
detectability of these atmospheric biosignatures for planets around M stars may prompt architects
of future planet detection and characterization missions to include M stars as targets.
As mentioned previously, a planet near the outer edge of the HZ would require more CO2 to
remain habitable. To test the effect of such a change, we repeated our photochemical calculations
using a CO2 concentration of 3.35% (100 PAL). (We did not do a coupled climate model
calculation, as we are assuming that this CO2 increase would be accompanied by a decrease in
the incident stellar flux.) The result for the AD Leo planet was to increase the amount of methane
and methyl chloride in the planet’s atmosphere by ~30%. This may happen because the excess
CO produced from CO2 photolysis reacts with OH, which makes the latter species even less
abundant than before (and, hence, increase the lifetime of methane and methyl chloride). The
concentration of N2O is not affected by the increase of CO2. Surprisingly, the same calculation
for the Earth itself, and for an Earth-like planet around a K2V star (epsilon Eridani), yields a
small (Figure 6. Close-up IR spectra from 6 m to 12 m: Black--Earth; red--AD Leo planet.
20Figure 9. Vertical mixing ratios of the biogenic gases (a) N2O and (b) CH3 Cl for Earth-like planets around quiescent
M dwarfs and for Earth itself. Planets are identified by the effective temperature of their parent stars. For Earth, the
surface mixing ratios of the gases are fixed at their observed values. For the quiescent M-star planets the boundary
-4
conditions
-4
were: fixed CH 4 mixing ratio (500 ppmv), fixed deposition velocities for H2 (2.4•10 cm/s) and CO
(1.210 cm/s) and fixed surface flux for methyl chloride and nitrous oxide.
21Figure 10. Incident (dashed lines) and surface (solid lines) UV fluxes for Earth-like planets around M dwarfs and
around the Sun.
22nm radiation, so their tropospheric chemistry is entirely different.) We conclude that changes in
CO2 concentration would only increase the potential for simultaneous observation of CH3Cl,
CH4, and O2.
Surface UV fluxes on Earth-like planets around M dwarfs
The presence of ozone in a planetary atmosphere is not only relevant to the remote
detection of life, but also provides a shield against UV radiation that can damage the cells and
DNA of organisms. Our photochemical model predicts surface UV fluxes and, hence, can be
used to estimate biological damage. For this purpose, the near-UV spectrum is traditionally
divided into three ranges. On Earth’s surface, we are well protected from radiation at
wavelengths shorter than 280 nm (known as UV-C); therefore, most of the research has been
done in the UV-B (280–315 nm) and UV-A (315–400 nm) ranges.
As shown in our previous work (Segura et al., 2003), a thick ozone layer can prevent
harmful UV radiation from reaching the surface of a planet even when the stellar flux in this
spectral region is an order of magnitude larger than that of the Sun. Hence, it is not surprising
that on the planets around AD Leo and GJ 643 the ozone layer blocks most of the incident UV
radiation (Table 3 and Fig. 10). In contrast, the quiescent M-star planets have ozone column
densities less than 40% of that of Earth (Table 2). This is enough to effectively shield the surface
of the planet from UV. The surface UV-B flux for planets around these stars is less than 2% of
the Earth value. For the whole UV range (200–400 nm), the surface UV flux is 20 times lower
than the UV flux that reaches the Earth surface (Table 3).
The surface UV fluxes alone are not a direct measure of the magnitude and type of
damage that this radiation can cause to living organisms. To estimate this, it is necessary to use
action spectra that describe the relative effectiveness of different wavelengths in inducing
damage. UV dose rates were calculated by convolving the surface UV fluxes with an action
spectrum for DNA damage (Van Baalen and O'Donnel, 1972). We realize that action spectra
vary depending on the type of DNA lesion (e.g., dimer production vs. double strand breaks) and
environmental conditions. [See Jagger (1985) for action spectra and Sinha and Hader (2002) for
a concise review of UV-induced DNA damage and various repair pathways.] Thus, our
calculated surface biological doses should be considered illustrative. Use of other action spectra
to assess the UV damage and mutation rates on habitable planets is deferred to future work. The
results were normalized to the damage received on Earth (Table 4). M-star planets would be safe
places to live from a UV standpoint. One might wonder, though, whether the lower UV dose
rates might slow mutation rates and, hence, hinder biological evolution.
DISCUSSION AND EXTENSIONS
M dwarf activity levels and implications for possible biosignatures
The theoretical model M-star synthetic spectra represent an absolute minimum (zero) in
terms of chromospheric UV emission. However, the two actual stars whose spectra we have
used, AD Leo and GJ 643, may represent an upper limit, as the reason UV spectra are available
for them is precisely because of their extremely high (AD Leo) or high (GJ 643) activity levels.
The distribution of M stars between these two extremes is obviously important in assessing the
applicability of our results to specific target stars in the future. Although we do not have UV
fluxes for many M stars, we can examine the distributions of chromospheric and coronal proxies
for near-UV chromospheric emission, namely, H and CaII H & K emission in the visible, MgII
h & k emission in the near UV, and soft x-ray emission.
23First, we consider the fraction of M stars that are chromospherically active according to
some criteria. West et al. (2004) used a large sample of nearly 8,000 M0 to L0 stars from the
Sloan Digital Sky Survey to quantify the activity level, as measured by the ratio of H to
bolometric luminosity, as a function of spectral type. With their criteria for activity (e.g., the H
equivalent width must be >1.0 Å), they found that only about 24% of these stars were classified
as active, with the active fraction increasing from near zero at M0 to 50% at M5, and peaking at
about 75% at M8. These results evidently do not depend strongly on the sensitivity limit, as
demonstrated by the similar results obtained by Mohanty and Basri (2003), who studied a much
smaller sample of stars later than M4 with a sensitivity limit of about 0.2 Å for H equivalent
width.
We also considered various measures of spread among activity indicators, for active star
samples and for stars with the weakest activity indicators. West et al. (2004) found that LH/Lbol
varied by over two orders of magnitude among the active stars, with the variation being about an
order of magnitude at a given spectral type. A similarly large spread was found by Mohanty and
Basri (2003) for their sample of M4 to L6 dwarfs. Considering the large fraction of inactive stars
(which will have smaller but unknown values of LH/Lbol) and the spread among the active stars,
this measure of chromospheric emission could vary by at least three orders of magnitude among
all M stars. The same could be true of the UV flux in the HZ (since LH/Lbol and LUV/Lbol do not
depend on distance from the star), assuming that H and UV fluxes are correlated.
The soft x-ray luminosity measured by the ROSAT satellite is a measure of coronal
activity and known to be correlated with chromospheric activity indicators. The ratio LX/Lbol
given for over a hundred K and M stars within 7 pc by Fleming et al. (1998) shows a range of
over three orders of magnitude. An enlargement of the sample to include several hundred K-M
stars using Hipparcos distances and a somewhat revised bolometric correction scale gives a
similar result (J.S., unpublished data). Indeed, the average value of LX/Lbol for about a hundred M
stars in common with the UV Ceti (flare, or emission) star catalogue of Gershberg et al. (1999) is
nearly two orders of magnitude larger than the average ratio for non-active M stars. This result is
consistent with a number of specific cases, such as the values of stellar surface x-ray fluxes and
other activity indicators for AD Leo and two relatively inactive stars (Gl 588 and Gl 628) given
by Mauas et al. (1997).
The study of IUE Mg II h & k line (~280 nm) fluxes in a sample of K and M stars by
Mathioudakis and Doyle (1992) showed a spread of two orders of magnitude in this flux, even
among active dMe stars. We have not carried out a comparison of M stars detected in the four
bands of the Extreme Ultraviolet Explorer (EUVE) satellite, whose centroid wavelengths vary
from 20 to 62 nm (Bowyer et al., 1994), as only the most active stars were detected. (See the
large upper limits for candidate low-activity stars given by Mathioudakis et al., 1994.)
We can also give a more specific and quantitative estimate of the expected range by
comparing the stars with the largest and smallest activity. Main sequence stars with the lowest,
or undetectable, levels of activity are usually referred to as “basal stars,” and the result that there
is a lower limit to chromospheric activity at a given color has been known for decades (e.g.,
Wilson, 1968; Cram and Mullan, 1979). The basal level is often attributed to residual heating by
acoustic dissipation in stars whose magnetic activity is very low. We have taken Ca II, Mg II
fluxes for candidate basal stars from Mathioudakis et al. (1994), Doyle et al. (1994), and Mauas
et al. (1997), and LX/Lbol for these same stars from Fleming et al. (1995). We compared the
average values with the corresponding average values for the flare stars AD Leo, AX Mic, AU
Mic, EQ Peg, and YZ CMi given by Houdebine et al. (1996), adopting AD Leo data as given by
24Mauas et al. (1997). (We omit BY Dra, as its activity is due to its close binary nature, and
Proxima Cen because it is a relatively weak active star, as measured by flare amplitudes, x-ray
flux, or any chromospheric indicator.)
For the basal stars, lower limits were included in the averages. We find that the average
Ca II and Mg II fluxes (in erg cm-2 s-1) are 1.6 104 and 3.4 104, respectively, for the candidate
basal stars, while for the flare stars the average fluxes are 7.9 105 and 9.2 105. For the
average values of log (LX/Lbol) we find –5.0 for the three candidate basal stars with available data
and –3.7 for four of the flare stars; the latter number becomes –3.1 if the weak flare star AX Mic
is excluded from the sample. By comparison, the nearest M star, Proxima Cen, has
chromospheric fluxes intermediate between the basal stars and strong flare stars, and very small
log (LX/Lbol) = –5.5, while AD Leo is near the maximum for all activity indicators.
We conclude that, although observations in the 200–300 nm region are not available for
any but the few most active M stars, H (visual), X-ray, Ca II (visual), and Mg II (UV) proxies
for the UV chromospheric continuum all suggest that a range in overall flux level of two to three
orders of magnitude should be expected in this wavelength range, with AD Leo near the
maximum observed. This variation should be borne in mind when considering those of our
results that depend sensitively on the UV flux (e.g., ozone column depth, N2O band strength,
surface UV-C flux, and surface UV doses for biological damage). We are hopeful that future UV
satellite observations will provide near-UV spectra for nearby less-active stars. Unfortunately,
the known candidate basal stars are more distant than about 8 pc. The nearest star, Proxima Cen,
which is intermediate between basal and highly active stars, seems like a promising target.
Impact of M dwarf variability on possible biosignatures
The results found here are promising in that they suggest that, with sufficient wavelength
coverage, Earth-like biosignatures may be as detectable, if not more detectable on habitable
planets around M stars, than for the Earth itself. But, the presence and detectability of these
biosignatures could be affected by the time variability of these host stars. As mentioned earlier,
flare activity on M stars can last from a few seconds to minutes, or even hours. For AD Leo, a
flare with an energy of 3 1032 ergs in the B-band (centered at 440 nm) occurs every 4 days
(Fig. 5 in Gershberg, 1989). By comparison, solar flares with this frequency emit no more than
1029 ergs on the same band. During the great AD Leo flare observed in 1985 (Hawley and
Pettersen, 1991), 7.1 1032 ergs were emitted in the 120–326 nm wavelength range in an
impulsive phase that lasted 25 min (Table 6 in Hawley and Pettersen, 1991). This implies that an
Earth-like planet in the HZ would have received an additional 30.3 W/m2 during this flare stage,
or about 1/10th of the average total stellar output. The impulsive phase of this flare was followed
by a gradual phase that lasted almost 4 h. During this period, the planet would have received an
additional 0.25 W/m2 in this wavelength range. A planetary atmosphere subjected to these flux
variations with these intensities may never reach a true steady state. Without performing such a
simulation, it is unclear how this time variability would affect the abundances of biosignature
gases such as O3 and CH4.
CONCLUSIONS
We have calculated atmospheric biosignature concentrations, and generated synthetic
visible/near-IR and thermal-IR spectra for Earth-like planets circling active and quiescent M
dwarfs. The atmospheres of the quiescent M-star planets may not be stable if methane or carbon
monoxide fluxes are similar to those on Earth because the photochemical sink for these
25compounds is much smaller because of the low incident UV flux. Predicted concentrations of
methane, nitrous oxide, and methyl chloride are higher for the M-star planets than for Earth, and
these compounds are more detectable on those planets. The planets around the active M stars
developed ozone layers similar to that on Earth. Thus, the signature of O3 from habitable planets
around active M dwarfs, along with the signatures of various reduced gases, may be detectable
with instruments like TPF or Darwin. The simultaneous detection of O2 or O3 and N2O, CH4, or
CH3Cl in the atmosphere of an M-star (or other extrasolar) planet would provide convincing
evidence for the existence of extraterrestrial life.
The surfaces of M-star planets also appear to be relatively well shielded from stellar UV
radiation, even for the planets circling non-active stars where there is a thinner ozone layer to
shield the planetary surface. Thus, the possibility of life on such planets should not be ruled out
for this reason.
ACKNOWLEDGMENTS
This material is based upon work performed by the NASA Astrobiology Institute’s
Virtual Planetary Laboratory Lead Team, supported by the National Aeronautics and Space
Administration through the NASA Astrobiology Institute under Cooperative Agreement Number
CAN-00-OSS-01. M.C. thanks NASA for supporting his participation in this work through JPL
contract 1234394 and NASA grant NNG04GL49G with the University of California, Berkeley.
J.S. acknowledges the support of the NASA Exobiology Program, grant NNG04GK43G. J.F.K.
also acknowledges the International Space Science Institute (ISSI) and the support from NASA’s
Exobiology and Astrobiology Programs. We thank Suzanne Hawley for helpful discussions
about M dwarfs and the referees for their valuable suggestions.
ABBREVIATIONS
HZ, habitable zone; IR, infrared; IUE, International Ultraviolet Explorer; LW, long-
wavelength; MIR, mid-infrared; PAL, present atmospheric level; PAR, photosynthetically active
radiation; SMART, Spectral Mapping Atmospheric Radiative Transfer; SW, short-wavelength;
TPF, Terrestrial Planet Finder; UV, ultraviolet.
REFERENCES
Ackerman, M. (1971) Ultraviolet solar radiation related to mesospheric processes. In
Mesospheric Models and Related Experiments, edited by G. Fiocco, Springer-Verlag,
New York, pp. 149–159.
Allard, F., Hauschildt, P.H., Alexander, D.R., and Starrfield, S. (1997) Model atmospheres of
very low mass stars and brown dwarfs. Annu. Rev. Astron. Astrophys. 35, 137–177.
Angel, J.R.P. and Woolf, N.J. (1996) Searching for life on other planets. Sci. Am. 274(4), 60–66.
Audard, M., Güdel, M., Drake, J.J., and Kashyap, V.I. (2000) Extreme-ultraviolet flare activity
in late-type stars. Astrophys. J. 541, 396–409.
Backx, C., Wight, G.R., Tol, R.R., and Van der Wiel, M.J. (1975) Electro-electron coincidence
measurements of CH4. J. Phys. B Atom. Mol. Phys. 8, 3007–3019.
Berriman, G., Reid, N., and Leggett, S.K. (1992) Effective temperatures of M dwarfs. Astrophys.
J. 392, L31–L32.
Bowyer, S., Lieu, R., Lampton, M., Lewis, J., Wu, X., Drake, J. J., and Malina, R. F. (1994) The
first Extreme Ultraviolet Explorer source catalog. Astrophys. J. Suppl. Ser. 93, 569-587.
26You can also read