AUTOMATED, FLOW-BASED CHEMILUMINESCENCE MICROARRAY IMMUNOASSAY FOR THE RAPID MULTIPLEX DETECTION OF IGG ANTIBODIES TO SARS-COV-2 IN HUMAN SERUM ...
←
→
Page content transcription
If your browser does not render page correctly, please read the page content below
Analytical and Bioanalytical Chemistry
https://doi.org/10.1007/s00216-021-03315-6

    RESEARCH PAPER

Automated, flow-based chemiluminescence microarray
immunoassay for the rapid multiplex detection of IgG antibodies
to SARS-CoV-2 in human serum and plasma (CoVRapid CL-MIA)
Julia Klüpfel 1 & Rosa Carolina Koros 1 & Kerstin Dehne 2 & Martin Ungerer 2 & Silvia Würstle 1 & Josef Mautner 3,4 &
Martin Feuerherd 4 & Ulrike Protzer 4,5 & Oliver Hayden 6 & Martin Elsner 1 & Michael Seidel 1

Received: 4 February 2021 / Revised: 10 March 2021 / Accepted: 26 March 2021
# The Author(s) 2021

Abstract
In the face of the COVID-19 pandemic, the need for rapid serological tests that allow multiplexing emerged, as antibody
seropositivity can instruct about individual immunity after an infection with SARS-CoV-2 or after vaccination. As many
commercial antibody tests are either time-consuming or tend to produce false negative or false positive results when only one
antigen is considered, we developed an automated, flow-based chemiluminescence microarray immunoassay (CL-MIA) that
allows for the detection of IgG antibodies to SARS-CoV-2 receptor-binding domain (RBD), spike protein (S1 fragment), and
nucleocapsid protein (N) in human serum and plasma in less than 8 min. The CoVRapid CL-MIA was tested with a set of 65
SARS-CoV-2 serology positive or negative samples, resulting in 100% diagnostic specificity and 100% diagnostic sensitivity,
thus even outcompeting commercial tests run on the same sample set. Additionally, the prospect of future quantitative assess-
ments (i.e., quantifying the level of antibodies) was demonstrated. Due to the fully automated process, the test can easily be
operated in hospitals, medical practices, or vaccination centers, offering a valuable tool for COVID-19 serosurveillance.

Keywords SARS-CoV-2 . COVID-19 serology . Flow-based chemiluminescence microarray immunoassay . Rapid multiplex
antibody detection . Automated analysis platform

                                                                               Introduction
Published in the topical collection Recent Trends in (Bio) Analytical
Chemistry with guest editors Antje J. Baeumner and Günter Gauglitz.
                                                                               The global COVID-19 pandemic has kept the world in sus-
* Michael Seidel
                                                                               pense for about a year now. The first cases of the novel coro-
  michael.seidel@mytum.de                                                      navirus infection were reported in Wuhan, China, in
                                                                               December 2019 and assigned to the respective pathogen in
1
     Institute of Hydrochemistry, Chair of Analytical Chemistry and            January 2020 [1]. Since then, worldwide more than
     Water Chemistry, Technical University of Munich,                          90,000,000 people were infected with over 1,900,000 deaths
     Elisabeth-Winterhalter-Weg 6, 81377 Munich, Germany
                                                                               resulting from COVID-19 (as of January 2021) [2].
2
     ISAR Bioscience GmbH, Semmelweisstr. 5,                                      The causative agent, SARS-CoV-2, is a betacoronavirus
     82152 Planegg, Germany
                                                                               that is related to other zoonotic coronaviruses that circulate
3
     Helmholtz Zentrum München, German Research Center for                     worldwide, causing common colds. SARS-CoV-2 has a large
     Environmental Health, Haematologikum, Research Unit Gene
     Vectors and Technical University of Munich, Children’s Hospital,
                                                                               RNA genome, encoding for a number of structural proteins,
     Marchioninistraße 25, 81377 Munich, Germany                               namely the spike glycoprotein (S), the nucleocapsid protein
4
     Institute of Virology, Technical University of Munich / Helmholtz
                                                                               (N), the membrane glycoprotein (M), and the envelope protein
     Zentrum München, Trogerstr. 30, 81675 Munich, Germany                     (E). Posttranslational modifications are essential for most of
5
     German Center for Infection Research (DZIF), Munich partner site,
                                                                               the proteins like the glycosylated membrane proteins and the
     81675 Munich, Germany                                                     phosphorylated N protein, which binds to viral genomic RNA
6
     Heinz-Nixdorf-Chair for Biomedical Electronics, Technical
                                                                               [3]. In the course of a SARS-CoV-2 infection, the body reacts
     University of Munich, TranslaTUM, Einsteinstr. 25,                        with the production of antibodies to a variety of these proteins,
     81675 Munich, Germany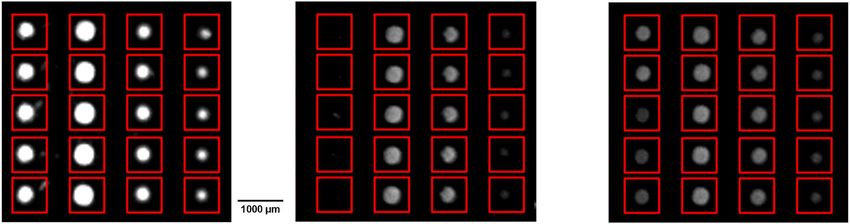
Klüpfel J. et al.

starting with IgM antibodies followed by the longer lasting          modifications that are also present in antigens in infected hu-
IgG antibodies that can be found in the blood for several            man cells. A very specific kind of tests that is often used when
months after an infection. A very relevant factor in the body’s      quantitative high-throughput analysis is desired is ELISA tests
battle against the infection—and also for later immunity—is          (Fig. 1b). Here, antigen (often denatured) is adsorbed to wells
antibodies to the S protein, especially the receptor-binding         and sample as well as labelled antibody and substrate are
domain (RBD) located in the S1 fragment. This domain binds           incubated within the wells. Therefore, many manual steps
to the human angiotensin-converting enzyme 2 (ACE2) and              are necessary that might give rise to errors and prevent in-
subsequently leads to the entry of the virus into the cell [4]. To   field applications, as extensive and expensive laboratory
assess whether an individual already underwent a SARS-               equipment is necessary. Additionally, since equilibrium con-
CoV-2 infection and, hence, might be immune to reinfection           ditions must be established, incubation times of usually sev-
due to protective antibodies, antibody tests are a helpful tool.     eral hours are needed prior to readout. Finally, only antibodies
    But these tests are not only relevant in context of previous     to one single antigen can be detected, meaning that false neg-
infections. Since the emergence of SARS-CoV-2, a number of           ative results would be obtained if patients formed antibodies
potential vaccine candidates have been developed [4] with the        to a different antigen that is not tested for [11]. This problem is
first ones already being applied [5]. Here, antibody tests might     overcome by microarrays that allow for multiplex analysis of
be helpful in testing the efficiency and the duration of immu-       various antigens, usually within hours [12]. Table 1 shows a
nity after vaccination. In addition, announcements have al-          comparative overview over different commercial SARS-CoV-
ready been made (for example, by airlines) that access to cer-       2 antibody tests with respect to assay principle, assay time,
tain locations and activities might be coupled to a proof of         tested antigens, and test performance. As is obvious from the
SARS-CoV-2 immunity. Here, rapid on-site antibody tests              information in Table 1, our CoVRapid test compares favor-
will be beneficial.                                                  ably and presents novelty in terms of work expenditure, mul-
    Therefore, we developed a chemiluminescence microarray           tiplex capability, and assay time. Analysis is accomplished in
immunoassay (CL-MIA) chip for the rapid, flow-based anal-            a fully automated manner within 8 min giving information
ysis of IgG antibodies to three different SARS-CoV-2 anti-           about antibodies to three different SARS-CoV-2 antigens si-
gens—RBD, S1, and the N protein—in human serum and                   multaneously. The respective antigens are covalently
plasma in a fully automated analysis device, the Microarray          immobilized in their native state using established coupling
Chip Reader 3. This device has previously been used for dif-         chemistry that can easily be applied to other proteins. This
ferent tests, ranging from the quantification of bacteria by on-     enables the expansion of the test to other antigens within a
chip isothermal DNA amplification [6] over the detection of          short development timeframe. The surface chemistry of the
antibodies to viruses in pig blood [7] to the quantitative detec-    test, finally, also allows for negligible matrix influence,
tion of antibiotic residues in milk [8] but here we present the      allowing even the analysis of hemolytic samples. With all
first diagnostic application in human blood, the CoVRapid            these benefits and its high diagnostic sensitivity and specific-
CL-MIA.                                                              ity, the CoVRapid CL-MIA can be a valuable tool in COVID-
    The test principle is an indirect non-competitive immuno-        19 serosurveillance.
assay that is carried out on microarray glass chips containing
up to 100 covalently bound reagent spots per flow cell. The
mode of operation is shown in Fig. 1 in comparison to other          Experimental
immunoassay techniques frequently applied for SARS-CoV-2
antibody detection. The flow-based principle of the                  Chemicals, reagents and materials
CoVRapid test (Fig. 1a) allows for very short assay times
below 10 min and is therefore even faster than many of the           All chemicals, unless stated otherwise, were purchased
so-called rapid tests, which usually are lateral flow tests (Fig.    from Sigma-Aldrich, subsidiary of Merck (Darmstadt,
1c), and give qualitative results within 5 to 20 min [9]. These      Germany) and Carl Roth (Karlsruhe, Germany).
tests additionally have the disadvantage that they are sensitive     Chemiluminescence reagents were used from the Elistar
to matrix effects resulting in relatively low sensitivity and the    Supernova reagent kit from Cyanagen (Bologna, Italy). A
possibility of false positive results, which is undesired in the     peroxidase-labelled anti-human IgG antibody (Fc frag-
context of antibody testing [10]. Another relevant factor is the     ment) from goat was purchased from Sigma-Aldrich
use of adsorbed, denatured antigens for most lateral flow as-        (A0170, 5.6 mg mL−1).
says that lack the three-dimensional structure that is relevant         For the preparation of spotting, blocking, and running
for the binding of neutralizing antibodies. In the CoVRapid          buffers, phosphate-buffered saline (PBS, 137 mM NaCl,
CL-MIA, this crucial point can be accounted for, since the test      2.68 mM KCl, 8.09 mM Na2HPO4•2 H2O, and 1.47 mM
uses native antigens from mammalian expression systems,              KH2PO4, pH 7.2–7.4) was used. To obtain spotting buff-
containing all structural features and posttranslational             er, 10% (w/v) trehalose dihydrate and 0.005% (w/v)
Automated, flow-based chemiluminescence microarray immunoassay for the rapid multiplex detection of IgG...

Table 1 Overview over different assay principles and commercial SARS-CoV-2 antibody tests in comparison to CoVRapid CL-MIA (n.s., not
specified)

Assay principle                 Test, manufacturer                                         Used      Assay          Specificity Sensitivity Literature
                                                                                           antigen   duration       in %        in %

Lateral flow assay              Panbio™ COVID-19 IgG/IgM Rapid Test Device,                n.s.      10–20 min 99.4               93.0         [13]
                                   Abbott Laboratories
                                STANDARD™ Q COVID-19 IgM/IgG Duo Test, SD                  N         15 min         100           64.9         [14]
                                   Biosensor Inc
Enzyme-linked                   SARS-CoV-2 ELISA IgG, EUROIMMUN AG                         S1        2h             98            82.5         [14]
  immunosorbent assay           EDI™ Novel Coronavirus COVID-19 IgG ELISA,                 N, S       12 min       92.9–100      76.9–93.0    [15, 16]
                                SARS-CoV-2 IgG, Abbott Laboratories                        N         29 min         99–100        64.5–92.6    [13, 14,
                                                                                                                                                 16]
                                Elecsys® Anti-SARS-CoV-2, Roche Diagnostics                N         18 min         100           80.5–83.5    [14, 16]
                                  GmbH
Microarray immunoassay          xMAP SARS-CoV-2 Multi-Antigen IgG Assay,                   N, S1,    2.5 h          99.3          96.3         [17, 18]
 (MIA)                            Luminex Corporation                                        RBD
                                CoVRapid CL-MIA, Technical University of Munich            N, S1,    8 min          100           100          This
                                                                                             RBD                                                 work

Pluronic® F127 were added. For blocking buffer, 0.05%                       SARS-CoV-2 antigens
(v/v) Tween® 20 and 1% (w/v) bovine serum albumin
were added to PBS. As running buffer, PBS with 0.1%                         Recombinant SARS-CoV-2 spike S1 protein with mouse Fc-
(v/v) Tween® 20 was used.                                                   tag (expressed in HEK293 cells) was purchased from Biozol

a
                                       HRP-labelled
 Serum/plasma                        detection antibody                     H2O2/luminol

      Immobilized antigens                                                                                               Chemiluminescence reaction

b
                                                                HRP-labelled
                            Serum/plasma                      detection antibody                        Substrate

      Antigen coated well                                                                                                     Color reaction

c
    Sample
                                                                                Antigen conjugated gold nanoparticle
                                                                                Antigen specific IgG
                                                                                Anti-human IgG
                                                                                Rabbit-IgG conjugated gold nanoparticle
             Conjugation pad IgG line Control line Absorption pad               Anti-rabbit IgG
Fig. 1 Overview over different antibody test principles. a Flow-based CL-MIA. b ELISA. c Lateral flow immunoassay
Klüpfel J. et al. (Eching, Germany) and produced by Sino Biological (Beijing, After washing the column with 20 mM sodium phosphate, China). 0.3 M NaCl, pH 8.0, RBD-His was eluted with 4 × 1 mL Recombinant SARS-CoV-2 spike RBD protein with His- 20 mM sodium phosphate, 0.3 M NaCl, 0.25 M imidazole, tag and recombinant SARS-CoV-2 nucleocapsid protein with pH 8.0. Protein content was determined by OD 280 measure- Strep-tag were produced by ISAR Bioscience (Planegg, ment and the relevant fractions were dialysed (Slyde-A-Lyzer Germany). Dialysis Cassette, 10000 MWCO, Thermo Scientific # 66380) Spike protein RBD-His consists of the amino acids corre- against phosphate-buffered saline (PBS from Roth: 137 mM sponding to the receptor-binding domain (RBD), which was NaCl, 2.7 mM KCl, 10 mM Na2HPO4, 2 mM KH2PO4, derived from the S protein nucleotide sequence (positions pH 7.4, 0.2 μm filtered and steam sterilized) at 4 °C for 16 h. 22517 to 23183, amino acid 319 to 541, RVQP….CVNF) 0.5 L CHO-NP-Strep supernatants were diluted 1:2 in of the SARS-CoV-2 Wuhan Hu-1 genome (GenBank acces- 50 mM sodium phosphate, 0.3 M NaCl, pH 8.0, and loaded sion number MN908947) followed by six histidines. on an equilibrated 1-mL StrepTrapTM HP column (GE Nucleocapsid protein N-strep consists of the amino acids cor- Healthcare 28-9075-46). After washing the column with responding to the N protein nucleotide sequence (positions 50 mM sodium phosphate, 0.3 M NaCl, pH 8.0, NP-Strep 28290 to 29549) of the SARS-CoV-2 Wuhan Hu-1 genome was eluted with 4 × 1 mL 20 mM sodium phosphate, 0.3 M (GenBank accession number MN908947) followed by a NaCl, 2.5 mM desthiobiotin (Sigma, #D1411) pH 8.0. Protein streptavidin tag (NP-Strep). The complementary DNA se- content was determined by OD 280 measurement and the quences adapted for hamster codon usage were produced syn- relevant fractions were dialysed (Slyde-A-Lyzer Dialysis thetically by GeneArt (Life Technologies) by adding signal Cassette, 10,000 MWCO, Thermo Scientific # 66380) against sequences METPAQLLFLLLLWLPDTTG before starting PBS at 4 °C for 16 h. and cloned into the plasmid vector pcDNA5/FRT via BamHI and XhoI. The resulting vectors were called Serum and plasma samples pcDNA5/CoV-RBD-His and pcDNA5/CoV-NP-Strep, re- spectively, and allow for expression and secretion of RBD- Serum and plasma samples were either purchased from His or NP-Strep into the culture medium of mammalian cells Sigma-Aldrich (Darmstadt, Germany) or obtained from under the control of the human cytomegalovirus (CMV) Helmholtz Zentrum München, German Research Center for immediate-early enhancer/promoter and selection for stable Environmental Health, Haematologikum (Munich, Germany) clones with Hygromycin B after co-transfection with plasmid and the Institute of Virology, Technical University of Munich pOG44. The vectors were transfected by using Lipofectamine (Munich, Germany). All procedures were in accordance with 2000 Reagent (Invitrogen, #11668-019) into Flip-InTM- the Helsinki Declaration of 1975, as revised in 2000. Chinese hamster ovary (CHO) cells (Life Technologies), to- All patient data were anonymized before obtainment of the gether with the plasmid pOG44, providing site-directed re- samples. Patient samples were handled in laboratories ap- combination. After selection of a stably expressing clone in proved for biosafety level 2. Ham’s F12 supplemented with 10% fetal bovine serum and 600 μg ml−1 Hygromycin B, the clones were adapted to ProCHO5 medium (Lonza, #BE12-766Q) supplemented with Chip surface chemistry 4 mM L-Glutamin (Biochrom, #K0283). CHO-spike-RBD-His cells and CHO-spike-NP-Strep cells The immunoassay was performed on glass slides with surface were grown in suspension in ProCHO5, 4 mM L-Glutamin modifications based on a procedure described elsewhere [19]. and 600 μg ml−1 Hygromycin B in flasks to submaximal In short, microscopy glass slides were cleaned thoroughly and density at 37 °C and then centrifuged. The cells were contin- activated by acid treatment for subsequent silanization with uously grown at 37 °C, with splitting every 3–4 days. The (3-glycidyloxypropyl)trimethoxysilane. The silanized slides supernatants were cleared by centrifugation at 400g for were then coated with Jeffamine® ED-2003. The prepared, 5 min and subsequent filtration with a 0.22-nm sterile filter polyether amine functionalized chips were stored under inert (TPP, #99722). The resulting RBD-His or NP-Strep protein- gas until protein immobilization was done. containing medium was immediately frozen and stored at −20 °C until protein purification. Starting from a mix of cell Microarray chip production clones, single clones are being selected and further propagated. Depending on the immobilization protocol for antigen micro- For protein purification, thawed CHO-RBD-His superna- array preparation, the polyether amine functionalized glass tants (0.5 L) were diluted 1:2 in 20 mM sodium phosphate, slides were activated before spotting or used without activa- 0.3 M NaCl, pH 8.0, and loaded on an equilibrated 1-mL tion. Activation was necessary for DSC and diepoxy PEG HisTrapTM excel column (GE Healthcare 17-3712-05). immobilization strategies, while for EDC/s-NHS
Automated, flow-based chemiluminescence microarray immunoassay for the rapid multiplex detection of IgG...

immobilization, the functionalized glass slides could be used               flow channels. The assembled chips were then filled with
without further treatment.                                                  blocking buffer and stored at 4 °C until measurement.
    For N,N′-disuccinimidyl carbonate (DSC) activation, a mix-
ture of 16 mg N,N′-disuccinimidyl carbonate, 0.8 mg
4-(dimethylamino)pyridine, and 25 μL triethylamine in 320 μL                Microarray measurements
dimethylformamide per chip was prepared. Subsequently,
600 μL of this mixture was pipetted onto the top side of a func-            Microarray measurements were carried out on the Microarray
tionalized glass slide that was then covered with another slide             Chip Reader, 3rd generation (MCR 3), manufactured by
(top side pointing downward). The chip sandwiches were incu-                GWK Präzisionstechnik GmbH (Munich).
bated at RT and low humidity for 4 h, subsequently separated                   Before the beginning of measurements on the micro-
and sonicated in methanol for 15 min. After drying them in                  array chip reader MCR 3, the system was flushed with
nitrogen stream, they were directly used for spotting.                      running buffer and water using the respective flushing
    For preparation of a reactive epoxy group on the chip sur-              program. Subsequently, all necessary reagents (horserad-
face, poly(ethylene glycol) diglycidyl ether (diepoxy PEG)                  ish peroxidase (HRP)-labelled anti-human IgG diluted
activation was used. Therefore, 600 μL of diepoxy PEG was                   with running buffer to the desired concentration and
pipetted onto the top side of a functionalized glass slide that             chemiluminescence reagents luminol and hydrogen per-
was then covered with another slide (top side pointing down-                oxide) were placed in the device. The tubes were loaded
ward). The chip sandwiches were incubated at 100 °C over-                   with the corresponding liquids using the load program.
night, subsequently separated and sonicated in methanol for                 In the beginning of each measurement day, the blank
15 min. After drying them in nitrogen stream, they were di-                 program was executed to record the CCD camera back-
rectly used for spotting.                                                   ground signal for an exposure time of 60 s. For measure-
    Alternatively, diepoxy PEG activation was done by pre-                  ments, a prepared microarray chip was inserted into the
spotting the chips with a solution of diepoxy PEG in water                  MCR 3 chip tray and the measurement program for the
(50% v/v) on the micro-contact spotter BioOdyssey                           respective flow cell was carried out. Samples were pre-
Calligrapher® MiniArrayer from Bio-Rad (Hercules, USA)                      pared by diluting 100 μL of serum or plasma sample
equipped with a solid pin SNS 9 from ArrayIT (Sunnyvale,                    with running buffer to a final volume of 1 mL, out of
USA). After pre-spotting and overnight incubation at 100 °C,                which 900 μL was used for the measurement. The total
the chips were also sonicated in methanol for 15 min and used               assay process is summarized in Table 2. The sample was
for spotting after drying.                                                  flown over the chip slowly, followed by the HRP-
    Spotting solutions were prepared by diluting the antigens and           labelled detection antibody and the chemiluminescence
positive controls with spotting buffer for DSC and diepoxy PEG              reagents, which had been pre-mixed in 50 μL segments.
activated chips. For spotting without previous activation of the            The exposure time for the recording of the measurement
polyether diamine chip surface (EDC/s-NHS spotting), 2 mg/mL                image was 60 s, followed by thorough washing of the
1-ethyl-3-(3-dimethylaminopropyl)carbodiimide (EDC) and N-                  system, leading to a total measurement time of 7 min
hydroxysulfosuccinimide (s-NHS) were added to spotting buffer.              45 s.
Antigen and positive control solutions of desired concentration
(if necessary, previously diluted with spotting buffer) were then
mixed with EDC/s-NHS solution (50% v/v). As positive control,               Data evaluation
anti-peroxidase and anti-human IgG antibodies were used, while
as negative control spotting buffer was applied.                            The detected CL signals were corrected with the previously
    The spotting solutions were then pipetted into a 384-well               recorded blank image, stored as txt files and processed with
plate (10–40 μL per solution depending on the number of                     the evaluation software MCR spot reader (Stefan
spotted chips) and inserted into the micro-contact spotter to-              Weißenberger, Munich, Germany). On the background-
gether with the prepared glass chips. Spotting was done in five             corrected CL images, a grid was set to define the position of
replicates for each spotting solution with a grid spacing of                the spots. For each spot, the mean value of the ten brightest
900-μm distance between replicates and 1300-μm distance                     pixels was calculated. Means and standard deviations were
between the spotted rows. The spotting process was carried                  calculated for the five replicates per row and spots that devi-
out at 20 °C and 55% humidity. After spotting, the chips were               ated more than 10% from the mean were excluded (maximum
incubated at 20 °C and 55% humidity overnight.                              two excluded spots per row).
    For microarray chip assembly, the spotted chips were con-                  The resulting mean values and standard deviations for all
nected to a PMMA carrier containing in- and outlet holes                    rows were used for further analysis and graphical evaluation
using double-sided adhesive foil with cut-outs forming two                  using Python 3.
Klüpfel J. et al.
Table 2 Main assay steps on the
MCR 3 with details to used Step Volume Flow rate
volumes and flow rates; a video
showing the measurement Sample injection 900 μL 10 μL s−1
process is provided in the Flushing 1000 μL 10 μL s−1
Supplementary Information 2000 μL 500 μL s−1
Detection antibody injection 200 μL 100 μL s−1
800 μL 10 μL s−1
Flushing 1000 μL 10 μL s−1
2000 μL 500 μL s−1
CL reagents injection 400 μL 150 μL s−1
Image acquisition - -
Flushing of whole system 11 mL 250 μL s−1 (flushing of sample syringe)
8 mL 500 μL s−1 (flushing of tubes and chip)
Comparison measurements with commercial RBD, and S1, as well as the positive control (anti-human
antibody tests IgG) and the background signal (spotting buffer).
With all tested methods, the antigen CL signals were higher
Comparison measurements with the commercial recomLine and for the positive sample compared to the negative one, while
recomWell tests from Mikrogen GmbH (Neuried, Germany) for for the background a very low signal and for the positive
the detection of SARS-CoV-2 specific IgG were conducted ac- control a high signal were found, showing the general appli-
cording to the manufacturer’s specifications. cability of all methods. Pre-spotting of diepoxy PEG gave
similar results as whole chip activation with diepoxy PEG
with slightly lower signal for the positive sample. Therefore,
Results and discussion the time-consuming pre-spotting process was considered
unnecessary.
Optimization of immobilization strategy With the negative sample in Fig. 3a, only slight unspecific
binding of antibodies to the antigens could be seen for DSC
Four different methods of surface activation and antigen im- and diepoxy PEG, while for EDC/s-NHS especially for the N
mobilization were tested (DSC, diepoxy PEG, diepoxy PEG protein a relatively high signal was found (2231 a.u. compared
pre-spotting, EDC/s-NHS). A schematic representation of the to 630 a.u. for diepoxy PEG). This unspecific binding also
chemical background of each of these methods is presented in diminishes the obtained positive/negative signal ratio, which
Fig. 2a) (for a more detailed view, Supplementary Information is found as 3.0 (N), 6.3 (RBD), and 5.7 (S1) for EDC/s-NHS,
Fig. S1 shows the respective reaction schemes). The pre- while diepoxy PEG immobilization gave values of 7.7, 19.3,
functionalized microarray glass chips present PEG spacers and 10.7 and DSC yielded 7.4, 21.9, and 9.1, respectively.
with terminal amino groups on their surface. Antigens then Additionally, many of the EDC/s-NHS spots on the microar-
can be immobilized in an undirected manner via either amino ray chip were very variable, while the other immobilization
groups (e.g., from lysine) in DSC and diepoxy PEG immobi- methods gave uniform, round spots. As in EDC/s-NHS acti-
lization or via carboxy groups (e.g., from glutamic acid) in vation not the chip surface but carboxy groups of the proteins
EDC/s-NHS immobilization. For DSC, the full chip surface in solution are activated, cross-linking of the proteins might
was activated, for diepoxy PEG activation of the full surface occur, leading to conformational changes and a change of
as well as only activation of the antigen spots by pre-spotting activity over the course of the spotting process.
was tested. For EDC/s-NHS, the antigen carboxy groups are As the positive/negative signal ratios obtained with DSC
activated and spotted onto an amino functionalized chip with- and diepoxy PEG immobilization were comparable for all
out surface activation. spotted rows, it was decided to use DSC immobilization for
After spotting, the chips are assembled with a PMMA car- all further experiments due to the low time expenditure of 4 h
rier and an adhesive foil containing two flow channels as for the surface activation before spotting compared to over-
shown in Fig. 2b), resulting in a microarray chip as in Fig. night activation with diepoxy PEG.
2c) that can be inserted into the measurement device MCR 3. We therefore were able to develop different strategies for
Figure 3 shows the resulting chemiluminescence signals the covalent immobilization of proteins on glass microarray
for measurements of a SARS-CoV-2 serology negative (a) chips in their native conformation, benefitting from the exper-
and positive (b) sample for the SARS-CoV-2 antigens N, tise of our research group in the production of different kindsAutomated, flow-based chemiluminescence microarray immunoassay for the rapid multiplex detection of IgG...
a b
H2N H2N
1. DSC EDC / s-NHS
1. Diepoxy O
2. NH2 PEG
R
2. R NH2 R OH
R R R R R R
HN HN NH NH O O
O O HN HN
HN HN OH OH
O O
c
O O
n n
HO HO
HN HN
Fig. 2 Microarray chip spotting and assembly. a Schematic overview of immobilization is done via amino or carboxy groups of the amino acid
antigen immobilization strategies, with DSC and diepoxy PEG side chains. b Chip assembly from carrier (top), adhesive foil with flow
immobilization being two-step processes (chip surface activation follow- channels (middle), and glass microarray chip (bottom). c Photograph of
ed by antigen immobilization) and EDC/s-NHS as one-step process (an- an assembled chip
tigen activation in spotting solution), antigens shown in blue,
of microarrays. An important factor is the spotting buffer, immobilization methods can also be easily applied to other
containing trehalose and Pluronic® F127 [19]. Trehalose is native proteins, allowing for the rapid adaption and extension
also used in protein freeze-drying processes as a protective of the microarray.
agent, mimicking the hydrogen bonds between polar function-
al groups of the protein and water [20], while pluronics are Optimization of antibody and antigen concentrations
poloxamers that are widely applied in pharmaceutical industry
and microfluidic technology as non-ionic surfactants to pre- After determination of the optimal immobilization method, dif-
vent protein aggregation and adsorption [21, 22]. The ferent immobilized antigen concentrations and secondary
a b
Fig. 3 Measurement results for different immobilization methods. a SARS-CoV-2 serology negative sample. b SARS-CoV-2 serology positive sample;
error bars represent replicate measurements on different chips, n = 3Klüpfel J. et al.
antibody concentrations were tested. For the antigen concentra- secondary antibody concentrations from 0.7 to 5.6 mg mL−1,
tions, undiluted antigen (250 μg mL−1 for N and S1 protein, a significant increase can be seen upon doubling of the con-
350 μg mL−1 for RBD) and subsequent twofold dilutions were centration, while a further increase to 11.2 mg mL−1 only
tested until a dilution of 1:8. For the HRP-labelled secondary gives slightly higher signals for all antigens. Thus, as a com-
antibody, five different concentrations, namely 11.2 μg mL−1 promise between high signal intensities and low expenditure
(1:500 dilution of stock solution), 5.6 μg mL−1 (1:1000), of secondary antibody, a concentration of 5.6 mg mL−1 was
2.8 μg mL −1 (1:2000), 1.4 μg mL −1 (1:4000), and used for all further measurements.
0.7 μg mL−1 (1:8000), were used. The same SARS-CoV-2 se- For the decision on the optimal spotted antigen concentra-
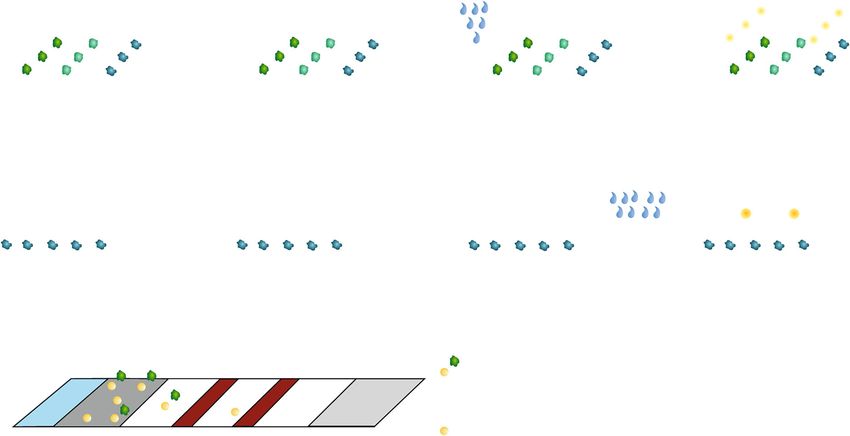
rology positive sample was used for all measurements. The re- tion, not only the chemiluminescence intensities as displayed
sults are presented in Fig. 4a with one set of bars for each sec- in Fig. 4a were taken into account but also the appearance of
ondary antibody concentration and each bar representing a cer- the spots on the microarray chip as shown in Fig. 4b. Here,
tain antigen concentration in the spotting solution as indicated. three blocks of spots can be seen with the four columns within
Figure 4b shows examples of images of a microarray chip with each block representing the different concentrations of anti-
bright spots in rows representing spotted antigens. gens, decreasing from left to right. The three blocks corre-
It is clearly visible that the chemiluminescence signal in- spond to the different antigens, starting with N protein on
creases with increasing secondary antibody concentration. In the left side, RBD in the middle and S1 protein on the right-
the same course, the background signal increases but to a hand side, as also shown in Fig. 4a. The flow direction of
lower extent compared to the specific antigen signals. For sample and reagents during the measurements is from lower
a
b
Fig. 4 a Measurements of different immobilized antigen dilutions using (columns from left to right: N undiluted, N 1:2, N 1:4, N 1:8; RBD
different secondary antibody concentrations; error bars represent replicate undiluted, RBD 1:2, RBD 1:4, RBD 1:8; S1 undiluted, S1 1:2, S1 1:4,
measurements on different chips, n = 3. b Exemplary chip images S1 1:8, rows represent replicates of the same antigen dilution)Automated, flow-based chemiluminescence microarray immunoassay for the rapid multiplex detection of IgG...
towards higher concentrations of the antigens (right to left in correlation between antibody concentration in the sample
Fig. 4b). and chemiluminescence intensity can clearly be seen with
For the intensities, the same trends can be seen regardless linear regressions almost perfectly fitting the measured data
which secondary antibody concentration was used. For the N (R2 = 1.00 for RBD and S1, R2 = 0.94 for the background
protein, a signal increase is seen with increasing concentration of signal). The slight slope for the background signal can be
antigen on the chip. For S1 and RBD, this is true for all diluted explained as different blood samples were used, naturally
samples (concentrations between 31.25 and 175 μg mL−1 as resulting in different background values. For prospective fu-
indicated above). For the spotting of undiluted antigen, lower ture applications, this matrix influence can easily be avoided
intensities than for the 1:2 dilution are found, indicating either a by a background correction of the measurement data as was
lower immobilization efficiency with less immobilized antigen done in all following experiments.
molecules on the surface or a lower activity of the protein. When While for the measurement point at 1% positive sample
looking at the antigen spots, an increase in diameter is seen up to ratio only a slight difference to the pure negative sample can
the 1:2 dilution, while for the undiluted spotting row, notably be seen, the following measurement point at 10% positive
smaller and less uniform spots are seen for all antigens, espe- sample ratio already can be distinguished well from the neg-
cially for the S1 protein, where the spots are barely visible. This ative sample. The greater slope for the RBD compared to the
can be attributed to the drying of the spots during the incubation S1 protein can be assigned to the different spotted concentra-
time after spotting. In the undiluted antigen samples, no stabi- tions (175 μg mL−1 and 125 μg mL−1, respectively). From
lizing agents were added, leading to rapid drying of the spots these results, we conclude that a future development towards a
and activity loss of the protein. Especially for the S protein, it has quantitative test is possible. If a standard sample with a
already been shown that antibody recognition depends strongly known, high concentration of antibodies to the RBD and S1
on the used protein expression systems; therefore, also slight protein is available, a calibration of the test can be done,
conformational changes upon drying of the spots might have allowing for a simple quantitative interpretation of measure-
an influence [3]. Additionally, it is possible that protein agglom- ments that might give a more detailed information about an
erated or adsorbed to the wells of the microwell plate before individual’s SARS-CoV-2 serological status.
spotting, reducing the concentration on each spot. For the diluted
antigen samples, we aimed at reducing these effects by using the Measurement and classification of patient samples
spotting buffer containing trehalose and Pluronic® F127. As and comparison with results of commercial antibody
these additives had a beneficial effect on signal intensity (for tests
S1 and RBD) as well as on spot appearance (for all antigens)
but still a high antigen concentration was desired, all further To define cutoff values used for the assignment of positive and
experiments were done using 1:2 dilutions of the antigens with negative results, receiver operating characteristic (ROC) curves
spotting buffer, resulting in concentrations of 175 μg mL−1 were used. They illustrate the trade-off between correctly iden-
(RBD) and 125 μg mL−1 (S1, N) in the spotting solution. tified positive samples and false positives in a diagnostic test,
allowing for the selection of a suitable cutoff value for a given
Dilution measurements question [24]. In a ROC curve, the cutoff value is shifted over a
range of values and sensitivity and specificity are calculated for
To evaluate the correlation between antibody concentration each cutoff. Resulting pairs of sensitivity and 1 − specificity are
and chemiluminescence signal that is needed for the develop- plotted together with a diagonal line (x = y). A perfect test will
ment of prospective future quantitative tests, COVID-19 result in a right triangle that intersects the point [0,1],
reconvalescent plasma was diluted with a negative control representing 100% sensitivity and specificity. A calculation of
sample. Antibody measurements of samples with positive the area under the curve (AUC) for a perfect test will give a
plasma ratios between 0 and 100% were performed for RBD value of 1.0, while the worst possible result (resembling a toss
and S1 protein as they are the most immunogenic antigens [3] coin) is an AUC of 0.5, achieved by a ROC curve matching the
and, therefore, most promising for a quantitative application. diagonal. Depending on the diagnostic question of interest, a
A determination of the SARS-CoV-2 N protein was not cutoff can be chosen with respect to highest possible sensitivity
attempted, as its sequence was shown to be more conserved or specificity. In the context with SARS-CoV-2 antibody detec-
over different corona viruses [11] implying that cross reactiv- tion, high specificity is desirable, as a false positive result might
ity and, hence, cross sensitivity to antibodies to endemic co- mislead tested individuals to be less cautious as they presume to
rona viruses might be possible [23]. be immune to SARS-CoV-2 infection.
Figure 5 shows the resulting chemiluminescence intensities To determine ROC curves for the test presented herein, 65
for seven different mixture ratios of serology positive and serum and plasma samples (32 from individuals without pre-
negative samples. Besides the RBD and S1 protein, also the vious SARS-CoV-2 infection, 33 from reconvalescent
background signal is shown for comparison. A linear COVID-19 patients) were tested, the resultingKlüpfel J. et al.
Fig. 5 Linear regression (m = 7)
for measurements of samples with
different ratios of SARS-CoV-2
serology positive plasma for RBD
and S1 protein; error bars repre-
sent replicate measurements on
different chips, n = 3
chemiluminescence values were background-corrected and testing, a false positive result is considered more harmful than
then used for the ROC determination. Results for the three a false negative one as it dissembles a non-existing immunity.
tested antigens as well as for the combination of them on the The respective cutoff values, given in background-corrected
chip are shown in Fig. 6. For the combined antigens, a sample chemiluminescence intensity, are 2860 for the N protein
was considered positive when it gave signal above cutoff for (100% sensitivity, 100% specificity), 800 for RBD (93.9%
at least one antigen. sensitivity, 100% specificity), and 1700 for the S1 protein
For all antigens, a high AUC above 0.99 was determined. (87.9% sensitivity, 100% specificity). Still, the given values
Literature states that an AUC value above 0.9 represents good for sensitivity must be considered with caution, as it cannot be
accuracy of a test [24, 25]. Especially for the N protein, an guaranteed that all reconvalescent patients actually had
optimal ROC curve with an AUC of 1.0 was found. formed antibodies to all antigens.
Cutoff values were defined such that the highest possible The determined cutoff values were then used to take a
specificities resulted for each antigen as especially in antibody closer look at the measurement results for all patient samples.
Fig. 6 ROC curves and a b
respective AUC values for
different antigens, obtained from
measurements of 65 patient
samples; a N protein, b RBD, c
S1 protein, d combination of all
antigens on the chip
c dAutomated, flow-based chemiluminescence microarray immunoassay for the rapid multiplex detection of IgG... The background-corrected chemiluminescence values were previous SARS-CoV-2 infection, most samples showed normalized with respect to the cutoff values and the resulting higher normalized intensities for the N protein than for RBD values are shown in Fig. 7a for the negative samples and in and S1. This was the expected result, as for the N protein a Fig. 7b and c for the positive samples. For the patients without cross reactivity with endemic coronaviruses could not a b c Fig. 7 CoVRapid CL-MIA results for 65 patient samples. a Results for antigen; all values are normalized with respect to the cutoff values deter- 32 SARS-CoV-2 serology negative samples. b Results for 33 SARS- mined by ROC curve analysis; error bars represent standard deviation of CoV-2 serology positive samples. c Detailed representation of positive replicate spots on one chip, n = 5 samples with measurement signal below the cutoff for at least one
Klüpfel J. et al.

completely be excluded due to high sequence similarity.                   expected as the spike protein is considered more immunogenic
Comparison measurements with the recomLine test from                      than the nucleocapsid [3].
Mikrogen showed that the vast majority of all patients had                    The measured intensities spread over a broad range from
formed antibodies to the N protein of at least one of the en-             slightly above 1 (cutoff) to over 70. As no information on the
demic coronaviruses 229E, NL63, OC43, and HKU1. For the                   clinical course of the patients was available, it can only be
negative sample S22, which shows a lower intensity for N                  suspected that higher intensities may be related to either more
than for S1 and RBD, it is possible that a recent, undetected             recent or more severe disease. Still, all knowingly positive
infection with SARS-CoV-2 was present and IgG antibodies                  samples were found positive for at least one of the tested
had already started to form to a low extent or that the patient           antigens, resembling 100% sensitivity.
had overcome COVID-19 at a very early stage of the pandem-                    For a total of three of the positive samples only for one or
ic and the antibody amount in the blood had already declined              two of the antigens, a signal above the cutoff was determined.
below the detectable level. Confirmation would be possible by             As in Fig. 7b no clear interpretation of samples with low signal
follow-up measurements of the patient or by consulting his                is possible, these samples are shown in more detail in Fig. 7c.
case file, which both were not possible due to the sample                 The reason for this outcome might be that the patients still
obtainment strategy. Sample S23 shows a low intensity for                 were in an early stage of infection where few antibodies had
both N protein and RBD, while a relatively high signal for                been formed yet, or that the antibody amount in the blood was
S1 is detected. As the RBD is contained within the S1 protein             already declining due to a prolonged time since infection. This
and tended to give higher signals compared to the S1 in our               emphasizes that a quantitative test will be helpful in the future.
test, this indicates that no specific antibodies to SARS-CoV-2            When comparing the results obtained with the commercial
S1 have been formed. Instead, as the used S1 protein carried a            multiplex test recomLine from Mikrogen, for S51 and S63,
mouse Fc fragment, it might be possible that the patient had              only a positive result for the N protein could be found, while
formed human anti-mouse antibodies (HAMA) that have been                  S1 and RBD were negative, confirming the CoVRapid result.
shown to interfere with immunoassay measurements [26].                    This is also in accordance with literature findings showing that
Still, with the defined cutoff values, all negative samples were          antibodies to different proteins form independently which
correctly classified as negative for all three antigens, resem-           possibly leads to significantly different reactions to different
bling a specificity of 100% for the CoVRapid CL-MIA.                      antigens at certain points of time after symptom onset [27, 28].
   For the SARS-CoV-2 serology positive samples in Fig. 7b                    Comparison tests were done not only with the recomLine
the trend already seen in the dilution measurements again is              test (N, RBD, and S1 protein) but also with the N specific
visible, as for most patients a higher intensity is found for             recomWell ELISA from Mikrogen. The principal antibody
RBD compared to S1 due to the higher immobilized concentra-               test used for the sample classification that Fig. 7 refers to
tion. Few samples show a different behaviour with comparable              was the iFlash test from YHLO. Here, samples are classified
intensities for S1 and RBD or even higher signal for S1, indicat-         with regard to antibodies for either the N or S1 protein.
ing that antibodies to other S1 regions than the RBD might have               Overall, a good performance of all tests was found as depicted
been formed. In comparison to the signals for the N protein, most         in Table 3. While our CoVRapid test classified all samples cor-
samples show higher intensities for S1 and RBD, which is                  rectly (with respect to iFlash classification), with the recomLine

Table 3 Classification of patient samples by different anti-SARS-CoV-     “Not classified” was ordered from a commercial supplier as negative
2 IgG tests. The iFlash-SARS-CoV-2 IgG was used as reference classifi-    control, two were obtained from reconvalescent COVID-19 patients).
cation for 62 samples, while three samples were only tested with the      For the recomWell test, two samples gave values in the borderline area
alternative tests CoVRapid CL-MIA, recomLine SARS-CoV-2 IgG,              of the test and were therefore excluded
and recomWell SARS-CoV-2 IgG (one of the samples specified as

                                iFlash          CoVRapid                 recomLine             recomWell
                                                     100                    100                     96.7            Positive (%)
             AB positive           31
                                                      0                      0                       3.3            Negative (%)
                                                      0                     3.2                      3.3            Positive (%)
            AB negative            31
                                                     100                   96.8                     96.7            Negative (%)
                                                     66.7                  66.7                     66.7            Positive (%)
          Not classified            3
                                                     33.3                  33.3                     33.3            Negative (%)
                      Total        65                 65                     65                       63            Total
Automated, flow-based chemiluminescence microarray immunoassay for the rapid multiplex detection of IgG...
test, one false positive sample was found (positive for S1, neg- been successful and, hence, can aid in the control of vaccina-
ative for RBD and N). With the recomWell test, two samples tion status dependent admission criteria on-site.
gave results in the borderline area and were therefore excluded. Future research activities are planned to enlarge the scope of
Additionally, this test gave one false negative and one false applications of the test. One aim is to transfer the microarray
positive result. This gives the CoVRapid test the highest sensi- from glass to polycarbonate chips, making the fabrication even
tivity and specificity (100% each) while recomLine obtained more economic. Additionally, the dual detection of IgM and
values of 100% and 96.8%, respectively, and recomWell IgG antibodies to SARS-CoV-2 and also to other respiratory
showed the highest deviations with 96.7% each. viruses such as influenza will be expedited, as the flow-based
concept is predestined for a two-step detection of different pa-
rameters. The detection of IgM antibodies furthermore would
allow for a rapid diagnostic tool, e.g., in emergency rooms
where patients with respiratory symptoms could be diagnosed
Conclusion rapidly after admission and subsequently be treated accordingly
right from the beginning of their hospitalization. Another possi-
We developed a rapid, flow-based CL-MIA that allows for the ble field of application would be a general vaccination monitor-
fully automated detection of IgG antibodies to three different ing for diseases such as measles, hepatitis A and B, or SARS-
SARS-CoV-2 antigens, namely N, S1, and RBD, from human CoV-2 to allow for a rapid titer check by quantitative CL-MIA
serum or plasma within as few as 8 min. The test showed a very directly followed by vaccination if necessary.
high diagnostic sensitivity and specificity of 100% with 65 Overall, we bring forward a valuable diagnostic tool that can
tested patient samples and thus performed better than two com- easily be customized to different applications and already proved
mercial tests for the same sample set. Additional advantages of very successful in the context of SARS-CoV-2 serology testing.
the CoVRapid CL-MIA over the other test systems are the
rapid analysis without extensive manual pipetting steps due to
an automated flow-based principle of the assay. Due to this
principle, the assay is more sensitive than common lateral flow Supplementary Information The online version contains supplementary
material available at https://doi.org/10.1007/s00216-021-03315-6.
“rapid tests” while still being very fast and easy to conduct
without extensive manual steps in contrast to ELISA tests. Acknowledgements The authors would like to thank Dr. Kathrin Kloth
Due to the microarray principle, the simultaneous detection and the Milchprüfring Bayern e.V. who provided the MCR 3.
of antibodies to different antigens is possible with the Additionally, we would like to thank Katharina Sollweck, Lisa Göpfert,
CoVRapid CL-MIA, giving a more detailed insight into the Julia Neumair, and Martin Knopp for advice and discussion; Alfred
Michelfelder, Margarete Remm, and Christian Klenk for their support
individual immune response and diminishing the risk of false in the laboratory; and Daniel Henschel for proofreading.
negative results. With our specialized microarray chip surface
chemistry, we also achieved a negligibly small matrix influ- Author contributions J. Klüpfel conceived the experiments. J. Klüpfel
ence that can be further reduced by on-chip matrix controls, and R. Koros conducted the experiments under supervision of J. Klüpfel.
enabling even the analysis of hemolytic blood samples. J. Klüpfel analyzed the results and wrote the manuscript with input from
the co-authors. K. Dehne and M. Ungerer provided recombinant SARS-
With respect to the microarray chip production, also the CoV-2 RBD and N protein. J. Mautner, S. Würstle, M. Feuerherd, and U.
covalent immobilization strategy for native proteins has to Protzer provided patient samples. O. Hayden provided Bio2 laboratory
be emphasized in comparison to common assays that are workspace at TranslaTUM. M. Elsner and M. Seidel supervised the pro-
based on the adsorption of denatured proteins. With native ject and were responsible for funding acquisition and resources.
proteins, an environment comparable to the human cell is
Funding Open Access funding enabled and organized by Projekt DEAL.
created, giving a realistic impression of the human immune
This work received funding from the Bayerische Forschungsstiftung
response. Additionally, future adaption of the test for example (BFS) (AZ-1438-20C).
by immobilization of antigens containing mutations is easily
possible using the same antigen production and immobiliza- Data availability Data will be made available upon reasonable request.
tion strategies as described herein.
This test is not only valuable in clinical surroundings to Declarations
check whether a patient already overcame a SARS-CoV-2
infection and, especially, whether he still has antibodies that Ethics approval The study was approved by the Ethics Commission of
probably render him immune to fresh infection. It additionally the Technical University of Munich, Rechts der Isar Hospital (reference
22/21 S-SR), and was conducted in accordance with the Declaration of
can be very helpful in the upcoming time in connection with Helsinki.
the SARS-CoV-2 vaccination that is already carried out in
many countries and will be in the following months in many Consent to participate All samples were collected with informed
more. The test can be used to assess whether a vaccination has consent.Klüpfel J. et al.
Consent for publication All samples were collected with informed specific COVID-19 antibody testing. Lab Chip. 2020;20:3302–9.
consent. https://doi.org/10.1039/d0lc00547a .
13. Batra R, Olivieri LG, Rubin D, Vallari A, Pearce S, Olivo A, et al. A
Conflict of interest The authors declare no competing interests. comparative evaluation between the Abbott Panbio™ COVID-19
IgG/IgM rapid test device and Abbott Architect™ SARS CoV-2
Open Access This article is licensed under a Creative Commons IgG assay. J Clin Virol. 2020;132:104645. https://doi.org/10.1016/
Attribution 4.0 International License, which permits use, sharing, adap- j.jcv.2020.104645 .
tation, distribution and reproduction in any medium or format, as long as 14. Naaber P, Hunt K, Pesukova J, Haljasmägi L, Rumm P, Peterson P,
you give appropriate credit to the original author(s) and the source, pro- et al. Evaluation of SARS-CoV-2 IgG antibody response in PCR
vide a link to the Creative Commons licence, and indicate if changes were positive patients: comparison of nine tests in relation to clinical
made. The images or other third party material in this article are included data. PLoS One. 2020;15:e0237548. https://doi.org/10.1371/
in the article's Creative Commons licence, unless indicated otherwise in a journal.pone.0237548 .
credit line to the material. If material is not included in the article's 15. Plebani M, Padoan A, Negrini D, Carpinteri B, Sciacovelli L.
Creative Commons licence and your intended use is not permitted by Diagnostic performances and thresholds: the key to harmonization
statutory regulation or exceeds the permitted use, you will need to obtain in serological SARS-CoV-2 assays? Clin Chim Acta. 2020;509:1–
permission directly from the copyright holder. To view a copy of this 7. https://doi.org/10.1016/j.cca.2020.05.050 .
licence, visit http://creativecommons.org/licenses/by/4.0/. 16. Parai D, Dash GC, Choudhary HR, Peter A, Rout UK, Nanda RR,
et al. Diagnostic comparison of three fully automated chemilumi-
nescent immunoassay platforms for the detection of SARS-CoV-2
antibodies; 2020.
References 17. Denise M. Hinton FDA. xMAP SARS-CoV-2 Multi-Antigen IgG
Assay Emergency Use Authorization. 2020. https://www.fda.gov/
media/140257/download. Accessed 15 Jan 2020.
1. Zhu N, Zhang D, Wang W, Li X, Yang B, Song J, et al. A novel
coronavirus from patients with pneumonia in China, 2019. N Engl J 18. Luminex Corporation. xMAP®SARS-CoV-2 Multi-Antigen IgG
Med. 2020;382:727–33. https://doi.org/10.1056/NEJMoa2001017 . Assay Package Insert. 2020. https://www.fda.gov/media/140256/
download. Accessed 15 Jan 2020.
2. World Health Organization. WHO Coronavirus disease (COVID-19)
dashboard. 2020. https://covid19.who.int/. Accessed 15 Jan 2021. 19. Wolter A, Niessner R, Seidel M. Preparation and characterization of
functional poly(ethylene glycol) surfaces for the use of antibody
3. Zhang X-Y, Guo J, Wan X, Zhou J-G, Jin W-P, Lu J, et al.
microarrays. Anal Chem. 2007;79:4529–37. https://doi.org/10.
Biochemical and antigenic characterization of the structural pro-
1021/ac070243a .
teins and their post-translational modifications in purified SARS-
CoV-2 virions of an inactivated vaccine candidate. Emerg 20. Carpenter JF, Crowe JH. An infrared spectroscopic study of the
Microbes Infect. 2020;9:2653–62. https://doi.org/10.1080/ interactions of carbohydrates with dried proteins. Biochemistry.
22221751.2020.1855945 . 1989;28:3916–22. https://doi.org/10.1021/bi00435a044 .
4. Krammer F. SARS-CoV-2 vaccines in development. Nature. 21. Lee HJ, McAuley A, Schilke KF, McGuire J. Molecular origins of
2020;586:516–27. https://doi.org/10.1038/s41586-020-2798-3 . surfactant-mediated stabilization of protein drugs. Adv Drug Deliv
Rev. 2011;63:1160–71. https://doi.org/10.1016/j.addr.2011.06.015 .
5. Tanne JH. Covid-19: Pfizer-BioNTech vaccine is rolled out in US.
BMJ. 2020;371:m4836. https://doi.org/10.1136/bmj.m4836 . 22. Luk VN, Mo GC, Wheeler AR. Pluronic additives: a solution to
sticky problems in digital microfluidics. Langmuir. 2008;24:6382–
6. Kober C, Niessner R, Seidel M. Quantification of viable and non-
9. https://doi.org/10.1021/la7039509 .
viable Legionella spp. by heterogeneous asymmetric recombinase
polymerase amplification (haRPA) on a flow-based chemilumines- 23. Gralinski LE, Menachery VD. Return of the Coronavirus: 2019-
cence microarray. Biosens Bioelectron. 2018;100:49–55. https:// nCoV. Viruses. 2020. https://doi.org/10.3390/v12020135 .
doi.org/10.1016/j.bios.2017.08.053 . 24. Gardner IA, Greiner M. Receiver-operating characteristic curves
7. Wutz K, Meyer VK, Wacheck S, Krol P, Gareis M, Nölting C, et al. and likelihood ratios: improvements over traditional methods for
New route for fast detection of antibodies against zoonotic patho- the evaluation and application of veterinary clinical pathology tests.
gens in sera of slaughtered pigs by means of flow-through chemi- Vet Clin Pathol. 2006;35:8–17. https://doi.org/10.1111/j.1939-
luminescence immunochips. Anal Chem. 2013;85:5279–85. 165x.2006.tb00082.x .
https://doi.org/10.1021/ac400781t . 25. Trivedi SU, Miao C, Sanchez JE, Caidi H, Tamin A, Haynes L,
8. Kloth K, Rye-Johnsen M, Didier A, Dietrich R, Märtlbauer E, et al. Development and evaluation of a multiplexed immunoassay
Niessner R, et al. A regenerable immunochip for the rapid determi- for simultaneous detection of serum IgG antibodies to six human
nation of 13 different antibiotics in raw milk. Analyst. 2009;134: coronaviruses. Sci Rep. 2019;9:1390. https://doi.org/10.1038/
1433–9. https://doi.org/10.1039/b817836d . s41598-018-37747-5 .
9. Kubina R, Dziedzic A. Molecular and serological tests for COVID- 26. Klee GG. Human anti-mouse antibodies. Arch Pathol Lab Med.
19 a comparative review of SARS-CoV-2 coronavirus laboratory 2000;124:921–3. https://doi.org/10.1043/0003-9985(2000)
and point-of-care diagnostics. Diagnostics (Basel). 2020. https:// 1242.0.CO;2 .
doi.org/10.3390/diagnostics10060434 . 27. Ayouba A, Thaurignac G, Morquin D, Tuaillon E, Raulino R,
10. Adams ER, Ainsworth M, Anand R, Andersson MI, Auckland K, Nkuba A, et al. Multiplex detection and dynamics of IgG antibodies
Baillie JK, et al. Antibody testing for COVID-19: a report from the to SARS-CoV2 and the highly pathogenic human coronaviruses
National COVID Scientific Advisory Panel. Wellcome Open Res. SARS-CoV and MERS-CoV. J Clin Virol. 2020;129:104521.
2020;5:139. https://doi.org/10.12688/wellcomeopenres.15927.1 . https://doi.org/10.1016/j.jcv.2020.104521 .
11. Kilic T, Weissleder R, Lee H. Molecular and immunological diag- 28. Shrock E, Fujimura E, Kula T, Timms RT, Lee I-H, Leng Y, et al.
nostic tests of COVID-19: current status and challenges. iScience. Viral epitope profiling of COVID-19 patients reveals cross-
2020;23:101406. https://doi.org/10.1016/j.isci.2020.101406 . reactivity and correlates of severity. Science. 2020. https://doi.org/
10.1126/science.abd4250 .
12. Hedde PN, Abram TJ, Jain A, Nakajima R, Ramiro de Assis R,
Pearce T, et al. A modular microarray imaging system for highlyYou can also read