Bangalore Metropolitan Transport Corporation - Bringing Bengaluru to your doorstep...
←
→
Page content transcription
If your browser does not render page correctly, please read the page content below
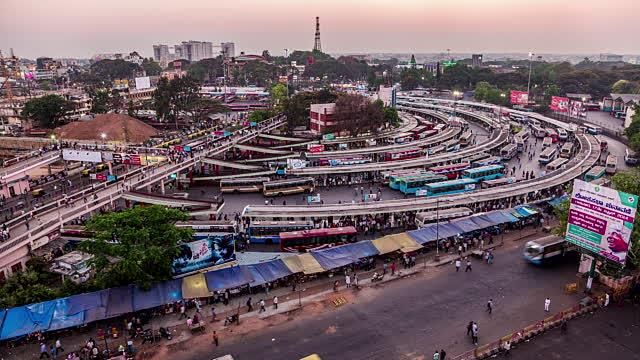
Bangalore Metropolitan Transport Corporation

                                               Bringing Bengaluru to your doorstep...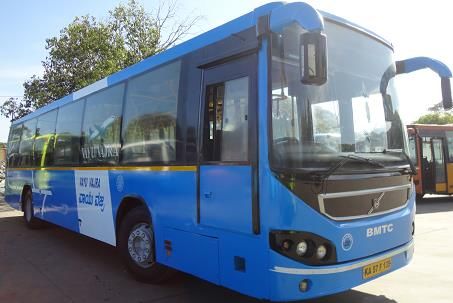
BANGALORE DEMOGRAPHY
Population – 10 Million
Area of the City – 812 sq. km.
Bengaluru Metropolitan Region Development Authority Area– 8005 sq. km.
2nd Largest Metropolitan area in the Country
Total number of registered vehicles in Bengaluru is 7.18 million (as on October 2017)
✓ Four wheelers - 1.3 million; two wheelers – 4.8 million; Buses – 44,598 others –
0.66 million
Bringing Bengaluru to your doorstep...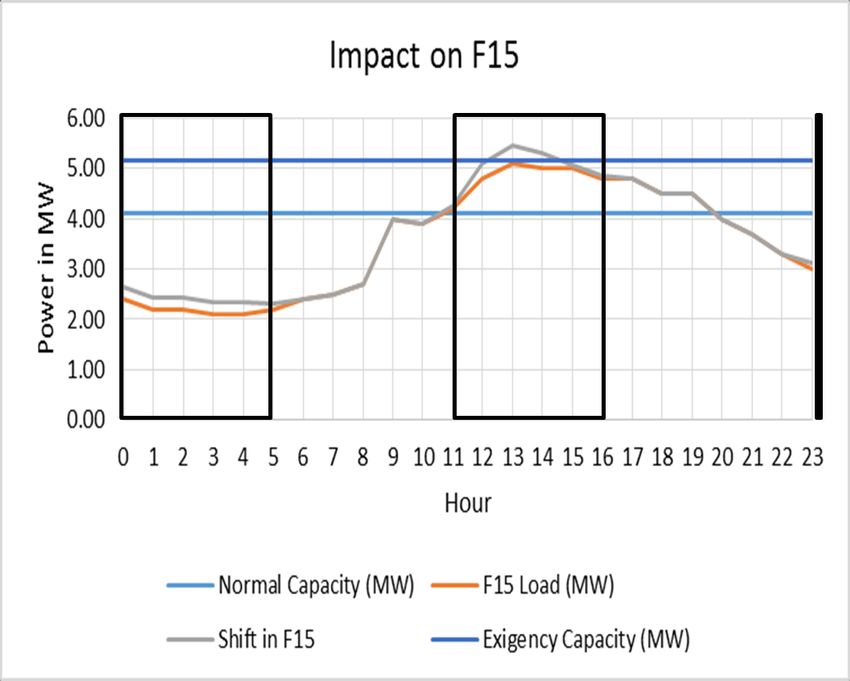
BMTC AT A GLANCE
     Bangalore Metropolitan Transport Corporation

Born on 15 Aug 1997

          6400 Buses (850 AC Buses)
                6174 Schedules                       45 lakh Passengers Daily

                49 Depots, 53 Bus Stations              11.48 lakh service
                    70872 Daily Trips                   Kilometres per day

                                                    Bringing Bengaluru to your doorstep...
Urban STUs – National Scenario
       (Upto June-2015*)
      Bangalore Metropolitan Transport Corporation

                                           DTC(City MTC        Pune    Total Urban
Sl.        Description       BMTC     BEST    )    Chennai     MPML     Transport

1 Ridership (lakhs)          50.00    33.29    36.68   48.83   10.96     179.97

2 % Fleet Utilization         90.0     86.1     84.4   84.8    65.1       82.8

3 Vehicle Utilization        215.1    182.9    186.9   301.9   230.7      218.0

4 % Load Factor               75.5     55.6     81.3   75.1    68.7       72.0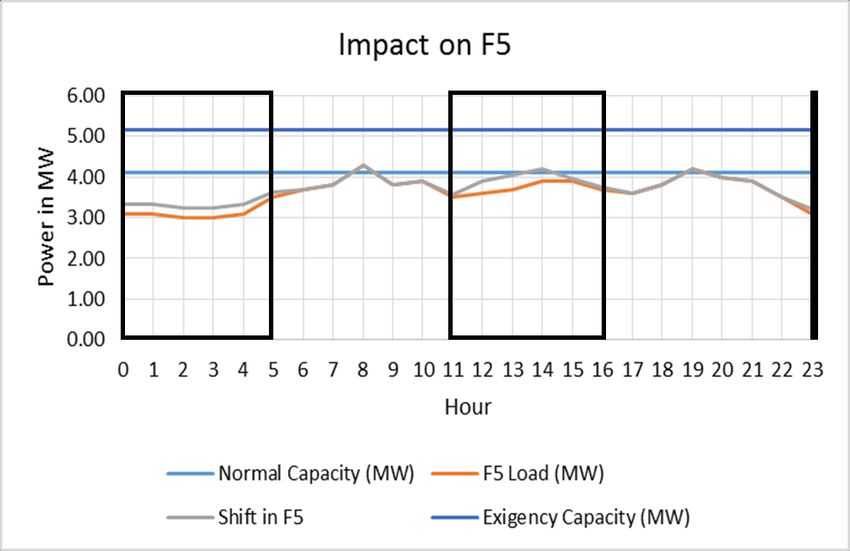
NEED FOR CLEAN TRANSPORT
Bangalore Metropolitan Transport Corporation
PM2.5 levels across cities for 2015 (Green Peace India,2016)
India has 13 of the top 20 world’s most 140
Yearly National Standard
polluted cities 120
WHO Yearly guideline
PM concentrations across major metros in 100
India are already in violation of National
80
Ambient Air Quality Standard
60
Transport sector main contributor
40
20
Bringing Bengaluru to your doorstep...
CURRENT CO2 EQ. EMISSIONS (IISC REPORT)

                         Bringing Bengaluru to your doorstep...
BMTC INITIATIVE TOWARDS CLEAN
TRANSPORT
Moving towards Electric Mobility
◼ Zero local emission
◼ Reduction in noise level - by 50%
◼ Reduction in Cost of Energy/km - less by 60%
◼ Maintenance - easy and cheaperINITIAL CHALLENGES FACED
• High Capital Cost ; Battery cost is 60% of bus cost
❖ Funding constraint for direct procurement
• Evolving and new Technology
❖ Challenges in choosing the right technology for BMTC operations
✓ Battery Swapping Technology, Fast Charging, Pentagraph charging
• Limited range per charge puts restriction in deploying the EV buses in all schedules
• Limitation in terms of HT lines and dedicated feeders for 100% reliability
❖ Maximum 20 buses can be charged at a single point of time
• Limited manufacturing capacityAPPROACH ADOPTED
• Innovative Contracting Structure proposed to overcome the challenges
❖ Gross Cost Model - No upfront investment from the STU
✓ GoI Subsidy – 60% of the bus cost; balance to be borne by operator (upfront)
❖ Procurement of service and not the product (technology agnostic)
✓ Operator to run the EV Buses for 10 years and will be paid per km of travel
❖ Service Level Agreement (SLA) fulfillment driven contract
ROAD MAP
• Proposed to hire 500 non AC – EV buses on Gross Cost Model without subsidy
• Proposed to replace all the diesel buses (fleet) in a phased manner
✓ 30% by 2021; 50% by 2023; 100% by 2025READINESS OF INFRASTRUCTURE FOR SCALING UP–
GRID CONECTIVITY
• Most of the existing 11 KV feeder mains
overloaded beyond exigency capacity or with
50% capacity
• To increase number of concurrent bus charging
there would be a need for Dedicated Feeder
Main .
❖ Maximum No of concurrent Bus charging
– 30 BusCHALLENGES FOR SCALING UP
• High Capital Cost
• GST
• Mapping of feeder line distribution with capacity utilization
• Need for firming up of Standards for Charging Infrastructure :
❖ Interoperability
• Integrated planning of Transport and ESCOM
• Raw material availability and lack of cell manufacturing capacity in India
• EV Production constraint in market to meet the demandYou can also read