Bathymetry Modelling from Altimeter-Based Gravity and Satellite Multispectral Images in the North Adriatic
←
→
Page content transcription
If your browser does not render page correctly, please read the page content below

Bathymetry Modelling from Altimeter-Based Gravity and Satellite
 Multispectral Images in the North Adriatic

 Ljerka VRDOLJAK and Jelena KILIĆ PAMUKOVIĆ, Croatia

 Key words: Digital Bathymetric Model, Satellite Altimetry, Satellite Derived Bathymetry

 SUMMARY

 Topography of the seafloor is an important parameter in almost all maritime related research.
 Traditional shipboard bathymetry methods are time and money consuming. Bathymetry LiDAR
 is optimal method for deriving depth of shallow sea areas but also quite expensive. Alternative
 methods for bathymetric mapping are low cost satellite remote sensing methods.
 Satellite altimetry opened the possibility to map topography of the seafloor on the global scale.
 However, these data have a coarse resolution and their quality decay in coastal areas. Satellite
 Derived Bathymetry SDB refers to methods to estimate the depth from multispectral satellite
 images and are widely used in shallow coastal sea areas. SDB is limited by the extinction depth
 up to which it is possible to retrieve bathymetric data.
 In this paper, digital bathymetry model of the study area in the North Adriatic is estimated
 combining data from altimeter-based gravity anomalies and satellite multispectral images.
 Depth is predicted using the Gravity Geologic Method and density contrast between seafloor
 and seawater is determined by control points composed of soundings from nautical chart.
 Bathymetry of shallow, coastal areas is enhanced by depth data derived from multispectral
 images using Satellite Derived Bathymetry methods. Model is validated against data from
 nautical charts. As compared to traditional survey methods, the model is time and cost-effective
 and has a high correlation with charted soundings.

Bathymetry Modelling from Altimeter-Based Gravity and Satellite Multispectral Images in the North Adriatic (10940)
Ljerka Vrdoljak and Jelena Kilić (Croatia)
FIG e-Working Week 2021
Smart Surveyors for Land and Water Management - Challenges in a New Reality
Virtually in the Netherlands, 21–25 June 2021

Bathymetry Modelling from Altimeter-Based Gravity and Satellite
 Multispectral Images in the North Adriatic

 Ljerka VRDOLJAK and Jelena KILIĆ PAMUKOVIĆ, Croatia

 1. INTRODUCTION

 Hydrography is the branch of applied sciences which deals with the measurement and
 description of the physical features of oceans, seas, coastal areas, lakes, and rivers, as well as
 with the prediction of their change over time (IHO, 2019). Bathymetry is a part of hydrography
 which deals with the depth and modeling of seafloor topography. Bathymetry underpins all
 maritime activities, from the primary purpose of safety of navigation to environmental
 protection and scientific research. Classical acoustic bathymetric methods or LiDAR are high-
 quality data able to meet the requirements set by IHO standards for hydrographic surveys (IHO,
 2020); however, these methods are time and money consuming especially in shallow coastal
 areas.
 As an alternative, depths can be estimated from remotely sensed satellite data. Satellite
 altimetry opened the possibility to model the topography of seafloor on a global scale. The first
 global bathymetric model estimated from satellite altimetry and sparse ship soundings was
 Smith and Sandwell model in 1997 (Sandwell and Smith, 1997). Methods to estimate
 bathymetry from altimetry derived gravity anomalies can cover all depth range. However, they
 have a coarse spatial resolution of 6 kilometers, and their quality decreases in coastal areas.
 Global bathymetric models are mostly based on bathymetry predicted from altimetry and
 augmented with direct measurements (Tozer et. al., 2014).
 Satellite Derived Bathymetry SDB is a method of predicting the depth of shallow sea areas
 from multispectral satellite images. SDB dates to the 1970s when the correlation of water depths
 and pixels of a multispectral image was modeled (Lyzenga, 1978). Supporting a variety of
 maritime research: maps reconnaissance, tsunami modeling, habitat mapping, etc., Satellite
 Derived Bathymetry SDB is widely used to estimate the depths of sea areas shallower than 30
 meters with up to submeter spatial resolution depending on a satellite sensor.
 In this paper we explored the possibility to enhance the quality of bathymetry predicted from
 satellite - altimetry derived gravity anomalies with Satellite Derived Bathymetry SDB. A
 combined algorithm to estimate the bathymetry is tested in the coastal area of Medulin bay
 located on the eastern side of the Istrian peninsula in the North Adriatic Sea.

 2. DATA AND METHODOLOGY

 2.1 Study Area

 In this paper, bathymetry is predicted by combining data from gravity model, multispectral
 satellite images, and data from the nautical chart over shallow waters of Medulin Bay and

Bathymetry Modelling from Altimeter-Based Gravity and Satellite Multispectral Images in the North Adriatic (10940)
Ljerka Vrdoljak and Jelena Kilić (Croatia)
FIG e-Working Week 2021
Smart Surveyors for Land and Water Management - Challenges in a New Reality
Virtually in the Netherlands, 21–25 June 2021

adjacent sea area located in the North Adriatic Subbasin along the eastern coast of the Istrian
 Peninsula with depths ranging up to 50 meters (Figure 1).

 Figure 1. Study area around Medulin bay is highlighted in red. Bathymetry is derived from
 GEBCO 2020 digital bathymetric model (GEBCO, 2020).

 2.2 Satellite Altimetry-Derived Gravity Anomalies

 Satellite altimetry-derived gravity anomalies were obtained from Scripps Institute of
 Oceanography SIO model V 29.1. derived from altimetry data including data from CryoSat and
 Jason-1 missions. The model has a 1-minute resolution in WGS 84 coordinate system and
 accuracy of about 2 mGal (Sandwell et al., 2014).

 2.3 Multispectral Satellite Images

 The Landsat 8 Operational Land Imager and Thermal Infrared Sensor Collection 2 – Level 1
 data collected on September 9, 2020, were downloaded from USGS EarthExplorer in GeoTIFF
 format in Universal Transverse Mercator (UTM) Zone 33 North projection (URL 1). The
 Landsat 8 satellite L8 orbits the Earth at an altitude of 705 kilometers in a sun-synchronous
 orbit with 16 days repeat cycle. L8 carries a two-sensor payload: The Operational Land Imager
 OLI and Thermal Infrared Sensor TIRS are collecting data in 11 spectral bands at nadir, with a
 185 km large footprint, and an image resolution ranging from 15 m to 100 m depending on a
 particular waveband (USGS, 2019). The multispectral bands used for bathymetry prediction
 were blue band 2 (0.45 μm-0.51μm), green band 3 (0.53 μm -0.59 μm), and shortwave infrared
 (SWIR)-1 band 6 (1.57 μm – 1.65 μm), all with 30 meters resolution.
 The Sentinel 2 Multi-Spectral Instrument MSI - Level 1C data collected on March 16, 2020,
 were downloaded from Copernicus Open Access Hub in JPEG2000 format in Universal

Bathymetry Modelling from Altimeter-Based Gravity and Satellite Multispectral Images in the North Adriatic (10940)
Ljerka Vrdoljak and Jelena Kilić (Croatia)
FIG e-Working Week 2021
Smart Surveyors for Land and Water Management - Challenges in a New Reality
Virtually in the Netherlands, 21–25 June 2021
Transverse Mercator (UTM) Zone 33 North projection (URL 2). Two identical SENTINEL-2
 satellites phased at 180° to each other orbit the Earth in a sun-synchronous orbit at a mean
 altitude of 786 km with 5 days repeat cycle (ESA, 2015). MSI collects data at the nadir in 13
 spectral bands, with a 290 km swath width, and an image resolution ranging from 10 m to 60
 m depending on a waveband. The multispectral bands used for bathymetry prediction were blue
 band 2 (0.45 μm-0.52μm), green band 3 (0.54 μm -0.58 μm) with 10 meters resolution, and
 shortwave infrared (SWIR)-1 band 11 (1.57 μm – 1.66 μm) with 20 meters resolution.

 Table 1. Comparison of LANDSAT-8 and SENTINEL-2 satellite missions (ESA, 2015;
 USGS,2019)
 LANDSAT 8 SENTINEL-2
 Mission Lifetime 2013 - present 2A 2015 – present
 2B 2017 - present
 Instrument principle Pushbroom Pushbroom
 Repeat cycle [days] 16 5
 Swath width [km] 185 290
 Spectral bands 11 13
 Spatial resolution [m] 15, 30, 100 10, 20, 60

 2.4 Control and Check Points

 Data from coastal nautical chart Pula-Kvarner 100-16 (HHI, 2016): chart soundings, contour
 data, and coastline were used to estimate, and check the quality of bathymetric data estimated
 from gravity data and multispectral satellite images. In Figure 2, black circles are control points
 used to estimate bathymetry, and green triangles are the check points used for the validation of
 the bathymetric model.

 Figure 2. Control and check points collected from nautical chart

Bathymetry Modelling from Altimeter-Based Gravity and Satellite Multispectral Images in the North Adriatic (10940)
Ljerka Vrdoljak and Jelena Kilić (Croatia)
FIG e-Working Week 2021
Smart Surveyors for Land and Water Management - Challenges in a New Reality
Virtually in the Netherlands, 21–25 June 2021
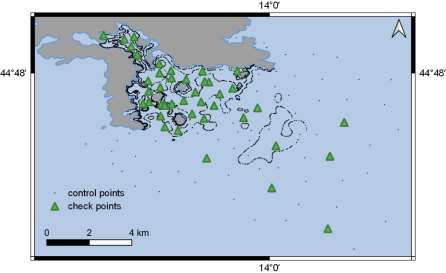
A nautical chart is a compilation of bathymetric data acquired by the Croatian Hydrographic
 Institute in the years 1973-2015 by means of different multibeam and single-beam systems for
 hydrographic purposes. Quality of data corresponds to the Zone of confidence ZOC B defined
 by the International Hydrographic Organization IHO (IHO, 2020). Chart soundings refer to
 Chart vertical datum, Mean Low Lower Water MLLW. The satellite altimetry-derived gravity
 is based on the Mean Sea Level (MSL), so chart soundings were converted to MSL determined
 from tide gauge stations.

 2.4 Gravity-Geologic Method GGM

 The Gravity-Geologic Method was originally developed to estimate the depth of bedrock under
 a glacial drift deposit (Ibrahim and Hinze, 1972). Regarding the density contrast between the
 seawater and seabed, the method was adapted to estimate the depth of the seabed from gravity
 data (Kim et al., 2010, Xiang et al, 2017, Yeu et al., 2018). Figure 3 illustrates the principle of
 the GGM method.

 Figure 3. Geometry of Gravity-Geologic Method (GGM) (Kim et al., 2011)

 In general, observed gravity anomalies gobs consists of short wavelength gravity gshort caused by
 local variations in seabed and long wavelength gravity glong caused by deeper masses expressed
 by following equation:
 gobs = gshort + glong (1)

 Short wavelength gravity field is estimated by using a simple Bouguer slab formula at control
 points j with known depth Dj:
 gshort(j)=2πG(Δρ)(Dj-D) (2)

 where:
 G is the gravitational constant (G=6.672x10⁻⁸cm3/gs2),
 Δρ is density contrast in g/cm3,

Bathymetry Modelling from Altimeter-Based Gravity and Satellite Multispectral Images in the North Adriatic (10940)
Ljerka Vrdoljak and Jelena Kilić (Croatia)
FIG e-Working Week 2021
Smart Surveyors for Land and Water Management - Challenges in a New Reality
Virtually in the Netherlands, 21–25 June 2021

Dj is measured depth at control points (j), and D is the deepest depth of the control points. Long wavelength gravity is calculated at control points glong (j) by subtracting the short wavelength gravity from observed gravity: glong (j) = gobs (j) - gshort(j) (3) Long wavelength gravity at unknown points glong(i) can be interpolated from long wavelength gravity at control points glong (j) and short wavelength gravity at unknown points gshort(i) can be determined from observed gravity field: gshort(i) = gobs(i) – glong(i) (4) By rearranging the equation 2, depths at unknown points D(i) can be estimated from short wavelength gravity at unknown points gshort(i) as follows: ℎ ( ) ( ) = 2πGΔρ + (5) 2.5. Satellite Derived Bathymetry SDB Empirical band ratio Satellite Derived Bathymetry (SDB) techniques are widely used for their simplicity although the model must be calibrated using control points with known depth. The concept underlying the log-ratio algorithm is that the bottom radiance of one band will decay with depth faster than of another band. Bathymetry was estimated using the empirical band ratio technique and Stumpf (2003) formula: ln( ( )) = 1 (ln( ( ))) − 0 (6) Where: D is depth estimation, m1 and m0 are empirically determined gain and offset, Lobs(λi) is the observed radiance of blue band, and Lobs(λj) is the observed radiance of green band. 2.6. Combined Bathymetric Algorithm Due to altimetry limitations, the quality of bathymetric data predicted from gravity anomalies will decay in coastal areas. Satellite Derived Bathymetry based on multispectral images is limited by the extinction depth of about 30 meters. In this paper we explore the possibility to enhance the quality of the topography of the seabed estimated from altimeter-derived gravity anomalies in coastal areas with Satellite Derived Bathymetry based on multispectral satellite images. Figure 4 shows the combined algorithm for bathymetry estimation. A combined digital bathymetry model with 100 meters resolution is estimated from altimeter derived-gravity anomalies and multispectral satellite imagery. Soundings, points with known depth, are used as control data to calibrate the model. Bathymetry Modelling from Altimeter-Based Gravity and Satellite Multispectral Images in the North Adriatic (10940) Ljerka Vrdoljak and Jelena Kilić (Croatia) FIG e-Working Week 2021 Smart Surveyors for Land and Water Management - Challenges in a New Reality Virtually in the Netherlands, 21–25 June 2021
Figure 4. Combined algorithm for bathymetry prediction

 Firstly, the digital bathymetric model DBM is estimated from altimeter derived-gravity data
 using the Gravity Geologic Method GGM described in section 2.4. and interpolated to 100
 meters grid.

Bathymetry Modelling from Altimeter-Based Gravity and Satellite Multispectral Images in the North Adriatic (10940)
Ljerka Vrdoljak and Jelena Kilić (Croatia)
FIG e-Working Week 2021
Smart Surveyors for Land and Water Management - Challenges in a New Reality
Virtually in the Netherlands, 21–25 June 2021
The procedure to derive bathymetric data from multispectral satellite images includes the
 following steps (Pe’eri et al., 2014; IHO and IOC, 2018): 1. Pre-Processing of the satellite
 imagery that includes corrections for environmental conditions; 2. Low Pass Filtering of the
 satellite images to remove the “Spackle noise”; 3. Land/Water separation; 4. Identifying the
 Extinction Depth (De) up to which it is possible to retrieve bathymetric information; 5.
 Applying SDB Algorithm. SDB algorithm is Stumpf’s (2003) log ratio algorithm applied to the
 blue and green band. The result is Pseudo depth that needs to be vertically referenced using the
 control points. Vertically referenced satellite derived digital bathymetric model (SDB DBM)
 has a resolution of input satellite multispectral images.
 Depth data in marine areas deeper than the depth limit of the Satellite Derived Bathymetry or
 Extinction depth (De) are retrieved from digital bathymetric model estimated from gravity data
 (gDBM), then augmented with satellite derived bathymetry model SDB DBM, and interpolated
 to Combined Digital Bathymetric Model with 100 meters resolution.

 2.7. Quality Control

 To estimate the quality of the digital bathymetric models, bathymetric data is commonly
 compared to check points with known depth. Root Mean Square Error RMSE and Pearson
 coefficient which determines the correlation between of the model’s depth and control data set,
 were calculated to validate the model.

 3. RESULTS

 The bathymetric model of the coastal marine area around the Medulin bay located in the North
 Adriatic along the eastern coast of the Istrian peninsula was estimated using the combined
 algorithm for bathymetry estimation. A combined bathymetric model was calculated using
 altimetry derived gravity anomalies, multispectral satellite images, and nautical chart data. A
 set of check points from coastal chart 100 -16, were used to determine the quality of calculated
 bathymetric models.
 Figures 5-7 show the results of the combined algorithm for bathymetry prediction.
 A density contrast of 10 000 kg/m3 was chosen to estimate the bathymetry from SIO altimeter
 based-gravity anomaly model V.29.1. using the Gravity Geologic Method. 1 arc minute
 bathymetric model (Figure 5) in WGS 84 coordinate system with depths referring to the Mean
 Sea Level MSL was projected to Universal Transverse Mercator 33N (UTM 33 N) and
 interpolated to 100 meters grid (gDBM). The correlation of the gDBM with check points was
 0.92 and RMSE was 6.64 meters.

Bathymetry Modelling from Altimeter-Based Gravity and Satellite Multispectral Images in the North Adriatic (10940)
Ljerka Vrdoljak and Jelena Kilić (Croatia)
FIG e-Working Week 2021
Smart Surveyors for Land and Water Management - Challenges in a New Reality
Virtually in the Netherlands, 21–25 June 2021
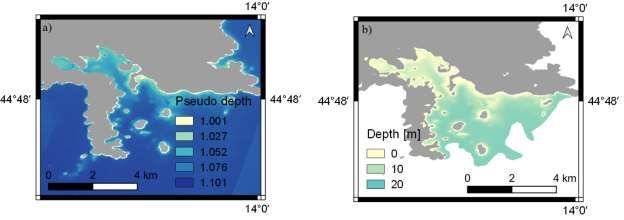
Figure 5. Bathymetric model (1') estimated from SIO gravity anomalies and chart data

 Landsat 8 and Sentinel-2 multispectral imagery MSI were used to estimate the bathymetry of
 the shallow coastal area using the log-ratio method. Both satellites have passive optical sensors
 that collect solar radiation reflected from the Earth, in this case from the seafloor. Satellite
 Derived Bathymetry is limited by extinction depth up to which bathymetric data can be
 estimated. In the study area, the extinction depth was estimated to be 20 meters. The result of
 the Stumpf (2003) formula applied to blue and green spectral was the Pseudo depth (Figure 6a)
 which needed to be vertically referenced using the set of control points. In this paper, chart data
 were used as control points. Gain m1 and offset m0 were determined using the linear regression;
 for Landsat 8 data m1=1498.1 and m0=-1489.8 and for Sentinel 2 m1=303.53 and m0=-315.01.
 Results of the SDB algorithm were two models of a coastal marine area with depths shallower
 than 20 meters: Landsat 8 with 30 meters resolution and Sentinel 2 (Figure 6b) with 10 meters
 resolution. Landsat 8 had an RMSE of 4.45 m and correlation of 0.75 while Sentinel 2 had an
 RMSE of 2.58 and a correlation of 0.91. As compared to check data from coastal nautical chart
 100-16 Sentinel 2 data had higher quality, so these data were the input parameter for the
 calculation of a Combined Digital Bathymetric Model (CDBM).

 Figure 6. Satellite Derived Bathymetry using Sentinel 2 images: a) Pseudo depth, b) 10 meters
 bathymetric model

Bathymetry Modelling from Altimeter-Based Gravity and Satellite Multispectral Images in the North Adriatic (10940)
Ljerka Vrdoljak and Jelena Kilić (Croatia)
FIG e-Working Week 2021
Smart Surveyors for Land and Water Management - Challenges in a New Reality
Virtually in the Netherlands, 21–25 June 2021
Depth deeper than 20 meters from bathymetric estimated from gravity gDBM were augmented
 with data from Sentinel-2 and interpolated to Combined Digital Bathymetric Model (CDBM)
 that runs from the coast up to 50 meters depth.
 The combined model has a resolution of 100 meters in Universal Transverse Mercator UTM 33
 coordinate system with depths refer to the Mean Sea Level MSL. (Figure 7).

 Figure 7. Combined digital bathymetric model of Medulin bay with 100 meters resolution

 Model data were interpolated to the location of check points resulting in two sets of depth in
 check points: Chart depth and Model depth. The correlation coefficient between these two sets
 is 0.97 and the RMSE of the model calculated from the residuals is 4.73 meters (Table 2).

 Table 2. Quality of the bathymetric models

 RMSE Correlation
 [m] Coefficient
 LANDSAT 8* 4.45 0.75
 SENTINEL 2* 2.58 0.91
 gDBM (GGM) 6.64 0.92
 CDBM (GGM_SDB) 4.73 0.97
 *Area shallower than 20 meters

Bathymetry Modelling from Altimeter-Based Gravity and Satellite Multispectral Images in the North Adriatic (10940)
Ljerka Vrdoljak and Jelena Kilić (Croatia)
FIG e-Working Week 2021
Smart Surveyors for Land and Water Management - Challenges in a New Reality
Virtually in the Netherlands, 21–25 June 2021
4. CONCLUSION

 As compared to classic bathymetric methods, satellite remote sensing methods are cost and time
 effective.
 Satellite altimetry opened the possibility to globally map the topography of the seafloor.
 However, due to altimeter limitations, the quality of the bathymetric data decreases in the
 coastal areas. Satellite Derived Bathymetry SDB is a method of estimating the depth from
 multispectral images in shallow sea areas. SDB methods are limited by an extinction depth of
 about 30 meters.
 In this paper, a combined bathymetric algorithm was presented. Bathymetry that was estimated
 from altimeter derived-gravity anomalies has been augmented with satellite derived bathymetry
 SDB data to improve the quality of the model in the shallow coastal areas.
 The model was tested and validated in the study area in North Adriatic. The topography of the
 seafloor in the Medulin bay and adjacent sea area with depths up to 50 meters was modeled
 using the combined algorithm for bathymetry prediction. The model was validated using the
 chart soundings.
 The correlation coefficient of the bathymetric model estimated from SIO gravity anomalies
 V.29.1 using the Gravity Geologic Method with density contrast of 10 000 kg/m3 was 0.75 and
 Root Mean Square Error (RMSE) was 6.64 meters.
 In sea areas shallower than 20 meters, depths were derived from Landsat 8 and Sentinel-2
 imagery using the log-ratio method. Landsat bathymetric model had 30 meters resolution and a
 correlation with chart soundings was 0.75. The Sentinel-2 bathymetric model had 10 meters
 resolution, and a correlation with chart soundings was 0.91.
 Bathymetry derived from gravity was augmented with Sentinel data in areas shallower than 20
 meters in a Combined Digital Bathymetric Model with 100 meters resolution in UTM 33N
 coordinate system with depth referring to Mean Sea Level MSL. Correlation of the Combined
 Bathymetric Model was 0.97 and RMSE was 4.73 meters. Quality of the bathymetric model
 was improved by augmenting the model estimated from gravity with Satellite Derived
 Bathymetry.

 REFERENCES

 Department of the Interior U.S. Geological Survey, 2019, Landsat 8 (L8) Data Users
 Handbook, Available online at: https://www.usgs.gov/media/files/landsat-8-data-users-
 handbook

 European Space Agency, 2015, Sentinel-2 User Handbook, Available online at:
 https://sentinel.esa.int/web/sentinel/user-guides/sentinel-2-msi/document-library/-
 /asset_publisher/Wk0TKajiISaR/content/sentinel-2-user-handbook

Bathymetry Modelling from Altimeter-Based Gravity and Satellite Multispectral Images in the North Adriatic (10940)
Ljerka Vrdoljak and Jelena Kilić (Croatia)
FIG e-Working Week 2021
Smart Surveyors for Land and Water Management - Challenges in a New Reality
Virtually in the Netherlands, 21–25 June 2021
GEBCO Compilation Group, 2020, GEBCO 2020 Grid, doi:10.5285/a29c5465-b138-234d-
 e053-6c86abc040b9

 Hydrographic Institute of the Republic of Croatia, 2016, Coastal navigational chart Pula-
 Kvarner 100-16

 Ibrahim, A., Hinze, W.J., 1972, Mapping buried bedrock topography with gravity, Ground
 Water 10(3), 18–23, NGWA

 International Hydrographic Organization (IHO), Intergovernmental Oceanographic
 Commission, 2018, The IHO-IOC GEBCO Cookbook, 416 pp, Monaco, IHO

 International Hydrographic Organization, 2019, S-32 IHO - Hydrographic Dictionary, available
 online at: http://iho-ohi.net/S32/

 International Hydrographic Organization , 2020, IHO Standard for hydrographic surveys S-44
 6th edition, International Hydrographic Organization, available online at:
 https://iho.int/uploads/user/pubs/Drafts/S-44_Edition_6.0.0-Final.pdf

 International Hydrographic Organization, 2020, S-67 Mariner’s Guide to Accuracy of depth
 Information in electronic Navigational Charts (ENC), Available online at:
 https://iho.int/en/new-guide-on-accuracy-of-depth-information-in-electronic-navigational-
 charts-encs

 Kim, J.W., von Frese, R.R.B., Lee, B.Y., 2011, Altimetry-Derived Gravity Predictions of
 Bathymetry by the Gravity-Geologic Method, Pure Appl. Geophys, 168, 815–826

 Lyzenga, D., 1978, Passive Remote-Sensing Techniques for mapping water depth and bottom
 features, Applied Optics, 17/3, 379-383, OSA Publishing

 Peeri, S., Azuike, C., Parrish, C., 2013, Satellite-derived bathymetry a reconnaissance tool for
 hydrography, Hydro International, 1119, 16-19, Geomares

 Sandwell, D., Smith, W.H.F., 1997, Global Sea Floor Topography from satellite Altimetry and
 Ship Depth Soundings, Science 277, 1956-1962, AAAS

 Sandwell, D. T., Müller, R. D., Smith, W. H. F., Garcia, E., Francis, R., 2014, New global
 marine gravity model from Cryo-Sat-2 and jason-1 reveals buried tectonic structure, Science,
 346, 65-67, AAAS

 Stumpf, R. P., Holderied, K., Sinclair, M., 2003, Determination of water depth with high‐
 resolution satellite imagery over variable bottom types, Limnology and Oceanography, 48,
 547-556, ASLO

 Tozer, B., Sandwell, D. T., Smith, W. H. F., Olson, C., Beale, J. R., Wessel, P., 2019, Global
 bathymetry and topography at 15 arc sec: SRTM15+, Earth and Space Science,6, AGU

Bathymetry Modelling from Altimeter-Based Gravity and Satellite Multispectral Images in the North Adriatic (10940)
Ljerka Vrdoljak and Jelena Kilić (Croatia)
FIG e-Working Week 2021
Smart Surveyors for Land and Water Management - Challenges in a New Reality
Virtually in the Netherlands, 21–25 June 2021
Xiang, X., Wan, X., Zhang, R., Li, Y., Sui, X., Wang, W., 2017, Bathymetry Inversion with
 the Gravity-Geologic Method: A Study of Long-Wavelength Gravity Modeling Based on
 Adaptive Mesh, Marine Geodesy, 40:5, 329-340, Taylor and Francis

 Yeu, Y., Yee, J.J., Yun, H.S., Kim, K.B., 2018, Evaluation of the Accuracy of Bathymetry on
 the Nearshore Coastlines of Western Korea from Satellite Altimetry, Multi-Beam, and
 Airborne Bathymetric LiDAR, Sensors, 18(9), 2926, MDPI

 URL 1: https://earthexplorer.usgs.gov/

 URL 2: https://scihub.copernicus.eu/dhus/#/home

 BIOGRAPHICAL NOTES

 Ljerka Vrdoljak has been a hydrographic surveyor at Hydrographic Institute of the Republic of
 Croatia since 2014. She has a masters degree in Geodesy and Geoinformatics from Faculty of
 Geodesy, University of Zagreb and is a PhD candidate with research interest in bathymetry
 mapping by remote sensing.

 Jelena Kilić Pamuković is an assistant professor. She has been employed at the Faculty of Civil
 Engineering, Architecture and Geodesy of the University of Split, Croatia since 2013 and in the
 same year has enrolled in PhD in Geodesy and Geoinformatics at the Faculty of Geodesy,
 University of Zagreb. In 2019 she got her PhD in the field of Land Menagement. As an author
 and co-author, she published more than 20 publications.

 CONTACTS

 Ljerka Vrdoljak
 Hydrographic Institute of the Republic of Croatia
 Zrinsko – Frankopanska 161
 Split
 CROATIA
 Tel. +38521308821
 Email: ljerka.vrdoljak@hhi.hr

Bathymetry Modelling from Altimeter-Based Gravity and Satellite Multispectral Images in the North Adriatic (10940)
Ljerka Vrdoljak and Jelena Kilić (Croatia)
FIG e-Working Week 2021
Smart Surveyors for Land and Water Management - Challenges in a New Reality
Virtually in the Netherlands, 21–25 June 2021
You can also read