Bioaccumulation, Biodistribution, Toxicology and Biomonitoring of Organofluorine Compounds in Aquatic Organisms - MDPI
←
→
Page content transcription
If your browser does not render page correctly, please read the page content below
International Journal of
               Molecular Sciences

Review
Bioaccumulation, Biodistribution, Toxicology and
Biomonitoring of Organofluorine Compounds in
Aquatic Organisms
Dario Savoca              and Andrea Pace *

                                          Dipartimento di Scienze e Tecnologie Biologiche, Chimiche e Farmaceutiche (STEBICEF), Università Degli Studi
                                          di Palermo, 90100 Palermo, Italy; dario.savoca@unipa.it
                                          * Correspondence: andrea.pace@unipa.it; Tel.: +39-091-23897543

                                          Abstract: This review is a survey of recent advances in studies concerning the impact of poly- and
                                          perfluorinated organic compounds in aquatic organisms. After a brief introduction on poly- and
                                          perfluorinated compounds (PFCs) features, an overview of recent monitoring studies is reported
                                          illustrating ranges of recorded concentrations in water, sediments, and species. Besides presenting
                                          general concepts defining bioaccumulative potential and its indicators, the biodistribution of PFCs
                                          is described taking in consideration different tissues/organs of the investigated species as well as
                                          differences between studies in the wild or under controlled laboratory conditions. The potential
                                          use of species as bioindicators for biomonitoring studies are discussed and data are summarized
                                          in a table reporting the number of monitored PFCs and their total concentration as a function of
                                          investigated species. Moreover, biomolecular effects on taxonomically different species are illustrated.
                                          In the final paragraph, main findings have been summarized and possible solutions to environmental

                                   threats posed by PFCs in the aquatic environment are discussed.
Citation: Savoca, D.; Pace, A.
Bioaccumulation, Biodistribution,         Keywords: polyfluorinated compounds; perfluorinated compounds; perfluoroalkylic compounds; PFC;
Toxicology and Biomonitoring of           ecotoxicity; biomagnification; bioconcentration; environmental impact; pollution; fluorine chemicals
Organofluorine Compounds in
Aquatic Organisms. Int. J. Mol. Sci.
2021, 22, 6276 . https://doi.org/
10.3390/ijms22126276                      1. Introduction
                                                The peculiar physicochemical properties of fluorinated organic molecules have opened
Academic Editor: Claudiu T. Supuran
                                          the way to their large diffusion since the second half of the last century [1]. In particular,
                                          organic molecules containing several fluorine atoms along the carbon skeleton, such as poly-
Received: 14 May 2021
                                          and perfluoroalkyl substances (PFAS), have been applied as refrigerants, foam-blowing
Accepted: 8 June 2021
                                          agents, fire suppressors as well as in fluoropolymeric textiles, paints, and materials for their
Published: 11 June 2021
                                          oil- and water-resistant features [1–3]. Together with their industrial diffusion, this family
                                          of chemicals, which includes more than 5000 highly fluorinated aliphatic compounds, has
Publisher’s Note: MDPI stays neutral
with regard to jurisdictional claims in
                                          found different applications also in consumer products, from cookware and carpets to
published maps and institutional affil-
                                          food-packaging and electronics [2,4].
iations.
                                                In this review, we will use the acronym PFCs referring to poly- and perfluorinated
                                          compounds where the fluorine atoms are located in different parts of the considered
                                          molecule (including alkylic moieties), while the term PFAS will be used to indicate a
                                          subclass of PFCs consisting only of poly- and perfluoroalkyl substances.
                                                Unfortunately, the initial underestimation of their environmental impact, together
Copyright: © 2021 by the authors.
                                          with their large use has caused in the last decades an increased level of environmental
Licensee MDPI, Basel, Switzerland.
                                          contamination from poly- and perfluorinated compounds (PFCs), and in particular from
This article is an open access article
distributed under the terms and
                                          PFAS. In fact, due to the chemical stability of the C-F bond, PFAS are resistant to degrada-
conditions of the Creative Commons
                                          tion and represent one of the major classes of persistent organic pollutants (POPs) diffused
Attribution (CC BY) license (https://     in the environment [5,6]. However, their environmental behavior, bioaccumulation, and
creativecommons.org/licenses/by/          toxicological activity, usually follow different paths compared to other widely studied
4.0/).                                    POPs (e.g., organochlorine and organobromine compounds) [7]. The class of PFAS includes

Int. J. Mol. Sci. 2021, 22, 6276 . https://doi.org/10.3390/ijms22126276                                         https://www.mdpi.com/journal/ijms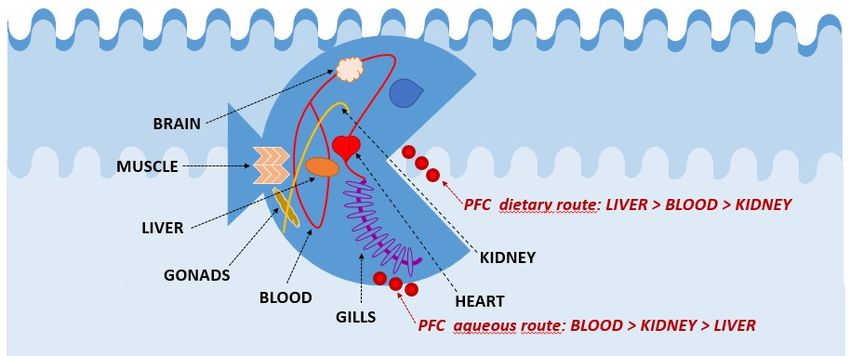
Int. J. Mol. Sci. 2021, 22, 6276                                                                                            2 of 26

                                   perfluoroalkylic acids (PFAA), with perfluoroalkanoic carboxylic acids (PFCA) and per-
                                   fluoroalkane sulphonic acids (PFSA) being the most frequently studied compounds [8].
                                   In the new millennium, research activities of laboratories, regulatory authorities, and in-
                                   dustry have converged to classify, monitor, and regulate these pollutants to contrast their
                                   environmental impact [9].
                                        These activities include the assessment of the qualitative state of the environment,
                                   measured by ecological bioindicators to evaluate the stressful influence of PFAS, particu-
                                   larly in aquatic environments. To minimise the impact of PFAS in aquatic ecosystems and
                                   along trophic networks, it is essential to verify their presence in various environmental
                                   matrices [1,10–13] and to study their effects on organisms [8,14–19].
                                        For the determination of PFAS in aquatic organisms, several studies have been car-
                                   ried out and more sensitive, rapid, and robust extraction and analytical methods have
                                   been recently developed [20–24]. Moreover, literature on PFAS environmental impact is
                                   continuously foraged by new research on their bioconcentration [25], health effects [26],
                                   human exposure, and legal regulation [8]. The purpose of this review is to provide an
                                   organized overview of the impact of PFAS, with a specific focus on aquatic biota, evaluated
                                   through studies on biomonitoring, determination of contamination and biodistribution
                                   profile, evaluation of their bioaccumulative potential, assessment of biomolecular effects
                                   caused by these pollutants, and their aquatic half-life. A critical analysis of literature
                                   data is illustrated in each relevant section and summarized in the conclusive paragraph
                                   highlighting unresolved issues and offering a perspective view for future research.
                                        The fate of PFAS after their release into the environment depends on their transport,
                                   partitioning, and transformation processes and its assessment is crucial to define measures
                                   to contrast their impact. Due to atmospheric and oceanic transport PFAS have been found
                                   in areas far away from the source of contamination [27,28] thus, nowadays, open waters
                                   and their sediments are considered relevant pools of these persistent pollutants [3,29–31].
                                        The PFAS transport cycle depends on the structure and physicochemical properties of
                                   the substance itself as well as on several environmental conditions, including the content
                                   of organic carbon, temperature, salinity, and concentration of atmospheric oxidants in the
                                   aquatic environment [32,33]. Despite PFAS and their precursors could be subjected to a
                                   variety of environmental and biological transformations in different compartments [34,35],
                                   they possess a substantial bioaccumulation potential that varies between individual organ-
                                   isms and species and depends both on the mechanisms of active transport of the organisms
                                   and on the nature of the different PFAS compounds [36,37].
                                        Assessing the environmental fate of PFAS is crucial to evaluate the risk of exposure, to
                                   such persistent pollutants, of animals up to the apex of the trophic network, especially con-
                                   sidering that intake often occurs through ingestion. In fact, in addition to exposure linked
                                   to contamination of the physical environment (air, water, soil), the direct ingestion of a con-
                                   taminated food significantly increases the assimilation of the pollutant [38–46]. For humans,
                                   other routes of PFAS intake are possible through direct exposure to the polluted environ-
                                   ment (e.g., inhalation of dust or atmospheric particulate from industrial sources) [38,47–52]
                                   in addition to the ingestion of contaminated beverages and food, including wild and
                                   farmed seafood [1,53–55]. For instance, a very recent study based in Tanzania has reported
                                   a PFAS contamination level in fish and seafood that would expose humans up to a three-
                                   fold amount of perfluorooctanesulfonic acid (PFOS), with respect to the tolerable dose,
                                   under the regular fish consumption regimen of 0.016–0.027 kg/capita/day [55]. A similar
                                   study, taking into account the contamination of flathead mullet (Mugil cephalus), Atlantic
                                   mackerel (Scomber scombrus), and European plaice (Pleuronectes Platessa), hake (Merluccius
                                   merluccius), and sea bass (Dicentrarchus labrax), has reported PFAS contamination levels that
                                   were above the tolerable daily intake for toddlers’ diet in Italy [56]. In this context, despite
                                   the Organization for Economic Cooperation and Development (OECD) has identified more
                                   than 4500 PFAS-related substances [57], only a few of them (
Int. J. Mol. Sci. 2021, 22, 6276 3 of 26
fluorinated substances in wildlife animals or marine mammals [58,59]. Additionally, it
is important to remark that the levels of seafood contamination due to the conservation
and transformation processes increase with the market demand of such products [60] thus,
considering the diffusion of PFAS in the environment, constant and extensive monitoring
of PFAS contamination is required to guarantee food safety to the consumers.
2. Solubility, Persistence and Aquatic Half-Life of PFCs
The solubility of PFCs and their bioavailability as freely dissolved substances in either
salty or freshwater play an important role in possible deviations between the nominal and
measured (under controlled experimental conditions) concentrations of the investigated
substance, posing the risk of potential underestimation of the toxic effect PFCs [61]. Indeed,
a slow dissolution process could lead to a slow accumulation and metabolization as well
as to an increase in the half-life of PFCs (due to the replacement of consumed PFC by
newly dissolved PFC). In this context it is important to highlight that, in addition to the
high absorption rate of PFCs in organic matter dispersed in water and aquatic species, the
ubiquity and persistence of PFCs in water, e.g., about 40 and 90 years for perfluorooctanoic
acid (PFOA) and PFOS, respectively, make these molecules difficult to eradicate [62,63].
Inside an aquatic organism, the half-life can depend on the type of metabolism and is
more sensitive to the type of functional groups. For instance, the presence of sulfonic or
carboxylic acid moieties can increase the half-life of the substance (regardless of the carbon
chain length) [63]. The half-life, is also affected by the type of isomer, as seen for PFOA’s
and perfluorononanoic acid’s (PFNA) isomers in rainbow trout [64]. In general, the half-life
and the rate of elimination from the aquatic organism of the different PFCs vary according
to: (i) the type of PFC and the levels of exposure concentration; (ii) the species and sex of
the organism; (iii) the type of predominant path of intake in the bloodstream (e.g., aqueous
or dietary); (iv) the organs or tissues involved (e.g., gills or intestinal wall); and (v) the
experimental design under controlled conditions.
Regarding the type of exposure, a shorter PFOS half-life (11–17 days) was recorded
in fish fed with contaminated food compared to half-life recorded after aqueous expo-
sure (29–35 days) [65]. Interestingly, PFAS kinetics were faster in northern leopard frog
(Rana pipiens) tadpoles, where the half-life ranged from 1.2 to 3.3 days for all investigated
chemicals: PFOS, perfluorohexanesulfonic acid (PFHxS), PFOA, and 6:2 fluorotelomer
sulfonate (6:2 FTS) [66]. Furthermore, particular attention and should be paid to bio-
transformation processes since PFCs metabolites could have longer half-lives than their
precursors, thus representing new candidates for biomonitoring [13].
The elimination times of PFCs also depend on the size of the organisms and its diet,
a factor that is crucial in the biomagnification processes since a chronic dietary intake
of PFCs is possible as the trophic level rises. For instance, the half-life of PFOS was
5 months in dolphins [67], 12–15 days in rainbow trout [32], and 29–31 days in marbled
flounder (Pseudopleuronectes yokohamae) [68]. Similarly, in juvenile rainbow trout, depura-
tion half-lives ranged from 3 to 43 days and increased with the number of perfluorinated
carbons present in the chemical, while the bioaccumulation decreased in the following
order: PFSAs > PFCAs > perfluoroalkyl phosphonic acid (PFPAs) showing preferential
partitioning into blood and liver [69].
Surprisingly, for wild species, the observed half-life of PFCs is longer, probably due to
the continuous status of pollution of the environment. For example, the 50% clearance of
PFOS from whole fish was greater than 100 days [29,36].
In this context, also the production of chemical alternatives to PFCs does not represent
a viable solution to the threats posed by PFCs impact. For instance, the half-life of 6:2
chlorinated polyfluorinated ether sulfonate (F-53B) (a fluorinated compound alternative to
PFOS) ranged around 10 days in zebrafish larvae indicating a high persistence potential in
aquatic organisms [70].Int. J. Mol. Sci. 2021, 22, x FOR PEER REVIEW 4 of 26
chlorinated polyfluorinated ether sulfonate (F-53B) (a fluorinated compound alternative
Int. J. Mol. Sci. 2021, 22, 6276 4 of 26
to PFOS) ranged around 10 days in zebrafish larvae indicating a high persistence potential
in aquatic organisms [70].
3.3.Bioaccumulative
BioaccumulativePotential
Potential
Theenvironmental
The environmentalimpact impact of ofPFAS-related
PFAS-relatedpollution
pollutionisisamplified
amplifiedby byPFAS
PFASstability
stability
whichleads
which leadstotoserious
seriousrisksrisksofof bioaccumulation
bioaccumulation in animals
in animals belonging
belonging to higher
to the the higher rank-
rankings
ings
in theintrophic
the trophic
network,network, especially
especially for aquatic
for aquatic organisms
organisms [11,12].
[11,12]. Recently,
Recently, a European
a European sur-
vey of persistent
survey toxic toxic
of persistent substances in seafood
substances has been
in seafood hasreported evaluating
been reported potentialpotential
evaluating threats
to publictohealth
threats publicdue to their
health dueassimilation [41]. For this
to their assimilation [41].reason,
For thisit reason,
is important to evaluateto
it is important
the bioaccumulative potential of such persistent pollutants
evaluate the bioaccumulative potential of such persistent pollutants as a function as a function of the species,
of the
their diet,their
species, anddiet,
living environment,
and considering
living environment, both wildboth
considering [12]wild
and [12]
farmed
andspecies
farmed[46]. In
species
this
[46].context, it is important
In this context, to understand
it is important if PFAS contamination
to understand in a giveninspecies
if PFAS contamination a givenderives
species
from a phenomenon
derives from a phenomenonof either direct
of either(absorption or ingestion)
direct (absorption or indirector(biomagnification)
or ingestion) indirect (biomag-
assimilation. It is, therefore,
nification) assimilation. It is,crucial to define
therefore, crucial thetovarious
define indicators
the various(and the differences
indicators (and the
among them) that allow for an overall assessment of the bioaccumulative
differences among them) that allow for an overall assessment of the bioaccumulative potential. In fact,
po-
despite the unique definitions of such indicators by the European
tential. In fact, despite the unique definitions of such indicators by the European Chemical Chemical Agency [71]
and
Agencyother[71]researchers
and otherin the field [72–75],
researchers the [72–75],
in the field bioconcentration, bioaccumulation,
the bioconcentration, and
bioaccumu-
biomagnification factors are not
lation, and biomagnification always
factors are determined in the samein
not always determined research
the same work, making
research it
work,
difficult
making to it compare
difficult toresults
compare between different
results between studies. In this
different review,Inwethis
studies. arereview,
attempting to
we are
organize
attempting andtodiscuss
organizerecent andliterature
discuss and recentcompare results
literature andfrom different
compare studies
results fromaccording
different
to concepts illustrated in Figure 1 for bioconcentration (BCF),
studies according to concepts illustrated in Figure 1 for bioconcentration (BCF), bioaccu- bioaccumulation (BAF),
biota–sediment accumulation (BSAF), biomagnification
mulation (BAF), biota–sediment accumulation (BSAF), biomagnification (BMF), and (BMF), and trophic magnification
(TMF)
trophicfactors, and to the
magnification (TMF)following
factors, definitions
and to theand equations.
following definitions and equations.
Figure1.1.Illustration
Figure Illustrationof
ofbioaccumulation
bioaccumulationprocesses.
processes.
Bioconcentrationfactor
Bioconcentration factor(BCF)
(BCF)
TheBCF
The BCFisisintended
intendedtoto evaluate
evaluate thethe uptake
uptake of aofsubstance
a substance through
through chemical
chemical expo-
exposure,
with
sure,the exclusion
with of dietary
the exclusion intake. intake.
of dietary The determination
The determination of BCF of requires controlled
BCF requires condi-
controlled
tions of exposure,
conditions is determinable
of exposure, in a laboratory,
is determinable and takes
in a laboratory, and into account
takes only respiratory
into account only res-
uptake
piratory which
uptake is governed by the kinetic
which is governed constant
by the kinetickRespiratory
constant .kOn the other
Respiratory. On thehand, elimina-
other hand,
tion processes
elimination (faecal egestion,
processes metabolic
(faecal egestion, biotransformation,
metabolic gill elimination,
biotransformation, and grow
gill elimination, and
dilution) are taken
grow dilution) areinto
taken account by the by
into account cumulative
the cumulative elimination kinetickinetic
elimination constant kElimination
constant kElim-.
Thus, BCF isBCF
ination. Thus, defined as the as
is defined ratio
thebetween the kinetic
ratio between constant
the kinetic of respiratory
constant uptake
of respiratory and
uptake
that of elimination (Equation
and that of elimination (Equation (1)). (1)).
When
When the concentrationofofthe
the concentration thechemical
chemical species
species in ainspecific
a specific
tissue tissue or specimen
or specimen ([Sub-
([Substance]
stance]Organism ) reaches
Organism ) reaches a constant
a constant value value
(i.e.,(i.e., stationary
stationary stateororplateau)
state plateau) after
after prolonged
prolonged
exposure
exposuretoto thethechemical
chemical substance, due todue
substance, theto
balance betweenbetween
the balance the uptake theand the elimination
uptake pro-
and the elim-
cesses, BCF can be measured according to Equation (2) where: [Substance]
ination processes, BCF can be measured according to Equation (2) where: [Substance]Organ- Organism is expressed
as a “weight of substance”/“weight of wet sample” ratio using either mg/kg (ppm) [71]
ism is expressed as a “weight of substance”/“weight of wet sample” ratio using either
or g/kg(ppm)
mg/kg units [71][72];or [Substance]
g/kg unitsWater[72];is[Substance]
the concentration of the chemical species freely
Water is the concentration of the chemical
dissolved in the water to which the organism is exposed
species freely dissolved in the water to which the organism is exposed (surrounding (surrounding medium)—thus me-
excluding precipitated or adsorbed chemicals in sediments—and
dium)—thus excluding precipitated or adsorbed chemicals in sediments—and expressed expressed as a “weight of
substance”/“volume of the medium” ratio using either mg/L (ppm) [71] or g/L units [72].
BCF (L/kg) = kRespiratory /kElimination (1)
BCFSS (L/kg) = [Substance]Organism /[Substance]Water (2)Int. J. Mol. Sci. 2021, 22, 6276 5 of 26
Bioaccumulation factor (BAF)
Differently from BCF which requires controlled conditions and excludes the contribu-
tion of dietary intake, the BAF expresses the bioaccumulation of a substance in an organism
through all possible routes of exposure, including diet, where the dietary uptake is gov-
erned by the kinetic constant kDietary . Thus, BAF can be defined according to Equation (3)
where [Substance]Diet , if known under controlled conditions, is the concentration of the
investigated chemical in the diet, expressed as mg/kg. BAF can be measured, after a sta-
tionary state is reached, according to Equation (4). Under controlled laboratory conditions,
the stationary state is reached when [Substance]Organism reaches a plateau without further
variations. For experiments in the field, the stationary state is assumed to be reached at
the moment of monitoring. It is important to remark that, although measured through the
same items (see Equations (2) and (4)) BAF and BCF cannot be determined in the same
experiment since BCF excludes dietary intake of the investigated chemicals (i.e., animals
are fed with uncontaminated food) while BAF considers dietary intake whether it is known
under controlled conditions ([Substance]Diet ) or unknown (in the field measurements).
Differences between BCF and BAF are conceptually crucial since these two factors could be
confused one for the other due to the similar way of determining them under stationary
conditions [71–75].
BAF (L/kg) = (kRespiratory + kDietary [Substance]Diet /[Substance]Water /kElimination (3)
BAFSS (L/kg) = [Substance]Organism /[Substance]Water (4)
Biota–sediment accumulation factor (BSAF)
Another, although less common, measurable potential of bioaccumulation in the field
is the biota–sediment accumulation factor (BSAF). This descriptor expresses the relationship
between the concentration of the test substance in the organism and the concentration of
the test substance in sediments [72] and can be determined according to Equation (5)
BSAF = [Substance]Organism /[Substance]Sediment (5)
Biomagnification factor (BMF)
Different from bioconcentration and bioaccumulation processes that involve a single
type of tissue or organism, the biomagnification process refers to the increased concentra-
tion of a toxic chemical along the food chain, e.g., between prey and its predator. If the
diet of the predator consists of only one type of prey, BMF can be determined, either in the
field or under controlled conditions in the lab, according to Equation (6) as the ratio of the
concentration of a substance in the predator organism [Substance]Predator with that found
in its prey [Substance]Prey [73].
BMF = [Substance]Predator /[Substance]Prey (6)
Additionally, by considering the definitions of BAF and BCF above, BMF could be
evaluated also according to Equation (7) [73].
BMF = BAFPredator /BAFPrey (7)
If the diet of the predator is variable, BMF can still be calculated under controlled
conditions in the lab at the steady-state [71,72]. For instance, “dietary BMFs” may be
determined in laboratory experiments according to Equation (8) by placing the monitored
organism in uncontaminated water and exposing it to the investigated substance uniquely
through the organism’s diet [75].
BMF = [Substance]Organism /[Substance]Diet (8)Int. J. Mol. Sci. 2021, 22, 6276 6 of 26
Conversely, under variable diet, the determination of BMF in the wild could be more
difficult and, in these cases, the use of the trophic magnification factor (see below) would
be more appropriate.
Trophic magnification factor (TMF)
While BMF considers biomagnification from one level of a trophic chain to the next
higher level (i.e., contiguous species in the trophic network), TMF is used to identify
the biomagnification process over an entire food chain or part of it [72]. In particu-
lar, empirical TMFs are deduced from field measurements, represent a weighted aver-
age of BMF over several trophic levels [75], and can be determined from the slope of
log10[Substance]Organism vs. the position (n) of the organism in the trophic chain or calcu-
lated according to Equation (9) [7,74].
Log10 TMF = (log10 [Substance]Organism n − log10 [Substance]Organism 1)/(n − 1) (9)
The determination of all of the above factors can be affected by choosing to determine
concentrations using either wet or dried weights of the organism/tissue samples. Addi-
tionally, the tendency of organic chemicals to accumulate in lipid/proteic tissues should
be taken into account by lipid/proteic normalization [75]. In the case of PFAS, which
are considered proteinophilic substances, the proteic normalization can be performed by
dividing the chemical concentration by the protein percentage of the animal or of the organ
under examination [75,76].
If significant concentrations of a chemical substance are found in biota in remote areas,
the above bioaccumulation descriptors can be used to assess the substance’s persistence, in
particular for possible long-range transport.
In general, a substance fulfils the bioaccumulation criterion when the BCF or BAF
in aquatic species is higher than 2000 (log10 BAF or log10 BCF > 3.3) and is considered as
“very bioaccumulative” when the BCF or BAF exceeds 5000 (log10 BAF or log10 BCF > 3.7).
On the other hand, with regard to BMF or TMF, values greater than 1 are considered
significantly high [71].
3.1. Bioaccumulation Data
Many studies show that in strongly anthropized environments the above cited em-
pirical descriptors meet the criteria to define PFCs as bioaccumulative substances [25,77]
although, for specific substances such as PFOA, values of BCF and BAF are not always
above the bioaccumulative threshold [71]. Since any of the bioaccumulative factors is deter-
mined based on a specific organism/tissue and can be evaluated in various geographical
areas, it is important to analyse data from different studies to define the bioaccumulative
potential of a specific polyfluorinated organic substance. For these reasons, in the following
paragraphs, bioaccumulation studies are grouped based on the monitoring conditions as
studies in the natural environment or under controlled experimental conditions.
3.1.1. Bioaccumulation in the Wild
Since the bioaccumulative potential depends on the physicochemical properties,
branched, linear, and differently functionalized PFCs show different affinities for tissues
and organisms [33].
Bioaccumulation in Aquatic Flora
Despite the high bioaccumulation potential of PFCs and the intrinsic residential
nature of the flora, there are only few PFCs bioaccumulation studies concerning either
micro or macro aquatic flora. In one of these studies conducted in the Xiamen Sea area, the
calculated BFC for kelp algae (Thallus laminariae) had a range of 2900–4600 L/kg for PFOS
and 6700–14,300 L/kg for PFOA. For the latter, the calculated BCF was higher than that
of the fauna investigated [78]. Conversely, lower BFC values (approximately 1000 L/kg)
were found in the benthic algae of Michigan rivers (United States) [79]. Finally, high
BAF values were calculated for floating plants in Lake Baiyangdian [80]. In particular,Int. J. Mol. Sci. 2021, 22, 6276 7 of 26
the log10 BAFs for PFOS, PFOA, PFNA and perfluorodecanoic acid (PFDA) were 3.0–4.1,
1.9–3.7, 2.9–4.4, and 3.2–4.2, respectively [80]. The values of the bioaccumulation factors of
the above studies are similar to those calculated for aquatic fauna (see below) suggesting
that PFCs may have similar (if not higher) bioaccumulation potentials for flora that should
be further investigated.
Bioaccumulation in Aquatic Fauna
In general, long-chain PFCs have a higher bioaccumulative potential in biota than
short-chain ones as observed in Asan Lake (South Korea) where PFDA and PFOS showed
a log10 BAF value > 3.0 in fish species [81].
In the Xiamen Sea area, the BCFs calculated with the quantity of PFAAs in different
trophic levels of aquatic animals ranged from 6400–9700 L/kg to 3300–8000 L/kg for PFOA
and PFOS, respectively [78].
High BAF was determined also in wild crucian carp (Carassius carassius) collected
from the Yubei River (China), with an average log10 BAF values of 3.06 (in muscle) and 4.14
(in blood) for p-perfluorononenoxybenzenesulfonate (OBS) similar to the log10 BAF values
recorded for PFOS in the same species [82].
In a recent study considering 19 different PFAS, the analysis of seawater, sediment,
and biota (Ruditapes philippinarum) allowed to determine both a log10 BAF range of 2.53–4.32
and a log10 BSAF range of 1.30–2.50 the Jiaozhou Bay coast area (China) [83]. Interestingly,
these bioaccumulation factors correlated with the number of carbons in the PFAS chain
with log10 BAF increasing with the carbon chain length, whereas the log10 BSAF values
decreased with the carbon chain longer than C8 [83] since longer chained compounds
would have a higher affinity for sediments.
A trophic transfer has also been detected in the Antarctic ecosystem. In particular,
BMF values of perfluorobutyric acid (PFBA), perfluoroheptanoic acid (PFHpA), PFHxS,
and PFOS between Archaeogastropoda and Neogastropoda ranged between 0.7 and 3.3
and indicated that short-chain PFAS may not be biomagnified along the food chain [84].
Biomagnification phenomena have been evaluated also in Gironde Estuary (France)
based on PFCs concentrations found in mysids and copepods with BMF > 1 for PFOS,
perfluorooctanesulfonamide (FOSA), and long-chain perfluorinated carboxylic acids (PF-
CAs) [85]. Trophic magnification was also proven in urban river environment (Orge,
France) with values of TMFs > 1 for C9 –C14 PFCA, C7 –C10 PFSAs and several PFAAs such
as sulphonated fluorotelomers 8:2 and 10:2) [86].
3.1.2. PFAS Uptake under Controlled Experimental Conditions
Studies conducted under controlled conditions are important to understand which
PFC is the most accumulated and to understand the differences in bioaccumulation between
different species and tissues. In recent research work, some benthic fish (Pseudogobius sp.)
were fed, for three weeks, with food contaminated with either PFOA, PFOS, or ammonium
2,3,3,3-tetrafluoro-2-(heptafluoropropoxy)propanoate (GenX). After a period of 42-day
purification, the assimilation of PFOA was low (22%) corresponding to a low BMF of 0.021.
Conversely, linear PFOS showed a much higher assimilation rate of 60% with BMF of 0.346,
while GenX did not accumulate in the fish during exposure [65].
In zebrafish (Danio rerio) exposed to 10 µg/L of radiolabelled perfluorooctanoic acid
(14 C-PFOA), a BCF ranging between 20 and 30 was observed [87].
Zebrafish larvae exposed to three different concentrations of three PFAS, the deter-
mined BCFs were 113–193 for PFOS, 125–358 for F-53B, and 20–48 for OBS with different
level of effects recorded on larvae’s development [88].
In amphibians (Rana pipiens, Anaxyrus americanus, and Ambystoma tigrinum) BCF
value observed for PFOS (BCFs = 47–259) was greater than that recorded for PFOA
(BCFs = 0.46–2.5) [89]. Similarly, in tadpoles of R. pipiens exposed for 40 days to three
different concentrations of PFOS, PFHxS, PFOA, and 6:2 fluorotelomer sulfonate (6:2 FTS)
the PFOS, showed higher accumulated levels with BCF ranging from 19.6 to 119.3 whileInt. J. Mol. Sci. 2021, 22, 6276 8 of 26
other PFAS had BCF < 1.0 [66]. A similar trend was observed also for BAF and BSAF
recently calculated on R. pipiens larvae where PFOS bioaccumulated at a higher rate than
PFOA and where BSAF was up to two orders of magnitude lower than BAF [90].
Even higher bioaccumulation potential was observed in Holothuria tubulosa exposed
to 6 PFAS at a concentration of 1 ppm where the log10 BAF ranged from 0.45 (for perfluo-
robutanoic acid (PFBuA) to 5.52 (for PFOS) in gonads and from 1.11 (for PFBuA) to 5.54
(for PFOS in the intestine). The log10 BSAF ranged from 1.1 (for PFOA) to 2.28 (for PFOS)
in gonads and from 0.87 (for PFOS) to 3.56 (for PFOA) in the intestine [91].
As suggested by several protocols, generally the exposure times are about 28 days or
until the steady-state is reached, this condition varies according to the elimination rate and
half-life of the chemical in question.
Since the uptake of PFAS can be reached between 22 and 38 days, several organisms
can accumulate these pollutants in the natural environments, considering a long time of
exposure, thus creating potential problems of biomagnification and, in general, threatening
the health of the ecosystems and organisms that are part of it.
As can be seen in the above studies, the values of bioaccumulation potentials calcu-
lated for field studies are generally higher than those obtained under controlled conditions.
The reason for this difference may be that, unlike laboratory experiments, in nature lower
concentration levels and longer exposure times favours the uptake of contaminants in
organisms for which they have a higher affinity (compared to water). In this way, the or-
ganisms would be able to tolerate the increasing bioaccumulation of the pollutant, without
reaching definitively the stationary state because of the open system of the environment in
which they live.
These experiments, if integrated with molecular–biological approaches, could provide
clear and exhaustive information about this emerging environmental threat. For example,
recent studies of predictive toxicology based on innovative computational methods have
evaluated the differences between some species in the binding affinity between per- and
polyfluoroalkyl substances (PFAS) and liver fatty acid-binding protein (LFABP) finding
similar PFAS bioaccumulation potentials for the investigated organisms. The evaluation
showed that rainbow trout, humans, rats, and chickens have similar binding affinities
for each PFAS, while medaka fish had a significantly weaker binding affinity for some
PFAS [92]. It is therefore important to combine different types of experiments for the
evaluation of bioaccumulation potentials and, in this context, molecular dynamics analysis
opens the way of using computational tools to simulate or support studies where the
sampling of rare or endangered species would be difficult.
4. Biomonitoring PFAS in Aquatic Biota
4.1. Biomonitoring PFAS in Aquatic Flora
Compared to the number of studies regarding the presence of the PFCs in the fauna
(see below), biomonitoring data concerning aquatic flora are very few. One of these was
conducted in Michigan rivers and showed that the benthic algae had concentrations of
PFOS, FOSA, PFOA, and perfluorohexanesulfonic acid (PFHS) of: 2.6–3.1,Int. J. Mol. Sci. 2021, 22, 6276 9 of 26
4.2. Biomonitoring PFAS in Aquatic Fauna
Aquatic organisms that live in contaminated environments (natural or artificial) tend
to accumulate the pollutant more than water in which they live and in particular, PFAS in
an aquatic organism can be transferred from the contaminated water, food or suspended
sediment [81]. As already mentioned, although there may be a different biodistribution
of the different PFAS in the different tissues and species, one of the common factors
that play an important role in biota contamination lies in the geographical origin, of the
analysed organisms. It is known that PFAS contamination levels of organisms caught
in waters affected by anthropogenic pollution are generally higher than concentrations
in organisms from open oceans [93–95]. This correlation is highlighted in an important
mollusc aquaculture area Bohai Sea (China) where PFAS contamination was verified in
different species of molluscs sampled in the various mussel farming with higher levels of
contamination in samples taken near industrial areas [95].
For example, in the same sampling area located in the Cantabrian Sea (North Spain),
near ports, sewage effluents, and wastewater, much lower total PFAS concentration
levels [PFAS]TOT were found in seawater (0.06 to 10.9 ng/L) compared to sediment
(0.01–0.13 ng/g) and mussels (0.01–0.06 ng) [96]. Similarly, in the Orge river (France),
the [PFAS]TOT in seawater (73 ng/L) and in sediment (8.4 ng/g) were much lower than that
found and in fish (Leuciscus cephalus) that ranged from 43.1 to 4997.2 ng/g; with a maximum
log10 BAF values recorded for perfluorododecanoic acid (PFDoA) in the following order:
plasma (6.7), liver (5.7), gills (5.7), gonads (5.5), and muscle (5) [97].
Another study near the wastewater area in Lake Tana (Ethiopia), showed that the
averages of [PFAS]TOT were 2.9 ng/L for surface water, 0.30 ng/g in surface sediment,
and 1.2 ng/g in all fish species [98]. A similar trend was observed in Vietnam where
[PFAS]TOT in water (near discharge canal) was 107 ng/L. This represents the greatest
recorded [PFAS]TOT in these types of research, although remaining three orders of mag-
nitude lower than [PFAS]TOT in biota samples [99]. In the same way, in Jiaozhou bay
coast (China) analyses of 35 PFAS carried out in seawater, sediment, and biological sam-
ples (Ruditapes philippinarum) showed, respectively, the following concentration range:
21.1–38.0 ng/L, 0.459 to 1.20 µg/kg, and 15.5–27.5 µg/kg [83].
In addition, significant differences in PFAS levels and composition profiles were found
between the type of analysed samples. For example, in Lake Baiyangdian (China) the most
abundant PFC in water was PFOA (1.70–73.5 ng/L), while in sediments and in aquatic
animals the most abundant PFC was PFOS which was detected with a concentration range
of 0.06–0.64 ng/g and 0.57–13.7 ng/g, respectively [80].
The levels of PFAS in wild sea bass Dicentrarchus labrax were higher (PFOS:
112–12,405 ng/kg; PFOA: 9–487 ng/kg) than those farmed. Interestingly, among farmed sea
bass species, intensively farmed fishes showed lower PFAS values (PFOS: 11–105 ng/kg;
PFOA: 9–51 ng/kg) compared to those extensively farmed [56].
This unexpected result was also supported by a study performed in 246 fishes and
fishery products collected in various aquatic environments in the Netherlands where
[PFAS]TOT was higher in eels (43.6 ng/g) followed by shrimps (6.7 ng/g), marine fish
(seabass) (4.5 ng/g), and farmed fish (e.g., trout, catfish, turbot, salmon, tilapia, pangasius)
(0.06 ng/g) [100]. These studies agree with others where farmed fish showed lower PFAS
contamination than freshwater or marine fish [101–103].
The reason for these results, which appear to contrast with the common expectation of
a wild environment being less contaminated than a farmed habitat, may lie in the transport
of pollutants through vectors by ocean currents or undetected sources of pollution. These
transport phenomena can cause greater contamination in areas further away than those
closest to industrial activities. For example, in the Antarctic ecosystem significant levels
of PFAS have also been found in areas far from potential sources of contamination (e.g.,
[PFAS]TOT = 4.97 ± 1.17 ng/g in Neogastropoda) [84].
Consistent with what was previously reported, for the complete assessment of the
contamination status in an area, it is necessary to analyse the content of the pollutantInt. J. Mol. Sci. 2021, 22, 6276 10 of 26
in any the organisms or their environment, and to acquire other information about the
ecosystem (biotic and abiotic components). However, since such monitoring could be
difficult during the screening of wild environment, research should focus on one or more
specific bioindicator species.
Ideally, the latter should respond to certain characteristics such as: being common
and easy to sample, provide a high response in the presence of toxicants, show tolerance
and resistance to environmental variability, and possess a reduced mobility—e.g., sessile
species (for the evaluation of restricted spatial contamination), etc. [104,105]. In this way,
although generally higher values are found in organisms living in the areas of the most
contaminated areas, some species bioaccumulate more than others for example because
the pollutant enters more easily into them for direct assimilation linked to their feeding
behaviours (e.g., filter feeder) or for indirect assimilation (biomagnification) connected to
their position (top) of the food chain (e.g., predators).
Indeed, PFAS bioindicator species already provide much information on the quality
of an environment, and the concentrations found in their tissues reflect (albeit with much
higher values) the levels of environmental contamination from PFAS [106].
Therefore, an overview of the [PFAS]TOT values found in various aquatic organisms
sampled in different countries is reported in Table 1.
Table 1. Number of monitored PFCs (PFAS) and their total concentration as a function of investigated species in different
locations in wild environment.
Fish Location in Wild Samples Analysed 1 [PFAS]TOT (ng/g) Ref.
Red seabream China
Muscle Σ9 PFAS: 0.04–2.14 [107]
(Pagrus major) Seawater
Chameleon goby China
Muscle Σ6 PFAS: 10.97–12.93 [78]
(Tridentiger trigonocephalus) Seawater
Baltic cod Baltic Sea
Liver Σ28 PFAS: 6.03–23.9 [108]
(Gadus morhua) Seawater
Shortfin mako shark Greece
Muscle, Gills, Heart Σ15 PFAS: 3.2–10.3 [109]
(Isurus oxyrinchus) Seawater
Angular roughshark Greece
Muscle, Liver Σ15 PFAS: 17.9–85.1 [109]
(Oxynotus centrina) Seawater
Giant devil ray Greece
Muscle, Gills Σ15 PFAS: 1.5–4.4 [109]
(Mobula mobular) Seawater
Smalltooth sand tiger Greece
Gills, Liver Σ15 PFAS: 62.2–65.4 [109]
(Odontaspisferox) Seawater
Bigeye thresher Greece
Muscle, Gills, Liver, Heart Σ15 PFAS: 3.1–48.1 [109]
(Alopias superciliosus) Seawater
Sharpnose sevengills shark Greece
Muscle, Gills, Liver, Gonad, Heart Σ15 PFAS:Int. J. Mol. Sci. 2021, 22, 6276 11 of 26
Table 1. Cont.
Fish Location in Wild Samples Analysed 1 [PFAS]TOT (ng/g) Ref.
Spot South Carolina
Whole fish Σ11 PFAS: 14.7–67.8 [110]
(Leiostomus xanthurus) Seawater
Spotted seatrout South Carolina
Whole fish Σ11 PFAS: 17.3–85.4 [110]
(Cynoscion nebulosus) Seawater
Striped mullet South Carolina
Whole fish Σ11 PFAS: 6.2–20.7 [110]
(Mugil cephalus) Seawater
Yellow croaker China
Liver, Muscle Σ8 PFAS: 8.99–87.9 [111]
(Larimichthys polyactis) Freshwater
Mandarin fish China
Liver, Muscle, Eggs Σ8 PFAS: 3.02–51.2 [111]
(Siniperca chuatsi) Freshwater
Crucian Carp China
Muscle Σ8 PFAS: 3.15–4.09 [111]
(Carassius carassius) Freshwater
Crucian Carp South Korea
Muscle Σ19 PFAS: 17.6 ± 10.0 [81]
(Carassius carassius) Freshwater
Common Carp South Korea
Muscle Σ19 PFAS: 50.6 ± 71.6 [81]
(Cyprinus carpio) Freshwater
Grass carp China
Muscle Σ6 PFAS: 8.87–10.66 [78]
(Ctenopharyngodon idellus) Freshwater
Barbel steed South Korea
Muscle Σ19 PFAS 16.7 ± 2.7 [81]
(Hemibarbus labeo) Freshwater
Bass South Korea
Muscle Σ19 PFAS: 40.3 ± 13.7 [81]
(Micropterus salmoides) Freshwater
Bass China
Muscle Σ8 PFAS: 3.02 [111]
(Micropterus salmoides) Freshwater
Bluegill South Korea
Muscle Σ19 PFAS: 32.4 ± 11.0 [81]
(Lepomis macrochirus) Freshwater
Skygager South Korea
Muscle Σ19 PFAS: 30.5 ± 25.3 [81]
(Chanodichthys dabryi) Freshwater
Tilapia Vietnam
Liver, Muscle Σ13 PFAS: 0.5–10.6 [99]
(Oreochrommic niloticus) Freshwater
Stripped snakehead Vietnam
Liver, Muscle Σ13 PFAS: 0.18–1.01 [99]
(Chana striata) Freshwater
Dusky sleeper Vietnam
Whole body Σ13 PFAS: 0.92 [99]
(Eleotris fusca) Freshwater
Shark catfish Vietnam
Whole body Σ13 PFAS: 0.3 [99]
(Pangasius elongatus) Freshwater
Flying barb Vietnam
Whole body Σ13 PFAS: 0.91 [99]
(Esomus danricus) Freshwater
Ninespine stickleback Alaska
Whole body Σ31 PFAS: 3.66–15.6 [112]
(Pungitius pungitius) Freshwater
European eel Netherlands
Muscle Σ16 PFAS: 4.7–172 [100]
(Anguilla anguilla) Freshwater
Crustacea
Ghost crab China
Soft tissues Σ6 PFAS: 7.8–10.47 [78]
(Ocytopode stimpsoni) Seawater
Hermit crab China
Soft tissues Σ6 PFAS: 7.73–8.06 [78]
(Clibanarius infraspinatus) SeawaterInt. J. Mol. Sci. 2021, 22, 6276 12 of 26
Table 1. Cont.
Fish Location in Wild Samples Analysed 1 [PFAS]TOT (ng/g) Ref.
Asian paddle crab Vietnam
Soft tissues Σ13 PFAS: 0.61 [99]
(Charybdis japonica) Freshwater
Giant prawn Vietnam
Soft tissues Σ13 PFAS: 0.24–0.58 [99]
(Macrobrachium rosenbergii) Freshwater
Shrimp France
Whole body Σ22 PFAS: 4.5 ± 1.2 [85]
(Palaemon longirostris) Estuarine areas
Brown shrimp France
Whole body Σ22 PFAS: 11 ± 2 [85]
(crangon crangon) Estuarine areas
Mysid shrimps France
Whole body Σ22 PFAS: 7.2 ± 2.0 [85]
(Mysidacea, ind.) Estuarine areas
Copepods France
Whole body Σ22 PFAS: 2.9 ± 0.8 [85]
(Copepoda, ind.) Estuarine areas
Zooplankton Italy
Whole body Σ12 PFAS: 7.6 [113]
(Copepoda, Cladocera) Freshwater
Mollusca
Shell fish China
Soft tissues Σ19 PFAS: 15.5–27.5 [83]
(Ruditapes philippinarum) Seawater
Oyster China
Soft tissues Σ6 PFAS: 12.45–12.76 [78]
(Cassostrea gigas) Seawater
Quagga mussels Belgium
Soft tissues Σ15 PFAS: 21.88 [114]
(Dreissena bugensis) Freshwater
Asian clam Belgium
Soft tissues Σ15 PFAS: 20.79 [114]
(Corbicula fuminea) Freshwater
Golden clam Vietnam
Soft tissues Σ13 PFAS: 0.73 [99]
(Corbicula fluminea) Freshwater
Golden apple snail Vietnam
Soft tissues Σ13 PFAS: 0.22–0.6 [99]
(Pomacea canaliculata) Freshwater
Mammalian
Killer whales Greenland
liver Σ36 PFAS: 614 ± 49 [58]
(Orcinus orca) Seawater
Harbor seals Sweden
liver Σ36 PFAS: 640 ± 51 [58]
(Phoca vitulina) Seawater
Ringed seals Sweden
liver Σ36 PFAS: 536 ± 43 [58]
(Phoca hispida) Seawater
1 Values (ng/g) reported the total PFAS concentration indicated as average, average ± standard deviation, or min–max concentration
ranges. The symbol Σ precedes the number of PFAS contributing to the total concentration.
The concentration levels of the PFAS correlate differently with the various tissues,
based on the affinity of the individual PFAS for the different matrices, species due to the
different intra- and interspecific physiological metabolic mechanisms of absorption and
elimination of the pollutant.
On this basis, the values of bioaccumulation factors would provide a deeper insight
of the affinity of a given PFC towards specific tissues. Not all the biomonitoring studies
discussed above contain information about bioaccumulation factor and values reported in
the literature are discussed below as a function of the type of tissues.
A value of BFC ranging between 8160–9680 L/kg for PFOA and 6430–7960 L/kg for
PFOS was recorded in Grass carp muscle from the Xiamen freshwater area [78]. On the
other hand, in saltwater, soft tissues of Ocypode stimpsoni showed a BCF of 6490–7440 L/kg
for PFOA and 3270–4240 L/kg for PFOS, while in soft tissues of Ostrea gigas BCF ranged
between 6410–9680 (PFOA) and 4180–6430 L/kg (PFOS) [78]. In Jiaozhou Bay (China) softInt. J. Mol. Sci. 2021, 22, 6276 13 of 26
tissues of saltwater clam (Ruditapes philippinarum) showed log10 BAF between 2.53–4.32 for
all 19 types of PFAS detected with values positively correlated with carbon chain length
(C8 –C13 ) [83]. Conversely, high values of log10 BAF were calculated for small crustacean
(mysids and copepods) in France estuarine area. In particular, in the whole body, the highest
value was detected for L-FOSA (4.1 for copepods and 4.9 for mysids), confirming the great
threat of PFCs due to their bioaccumulation (and biomagnification) potential also in small
organisms [85]. Conversely, a biomonitoring screening conducted on different aquatic
organisms and tissues in Vietnam, reported that BCF values in seven fish species were
always higher in the liver (max BCF value found in tilapia for heneicosafluoroundecanoic
acid (PFUnDA) of 142,764 L/kg followed by PFDA of 22,953 L/kg, PFDoA of 7729 L/kg,
and PFOS of 3551 L/kg) than in the muscles (max BCF value found in tilapia for PFUnDA
of 9169 L/kg) and the whole body (max BCF value found in dusky sleeper for PFNA of
1627 L/kg) [99]. On the other hand, in the same study, BCF values were higher in bivalves’
soft tissues (max BCF value found in golden freshwater clam for PFHxS of 2781 L/kg)
than in crustaceans (max BCF value found in paddle crab for PFHpA of 1523 L/kg) and
gastropods (max BCF value found in golden applesnail for PFHxS of 1606 L/kg) [99]. These
reported bioaccumulative potential data are coherent with the evidence emerged in the
recent review of Burkhard [25] where differences in BFC values between different PFCs,
aquatic organisms and tissues are reported.
5. Biodistribution and Contamination Profile
The distribution and contamination profile of PFAS in the aquatic organism is con-
sistent with the results of previous studies, which showed that the distribution can be
affected by different variables such as environmental contamination specific metabolism
and diet [98,115,116]. Therefore, besides differences due to geographical location, it is im-
portant to remark that biodistribution studies must compare species as close as possible to
each other, since the diet, and physiological mechanisms are intrinsically different between
different species.
5.1. Contamination Profile
A study comparing fishes with different nutritional behaviour showed that herbiv-
orous and omnivorous fishes, such as Labeobarbus intermedius, Oreochromis niloticus, and
Clarias gariepinus, contained a higher proportion of short-chain PFAS with respect to pisciv-
orous fishes Labeobarbus megastoma and Labeobarbus gorguari. The latter, however, contained
an overall higher total PFAS concentrations and a higher proportion of long-chain PFAS
with respect to non-piscivorous species [98]. Conversely, a higher percentage of long-chain
PFAS has been recorded for the PFCs contamination profile in the plasma of the threatened
herbivore manatee of the West Indies (Trichechus manatus) [117]. The contamination profile
could change also depending on the sampling site, even when belonging to the same area.
For instance, a study on molluscs from the semi-closed basin of the Bohai (China) and
investigating the presence of 23 PFCs, showed differences between aquaculture sites and
more restricted areas with PFOA being the more abundant component (87% of the total
PFAS) showing a very high frequency of detection (i.e., percentage of samples where PFOA
has been detected) of 98%, followed by PFNA, perfluorodecane sulfonic acid (PFDS) and
PFOS [95]. Indeed, the most frequently detected PFCs in various tissues of aquatic or-
ganisms are long-chain PFAS such as PFOS [56,58,115,117–119] and PFOA [78,83,95]. This
frequency is particularly important when referred to organisms that are directly consumed
by humans or by endangered species. A worryingly study focusing on the analysis of
11 PFAS in different edible fish species sampled in South Carolina (mullet, croaker, spot,
red drum, seatrout, and flounder), showed that the concentrations of PFOS were between
25.5–69.6% of the total detected PFAS, with values exceeding the threshold limits allowed
for food consumption [110].
The concentration levels of a specific PFC in the different tissues of the same species
(e.g., PFOA in the liver of species A vs. PFOA in plasma of species A) are usually correlated.Int. J. Mol. Sci. 2021, 22, 6276 14 of 26
However, this correlation may lack for the same PFC analysed in the same organs of
different species (e.g., PFOA in the liver of species A vs. PFOA in the liver of species B). This
may be partially due to the differences in species and tissue-specific proteins, circulation
mechanisms, depuration pathways, and feeding behaviour among the species [115]. For
example, PFOS accounted for 87.6% of the total PFCs in minnow eggs, whereas it only
accounted for 42.6% of the total fluorinated compounds in white shrimp eggs [115]. The
same also applies to phylogenetically close species, and for [PFAS]TOT , in a recent work,
for example, considering the same marine area but different species (of mollusc) analysed,
[PFAS]TOT showed the following trend: clams > mussels > scallops > peels > oysters [95].
In general, individuals of the same species from different sampling sites should
accumulate PFAS in the same proportion thus reflecting PFAS contamination of their local
habitat. For example, in crab Ocytopode stimsoni the ratio between PFOA and PFOS found in
tissues was the same as that found in water and sediment from the two different sampling
areas in Xiamen [78].
However, this correlation between PFCs contamination in the organism and its habitat
does not always occur since a given organism could be selective in the type of uptaken
PFAS thus presenting a different contamination profile compared to the collection site. For
example, despite the predominance of PFOS compared to PFOA in water and sediments of
two sampling areas of Xiamen, the oyster Cassostrea gigas shows higher PFOA concentration
levels than PFOS) [78]. Similarly, in biomonitoring research conducted in Vietnam, the
concentrations of PFOA and PFOS in water were dominant compared to the other 11 PFAS;
however, in the biological samples of various organisms analysed, PFUnDA showed to
be more present, in particular in the liver of the tilapia fish [99]. Additionally, in the
west coast of Korea, biomonitoring screening on fish showed higher PFAS levels than
crabs, gastropods, and bivalves; however, the different affinity of PFHpA and PFOS
for the organism did not allow to reproduce in the organism the same contamination
profile of the environment due to different bioaccumulative factors of the investigated
PFCs [120]. For this reason, it is very important to validate any biomonitoring study
by determining the significance of the correlation between the level of contamination
(e.g., total PFAS) of the organism as a signal for environmental contamination and the
profile of contamination (e.g., the contribution of each PFC to the contamination). While a
contaminated organism is generally a reliable indicator of a contaminated site, the profile
of contamination of the organism would represent that of the environment only in the case
of similar bioaccumulative factors of the different contaminants.
5.2. Tissues Biodistribution
Besides bioaccumulating differently between species, PFCs are also variably dis-
tributed among the different tissues of the same organism generally based on the type of
PFC intake. It is noteworthy that in exposure experiments through contaminated food,
the highest concentration levels were recorded in the liver followed by blood and kidneys;
while in aqueous exposure studies, higher concentrations were found in the blood followed
by the kidneys and liver [65] (Figure 2).
In a study on sharks, PFASs were found at different concentration levels in the fol-
lowing order: gonads > heart > liver > gills > muscle [42,99]. Likewise, in European chub
(Leuciscus cephalus) tissues, PFCs accumulation level followed the order: plasma > liver >
gills > gonads > muscle [97]. In Danjiangkou reservoir and Hanjiang river (China), different
fish species and tissues were analysed showing a higher concentration of PFAS in the liver
and egg than in the muscles of the same individuals [111]. Additionally, in Vietnam, two
species of fishes showed greater contamination of PFCs in the liver rather than in the
muscles [99]. Similarly, PFAS contamination in various tissues of fish caught from lakes
in the Alpine area was observed to be at a higher concentration in the blood and liver
with respect to than found in the muscles [23]. In Taihu Lake (China) an investigation of
different tissues of various aquatic organisms showed the highest concentration of PFASs
in the liver and eggs while the lowest was in muscle [115].5.2. Tissues Biodistribution
Besides bioaccumulating differently between species, PFCs are also variably distrib-
uted among the different tissues of the same organism generally based on the type of PFC
intake. It is noteworthy that in exposure experiments through contaminated food, the
Int. J. Mol. Sci. 2021, 22, 6276
highest concentration levels were recorded in the liver followed by blood and kidneys;
15 of 26
while in aqueous exposure studies, higher concentrations were found in the blood fol-
lowed by the kidneys and liver [65] (Figure 2).
Figure
Figure 2.
2. Scheme
Scheme of
of preferred tissues for
preferred tissues for the
the biodistribution
biodistribution of
of PFCs
PFCs in
in fish.
fish.
In an
a study on sharks,
experiment PFASs were
on zebrafish found
exposed 14 C-PFOA,
to at different autoradiograms
concentration levels in the fol-
confirmed the
lowing
highest order: gonads
labelling of PFOA> heart > liver
in bile, > gills(an
intestine > muscle [42,99]. circulation
enterohepatic Likewise, inofEuropean
PFOA), and chub
in
(Leuciscus cephalus)
the maturation tissues, PFCs
of vitellogenic accumulation
oocytes [87]. level followed the order: plasma > liver >
gills >Within
gonads > muscle
the [97]. In Danjiangkou
same organism, the pollutant reservoir and Hanjiang
is distributed riverin
differently (China), differ-
the different
ent fish species and tissues were analysed showing a higher concentration of
tissues, influencing their physiological conditions and often leading to biomolecular effects PFAS in the
liver and egg than
that negatively in the
affect themuscles of the
individual. same individuals
Therefore, [111]. Additionally,
biodistribution in Vietnam,
studies represent a major
concern
two for the
species health
of fishes of exposed
showed animals
greater since most
contamination of of the in
PFCs organs or tissues
the liver rather having
than in the
major affinity
muscles for PFCs accumulation
[99]. Similarly, are involved
PFAS contamination in vitaltissues
in various functions.
of fish caught from lakes
6. Effects of PFCs Exposure
The effects of perfluoroalkylic emerging pollutants are worrying since they involve
the functionality of several organs and are generally more severe with increasing time of
exposure and concentration of the contaminant [8,26,38,121]. Compared to the effects of
PFCs studied in humans, the biomolecular effects shown in aquatic organisms are more
subject to controlled laboratory conditions, derive from a variety of experiments, and thus
represent a wider panorama of possible consequences to PFCs exposure [16,17,87,122–132].
Furthermore, although the human or mammalian model in general [18] may be far from
the other animal models considered for these experiments, it is also known that aquatic
organisms have long provided valuable information for the study of basic biological
processes [133] showing also biomolecular responses similar to humans [134].
In addition, research on aquatic organisms is useful for safeguarding the balance
of the ecosystems and for evaluating adverse and potential effects (e.g., biomolecular,
physiological, toxic: cytotoxic, genotoxic, embryotoxic, etc.) on all species that are part of
the studied trophic network.
In this context, it is important to analyse the data concerning the toxicity descriptors,
EC50 , LC50 , and IC50 , defined below.
An EC50 (effective concentration) an estimate of the concentration of a toxic substance
that is required to produce an observed effect (endpoint) in 50% of the group of organisms
exposed to the substance. An LC50 (lethal concentration) is a special case of the EC50 in
which the recorded effect or endpoint is the death of the organism [135,136].
Finally, the IC50 (inhibitory concentration) is the concentration of the chemical com-
pound required for the inhibition of the process or biological component of 50% of the
group of organisms exposed to the substance [135].
On these bases, all the effects reported below have been organized and presented as a
function of the studied aquatic organisms.
6.1. Algae
The primary producers in the trophic network are usually plants and algae that
constitute the first level of the food chain. Therefore, it is important to verify the effects
of perfluorinated compounds in plant or algal organisms. In fact, besides consequencesYou can also read