Build Interception Through A Compiler Listener
←
→
Page content transcription
If your browser does not render page correctly, please read the page content below

Build Interception Through A Compiler
                Listener
                  Bachelor Thesis

                   Mehmet Ali Baykara
              Matriculation Number: 3063660

       Faculty 3 - Mathematics and Computer Science
               Computer Science Department

          1. Examiner: Prof. Dr. Rainer Koschke
          2. Examiner: Dr. Ing. Karsten Hölscher
Declaration
I hereby confirm that this thesis is my own work and that I have not submitted it for any
other examination purposes. I have not used any sources or resources other than those which
are indicated. All passages that are taken verbatim or in spirit from publications have been
marked as such.

Erklaerung
Hiermit versichere ich, dass ich die vorliegende Bachelorarbeit selbstständig angefertigt und
nicht anderweitig zu Prüfungszwecken vorgelegt habe. Ich habe keine anderen als die angegebe-
nen Quellen und Hilfsmittel verwendet. Alle Stellen, die wörtlich oder sinngemäß aus Veröf-
fentlichungen entnommen sind, sind als solche kenntlich gemacht.

Bremen, den 17.06.2021

                                                                        Mehmet Ali Baykara
II
Contents

1 Introduction                                                                                                                                                        3
  1.1 Motivation . . . . .    .   .   .   .   .   .   .   .   .   .   .   .   .   .   .   .   .   .   .   .   .   .   .   .   .   .   .   .   .   .   .   .   .   .   3
  1.2 Goal . . . . . . . .    .   .   .   .   .   .   .   .   .   .   .   .   .   .   .   .   .   .   .   .   .   .   .   .   .   .   .   .   .   .   .   .   .   .   4
  1.3 Problem Definition      .   .   .   .   .   .   .   .   .   .   .   .   .   .   .   .   .   .   .   .   .   .   .   .   .   .   .   .   .   .   .   .   .   .   4
  1.4 Structure . . . . .     .   .   .   .   .   .   .   .   .   .   .   .   .   .   .   .   .   .   .   .   .   .   .   .   .   .   .   .   .   .   .   .   .   .   4

2 Foundations                                                                                                                                                          5
  2.1 Process Life-cycle in Windows . . . . . . . . . . . . . . . .                                                   .   .   .   .   .   .   .   .   .   .   .   .    5
      2.1.1 Processes on Windows Operating System . . . . .                                                           .   .   .   .   .   .   .   .   .   .   .   .    5
      2.1.2 Process Creation and Termination . . . . . . . . .                                                        .   .   .   .   .   .   .   .   .   .   .   .    9
  2.2 Existing Process Intercepting Tools and Their Approaches                                                        .   .   .   .   .   .   .   .   .   .   .   .   11
      2.2.1 Strace for NT . . . . . . . . . . . . . . . . . . . . .                                                   .   .   .   .   .   .   .   .   .   .   .   .   11
      2.2.2 StraceNT . . . . . . . . . . . . . . . . . . . . . . .                                                    .   .   .   .   .   .   .   .   .   .   .   .   11
      2.2.3 Process Monitor . . . . . . . . . . . . . . . . . . .                                                     .   .   .   .   .   .   .   .   .   .   .   .   12
      2.2.4 Wtrace . . . . . . . . . . . . . . . . . . . . . . . .                                                    .   .   .   .   .   .   .   .   .   .   .   .   15
      2.2.5 NtTrace . . . . . . . . . . . . . . . . . . . . . . . .                                                   .   .   .   .   .   .   .   .   .   .   .   .   15
  2.3 Build Automation Technologies . . . . . . . . . . . . . . .                                                     .   .   .   .   .   .   .   .   .   .   .   .   17
      2.3.1 High Level Build Systems . . . . . . . . . . . . . .                                                      .   .   .   .   .   .   .   .   .   .   .   .   18
      2.3.2 Low Level Build Systems . . . . . . . . . . . . . .                                                       .   .   .   .   .   .   .   .   .   .   .   .   20
      2.3.3 Convention Based Build Systems . . . . . . . . . .                                                        .   .   .   .   .   .   .   .   .   .   .   .   21
      2.3.4 Recent Studies . . . . . . . . . . . . . . . . . . . .                                                    .   .   .   .   .   .   .   .   .   .   .   .   22

3 Design and Implementation                                                                                                                                           23
  3.1 Application Workflow . . . . . . . . . . . . . . . . . . . . . . . . . . . . . . . .                                                                            23
  3.2 Equipment and Tools . . . . . . . . . . . . . . . . . . . . . . . . . . . . . . . . .                                                                           24
  3.3 Approach and Instruments . . . . . . . . . . . . . . . . . . . . . . . . . . . . . .                                                                            25

4 Evaluation                                                                                   29
  4.1 Procedure . . . . . . . . . . . . . . . . . . . . . . . . . . . . . . . . . . . . . . . 29
  4.2 Projects . . . . . . . . . . . . . . . . . . . . . . . . . . . . . . . . . . . . . . . . 32

5 Conclusion, Results and Future Prospects                                                   45
  5.1 Conclusion and Results . . . . . . . . . . . . . . . . . . . . . . . . . . . . . . . . 45
  5.2 Future Work . . . . . . . . . . . . . . . . . . . . . . . . . . . . . . . . . . . . . 46

                                                                                                                                                                       1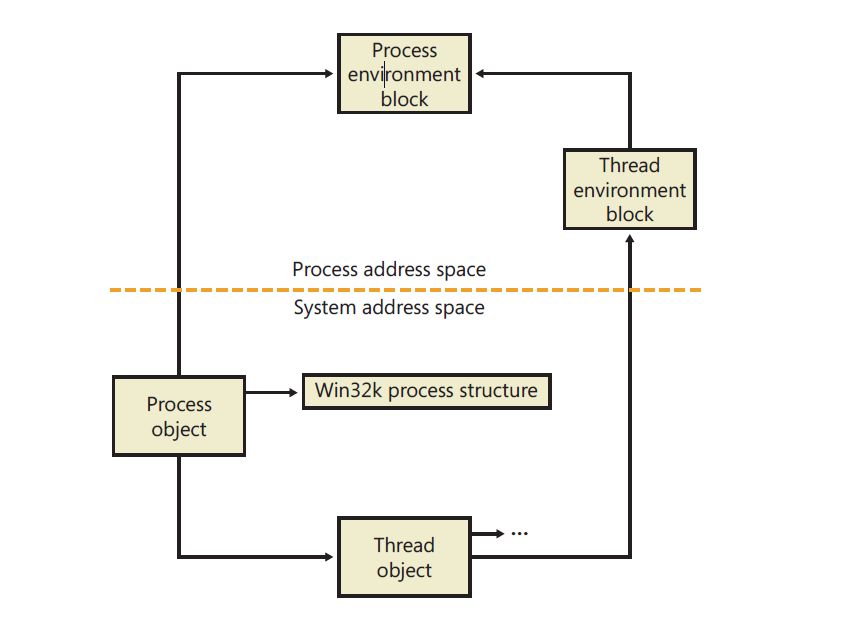
Contents

2
Chapter 1

Introduction

1.1    Motivation
Today software is much more complex than it has ever been and the software systems are
getting more extensive and changing continuously over time [1]. A piece of software is not
manufactured but developed and it will be changed and extended continuously [2]. Due to the
nature of the system, the software will always be developed, refactored, and kept maintained
until it is not used anymore.
The development of software consists of many parts. The build process is one of the most
essential parts of the software development life cycle. A build system converts source code into
executable programs by orchestrating the execution of compilers and other tools [3]. Since
the build process is crucial, the supported tools are gaining further importance, however, the
analysis support for build code is still limited [4].
During the development process, the build system runs hundreds of instructions including
binding libraries, managing dependencies, packaging, and more. Handling such a complex
and huge task is extremely error-prone and can hinder the correct build. The correctness of
build systems is essential where correctness might be equivalent to a clean build from clean
sources [45]. Another definition of correctness according to Smith is ‘correctness; a build
should fail because of compile errors and not because of faulty file linking or compiling of
files in the wrong order by the system’ [46]. The correctness of a piece of software depends
on the build environment such as the host-machine architecture, CPU, the version of used
tools and operating system, etc [45]. Since there are many parameters that could affect the
build process, this the operation should be analyzed closely by some static analysis tools.
These tools intend to fulfill certain requirements such as intercepting the complete process,
capturing the whole compilation, and extracting every single detail about the build process.
Additionally, to improve the quality of the software and gain a deeper understanding of the
build process, a detailed investigation is crucial.
A compiler listener may handle such a big task by performing a capturing of the whole build
process, replaying it and extracting the output of each process in detail. In this study, we
will focus on the complete build process and investigate each sub-process via PTracer which
we have developed during this study. There are tools that partially provide these pieces of
information, but we aim to use a tool that performs particular tasks run in the Windows
Operating System. A concrete result of this study is implementing software that allows a

                                                                                              3
1. Introduction gathering of all the necessary information to analyze the build process. 1.2 Goal The aim of this study, in the theoretical part, is to carry out a literature review with a focus on build system integration and the comparison of different approaches briefly. In the practical part, the development of a compiler listener that observes the whole build process and extracts the information in a JSON format allows one to analyze every step during the compilation process and perform the same action with extracted information. The developed tool should work out of the box in the Windows Operating System. The compiler listener should not require admin permissions and has to observe a variety of build systems including MSBuild, CMake, Make, and different compilers such as GCC/G++, Clang, etc. After that, in the evaluation phase, different real-world projects based on different build systems will be compiled and investigated via a compiler listener, namely PTracer. Finally, all findings will be compared by intercepting the output binaries. Those binaries will be compared based on different characteristics such as size, byte, and execution. 1.3 Problem Definition Static analysis tools are gaining ground as a complementary technique to conventional dynamic testing in order to obtain additional assurance on critical items of software [5]. To improve, modify, or manipulate any piece of software, it is essential to find out which source file and exactly which arguments will be transformed from high-level language to a machine-executable format. Hence, that critical information is achieved, then we can modify it, replay it, or take any further action. The aim is to observe and determine any difference when the build process is repeated again. 1.4 Structure In this chapter, we explain the motivation of this study, the actual problem definition and the structure of this thesis. In Chapter 2, Foundations, the process life cycle in the Windows Operating System (OS) and various other approaches about build and the compile process and some build systems will be briefly explained and categorized. Additionally, some existing technologies and tools for the intercepting process for the Windows Operating System will be briefly explained. Capturing build operations will take place in Windows 10 and implemen- tation will be specific to Windows OS, which might not work on other operating systems.In Chapter 3, Design and Implementation, the implementation details will be explained, such as used Application Programming Interfaces (API), algorithms, data structures, and other tech- nical details. In Chapter 4, Evaluation, a number of real-world projects will be investigated via PTracer. In Chapter 5, Conclusion, Results and Future Prospects, Results and Future Prospects, the analyzed project’s result will be explained and discussed. Then, the main re- search points will be clearly stated, and the study will be summarized. Finally, weaknesses of the tool and study will be pointed out and the future works will be noted. 4
Chapter 2

Foundations

2.1     Process Life-cycle in Windows
This chapter describes the background of the next chapter and other existing approaches
about capturing process information, build information and build systems.

2.1.1   Processes on Windows Operating System
This subsection describes how the process is structured in the Windows Operating System.
Nonetheless, we will not go into every detail of process management on Windows in that this
will be beyond this study.
A program could be defined as a static set of instructions, although a process is a container
for a set of system resources, used when executing the program [6]. Processes may differ
depending on the operating system. A typical Windows process has the properties listed
below:
   • A private virtual address space
   • An executable program
   • A list of handles to various system resources
   • An access token known as security context
   • A unique identifier known as process ID
   • A parent identifier known as parent process ID
   • Many threads
Every process has a parent process, but sometimes a parent process is terminated before the
child process is terminated, thus the parent information might be outdated. So this case
process might refer to a nonexistent parent [6]. The structure of the process in Windows
is shown as an executive process (EPROCESS). A process consists of one or more threads
[7]. Threads are mostly a subset processes which make threads dependent. In Windows OS,
threads are known as executed thread (ETHREAD) structures. Since the threads are a crucial
element of a process, they need to be touched on briefly too. Threads schedule a process and

                                                                                           5
2. Foundations
it is the base unit of the operating system that allocates processor time [7]. Threads consist
of the following components:
• A unique identifier known as thread ID
• Thread local storage
• Kernel and user space stack contents of a set of CPU registers representing the state of
the processor [11]
Another crucial element of the process is Process Environment Blocks (PEB) which located
address space in the process. A PEB allows the information accessible from application runs
to be used in user space [6]. This important property allows us to attain process information
without administration privileges. In the next chapter, where implementation details are
described, Process Environment Block usage is clearly emphasized. The figure below gives an
overview of the data structure associated with processes and threads.
Figure 2.1: Data structures associated with processes and threads
[6]
62. Foundations
To understand process objects in depth, the following figure illustrates the details:
Figure 2.2: The executive process structure and its embedded
kernel process structure [6]
72. Foundations
Process environment block, as mentioned previously, survives in the user-mode space. The
PEB provides valuable information that could be consumed by image loader, heap manager,
and some other components in the user space. Without PEB, there is no way to fetch such a
piece of information from the user mode by bypassing admin privileges. For instance, executive
processes and kernel processes are exclusively reachable by kernel mode. Hereafter, the PEB
is a vital instrument in the implementation part. Here is an illustration of the PEB to observe
it more closely [6].
Figure 2.3: Fields of The Process Environment Block [6]
PEB is used for internal operations such as System services. Winternl.h is the corresponding
API that provides sufficient methods [8].
Protected Processes
The term of protected processes only runs the programs signed by Microsoft. The new security
model was started in Windows Vista™ to protect the kernel against vicious attacks. The core
difference between a non-protected process and a protected process is the accessibility of
other processes in the system [9]. According to the new security model, only the process
that contains a debug privilege token is permitted to access any other running process on the
system. For instance, Windows Task Manager and Process Explorer require permission to
access other processes to perform their functionality. Here are some special operations that
could be performed by the protected process
• DLL injection
• Access to protected process virtual memory
• Debugging running protected processes
• Duplicate a handle of a protected process
82. Foundations
• Modify the ratio or running set of a protected process
A regular process cannot perform the tasks listed above. In the coming subsection we will see
process life in windows.
2.1.2 Process Creation and Termination
Every process that runs on an operating system has a lifetime. Windows provides multi-
ple ways for creating processes. These tasks could be handled by invoking functions such
as CreateProcess, CreateProcessAsUser, CreateProcessWithTokenW, CreateProcessWithLo-
gonW [10]. The choice of function to create a process, depends on the use case. There are
four types of process in Windows 10, and those are [11]
• User Processes: Launched by user or from an application launched by user.
• Service Processes: Typical service processes such as svchost.exe run in the background.
• Hard-wired Session Manager, these processes are not the same as service processes. For
instance, the networking module processes that connect directly with the router.
• Environment Subsystem Server Processes: These instruments are part of the support
for the OS environment, or personality, shown to the user or programmer.
Each process executed by CPU will be registered in the process table or known as a process
control block that is managed by kernel. An overview of a process control block :
Figure 2.4: Process Control Block [12]
92. Foundations
The PCB pointer points to the next process to be executed, the process state stores the
current process status like whether it is ready, has run or is waiting. The process number is
the unique ID of the process, whereas the program counter stores the next instruction. The
register is a CPU register. The memory limit could include base and limit registers, and the
accounting information is the amount of CPU usage [12].
The general process life cycle works as below, via the CreateProcess function: Note, the
application that has been developed during this study uses the CreateProcess function which
meets our study requirement.
Figure 2.5: Process Creation Stages[6]
briefly explain each stage:
1. Validate parameters; convert Windows subsystem flags and options to their native coun-
102. Foundations
terparts; parse, validate, and convert the attribute list to its native counterpart.
2. Open the image file (.exe) to be executed inside the process.
3. Create the Windows executive process object.
4. Create the initial thread (stack, context, and Windows executive thread object).
5. Perform post-creation, Windows-subsystem-specific process initialization.
6. Start execution of the initial thread.
7. In the context of the new process and thread, complete the initialization of the address
space (such as load required DLLs) and begin execution of the program [6].
Figure 2.5 briefly shows process creation in Windows by invoking the CreateProcess function.
In the next part, the existing tools that intercept processes in Windows will be explained and
its approaches will be noted.
2.2 Existing Process Intercepting Tools and Their Approaches
2.2.1 Strace for NT
Strace for NT is a command-line and diagnostic tool that captures system calls made by a
process. It is similar to strace in Linux in the way of functionality. However, Strace for NT
requires a device driver installed on the system; therefore, it has to run as an administrator
privilege. The Strace for NT hooks every system call on the system, and a device driver
handles the hooking. The data by tracing collected the exact device driver. The used hooking
technique is the same as in Undocumented Windows NT.
Strace for NT works on NT4 SP4, SP5, and SP6; Windows 2000 GA, SP1, SP2, and SP3,
and has preliminary support for Windows XP [12].
The facts about Strace for NT:
• For full functionality it requires an admin privilege
• The system must be rebooted in the case of uninstalling
• Source code is available
For regular users noted from [12], "If non-admins are granted the SeDebugPrivilege, they
will be able to run Strace too, but the SeDebugPrivilege gives users multiple avenues of
promoting themselves to admin, anyway". The application is not maintained and developed
anymore and the latest version support is in place for Windows XP, which is an outdated
version of Windows. Strace for NT does not help for this study due to the reasons listed
above.
2.2.2 StraceNT
StraceNT is another tool that works similarly to Strace in Linux. It traces Win32 calls and
system calls imported from other DLLs. StraceNT features:
112. Foundations
• Use IAT patching which is a very efficient way to trace functions
• Provides excellent include/exclude support to give finer control over tracing
• Trace functions calls made to DLLs are loaded dynamically using LoadLibrary
• Graphical UI and command-line version
• Open-source and free software
StraceNT limitations are:
• No support for non-admin accounts
• Does not trace recursively, so that the child process is not traced
• The function invoked by GetProcAddress will not be traced
Supported platforms are:
• Windows 2000
• Windows XP (32-bit)
• Windows 2003 (32-bit)
• Windows XP (64-bit) - For tracing 32bit process *only* running inside wow64
• Windows 2003 (64-bit) - For tracing 32bit process *only* running inside wow64[13]
StraceNT is not maintained anymore and does not support the version of current windows.
Due to facts that are listed in the limitations, and the outdated status of the software, we
eliminate it for this study.
2.2.3 Process Monitor
Process Monitor is a compelling Windows debugging and diagnostic tool developed by Mi-
crosoft. It allows real-time monitoring of all processes on the system, meaning that it requires
admin permission. The tool is capable of reaching depth process information in userspace and
kernel space. It owns many features, here are some of them [13]:
• Capture process details and its children, including sessionID, userID, and command-line
options
• Extract logs in different formats
• Filter option where customizing the tracing process is allowed
• Configurable and moveable columns for any event property
• Graphical User Interface support
The Process Monitor does much more than the features listed above (see [13]) and the tool
could be installed freely on the Microsoft website. Furthermore, the Process Monitor core
maintainer Russinovich (2021) recently announced and released a version of Process Monitor
for the Linux operating system. It is open-source and licensed under MIT [49].
122. Foundations
The program runs on:
Client: Windows Vista and higher.
Server: Windows Server 2008 and higher.
Process Monitor does not fit our needs and is a more general-purpose usage tool that
requires admin privileges. Moreover, the output of the Process Monitor does not allow the
replay of the complete process of compilation again. Hence, our study requires specific infor-
mation in a certain format. Here is a screenshot showing how the process monitor appears
[13].
132. Foundations
Figure 2.6: Process Monitor[13]
142. Foundations
2.2.4 Wtrace
Wtrace is another command-line tool for capturing trace events from the Windows operating
system. It uses the Microsoft TraceEvent library that allows the collection of process event
data. EventTrace is a relay of Event Tracing for Windows(ETW) events from the operating
system [14]. wtrace requires admin permission due to underlying technology (ETW). It is an
open-source project and actively maintained [15]. Features:
• Trace File Input and Output operation
• Trace Registry operation
• Trace TCP/IP connection and RPC calls
• Multiple or single process can be traced
• Recursive tracing
• Filtering events by process ID, process name, event name, etc.
Here is how the application looks from command prompt:
C: \ U s e r s \mehme\ Desktop \MODULE\BA\ o t h e r t h e s i s >w t r a c e . exe −−h e l p
w t r a c e v3 . 1 . 2 1 6 2 . 2 1 − c o l l e c t s p r o c e s s or system t r a c e s
C o p y r i g h t (C) 2021 S e b a s t i a n S o l n i c a ( l o w l e v e l d e s i g n . o r g )
V i s i t h t t p s : // w t r a c e . n e t t o l e a r n more
Usage : w t r a c e [ OPTIONS ] [ p i d | imagename a r g s ]
Options :
−f , −− f i l t e r =FILTER D i s p l a y s o n l y e v e n t s which s a t i s f y a g i v e n FILTER .
( Does not impact t h e summary )
−−h a n d l e r s=HANDLERS D i s p l a y s o n l y e v e n t s coming from t h e s p e c i f i e d HANDLERS.
−c , −−c h i l d r e n C o l l e c t s t r a c e s from t h e s e l e c t e d p r o c e s s and a l l i t s
children .
−−n e w c o n s o l e S t a r t s t h e p r o c e s s i n a new c o n s o l e window .
−s , −−system C o l l e c t o n l y system s t a t i s t i c s ( P r o c e s s e s and DPC/ISR )
− shown i n t h e summary .
−−nosummary P r i n t s o n l y ETW e v e n t s − no summary a t t h e end .
−v , −−v e r b o s e Shows w t r a c e d i a g n o s t i c s l o g s .
−h , −−h e l p Shows t h i s message and e x i t s .
Hence, the focus of Wtrace is tracing Windows events that collect from the TraceEvent
library, it does not provide required information for this study. Wtrace might be extended
for the aim of this study but underlying technologies do not allow the running of the software
without admin permissions.
2.2.5 NtTrace
NtTrace allows simple tracing via Windows Native API, a strace-like tool. NtTrace uses the
Windows Debug API to intercept Native API, where Native API serves as an interface be-
tween the application layer and kernel [17]. NtTrace runs on user space and traces only specific
processes and its children. The tool via Windows Debug API sets breakpoints in NtDll around
152. Foundations
the native Windows calls into kernel [17]. The Native API is provided by ntdll.dll which is
not documented well. Geoff Chappell (2021) noted this issue,
"Very few NTDLL functions are documented as being exported from NTDLL. Finding these
few is difficult enough since what documentation does exist is scattered. That a function is not
marked above as “documented” does not mean for certain that Microsoft does not document
it, just that I haven’t yet found where" [49].
The Win32 debug API has two core functions ContinueDebugEvent and WaitForDe-
bugEvent that provides a notification when a debug event comes from a process that is being
debugged, and resumes it as soon as the process has ended. To use both functions, the
DEBUG_PROCESS flag has to be added during process creation. This allows the debug op-
eration to function recursively. Otherwise the DEBUG_ONLY_THIS_PROCESS flag can be
passed as a parameter during process creation, which only debugs the parent process. These
flags establish the communication between the parent and child process. The parent process
collects the following information from the child process:
• Start/Exit of child process
• Exceptions
• Some other events related to child process
As we previously noted, the process that was triggered by the build system starts as a root(init)
process, which is the build system itself, followed by the root spawn child processes. Parent-
child process communication depends on the operating system. For instance, in the unix-like
operating system, if the parent has to wait until the child process is terminated, then the wait()
function has to be invoked and the parent will be notified via SIGCHLD [53,54]. A similar ap-
proach is seen in Windows and is handled by the WaitForDebugEvent function. More details
about implementation will be handled in the Design and Implementation chapter. Hence the
Windows Debug API does not rely on kernel space and does not require any driver, it runs
simply in a user space that allows the performance of debugging without admin permission.
This important aspect is that we use NtTrace as a starting point for our custom application.
We give an overview of tools and their approach to gaining process debug information in a
Windows operating system. This shows that there are multiple ways of tracing the process in
the Windows operating system. The significant difference between tools and underlying tech-
nology is whether a tool runs with administrative rights or whether an arbitrary user may
perform debug actions on the system. In conclusion, we might summarize that a debugger
could use the following approaches to access process debug-infos:
• Hooking into dll
• Event Tracing for Windows(ETW) to capture all system calls
• Microsoft TraceEvent API
• Native API via Windows Debug API backed by NtDll
It depends on what is supposed to be traced and how far the events need to be collected.
In the implementation chapter, the NtTracer function will be addressed closely with details.
162. Foundations
2.3 Build Automation Technologies
The essential job of a build system is that it converts a source code into a machine-consumable
binary using a set of tools like a compiler [18]. A compiler is defined in Britannica as a computer
software that translates (compiles) source code written in a high-level language (e.g., C++)
into a set of machine-language instructions that can be understood by a digital computer’s
CPU. A compiler runs multiple steps to transform the source code to an executable. The
steps might be briefly explained as below:
• Parsing, the syntax tree will be built and the correctness of language will be validated.
• Compiling, transform actual source code after parsing stage, to assembly instruction.
• Assembling, converts machine consumable instructions.
• Linking, link object files with libraries and build the connection to an operating system
[52].
However, a compiler is a complex piece of software, each stage covers a lot of details which
we will not cover here. The transformation process may contain hundreds of commands that
require a particular execution order to get a desired product [19]. Figure 2.7 illustrates a
dependency graph of the build operation which is similar on all build systems.
Figure 2.7: Build Dependency Graph[44]
172. Foundations
In the daily software development life-cycle, a developer runs the build system dozens
of times per day to compile the implemented code. Furthermore, in modern software devel-
opment, the build system is triggered by a continuous integration system at least for every
single commitment and changes on source code. Without a build system today, the software
development is unimaginable. Although the build system has a critical role, its maintenance
and development are ignored or are overhead for developers [19]. One reason for the ignorance
might be the complex structure of the build systems. In the following, some well- known
build systems will be briefly introduced. These tools are created with different intentions and
motivations. The build systems might be categorized as high level build systems, low level
systems and the tools that require certain conventions.
2.3.1 High Level Build Systems
The high level build system does not necessarily require all details of how a project will be
built. These tools generate build scripts for low level build systems and describe the project
as a higher abstraction layer. Here are some of them:
Autotools
This tool is a collection gadget known as a GNU build system. The Autotools has two main
objectives: 1. Simplify portability and allow the developer to write simple rules rather than
writing a complex makefile to compile the application. 2. Facilitates the creation of programs
that are distributed as source code [22].
The core components of GNU Autotools are:
autoconf which generates the configure script.
automake allows the developer to create a portable Makefile.
libtool has a standardized dynamic and static libraries [24].
GNU Build System also has more components such as gettext, m4 and perl that are required
by automake.
CMake
CMake is also an open-source and cross-platform tool that can build, test, and package soft-
ware. CMake has the configuration file CMakeLists.txt where the project-specific configuration
is specified. The compiler, language standard, build type, and more actions could be taken in
the configuration file [25].
Here is a sample configuration file: CMakeLists.txt:
cmake_minimum_required (VERSION 3 . 1 9 )
p r o j e c t ( hello_cmake )
add_executable ( hello_cmake main . cpp )
CMake works perfectly in a modulated way which allows separation of duty. For each task,
a corresponding configuration file can be written with the CMake extension. Some other
features of CMake are [26]:
• Support multiple compiler in the same project
182. Foundations
• Easy integration of third party libraries
• Continues Integration support
• De facto for C++ projects with its maturity and reliability
• Cross-compiling for different architecture
CMake is the most used build tool in the C++ language ecosystem according to a jetbrains
survey in 2019 [27].
CMake uses its own language, known as CMake language that is essentially a scripting lan-
guage. CMake is a high-level tool and independent platform that generates Makefile, Ninja
files depend on the target system [28].
SCons
SCons is an open-source build tool that is a mixture of make and autotools, owning their own
features. It is also supposed to be faster. Some notable features are [25]:
• The configuration files language is Python, allowing it to benefit from Python features.
• Automatic dependency analysis
• Build support for multiple languages including C, C++, D, Java, Fortran, Yacc, Lex,
Qt and SWIG.
• Microsoft Visual Studio project could be built.
SCons has actively been developing through the community since it was created in 2000. Big
softwares like Blender are built by SCons.
Meson
The Meson build-system, designed to optimize, is an out-of-the-box support system for modern
software development practices, and easy to use for developers [29]. The essential design
motivation of Meson has been simplicity, clarity, and conciseness, where Meson was inspired
by python language in the sense of readability and simplicity [30]. The major build directory
structure is similar to CMake which consists of two stages: configure and build. Hence, Meson
is a high level build system, and it only requires source files and a project name. Below is a
simple configuration file. It does not require compilation details, however, further compilation
details could be added to the config file.
meson.build
project ( ’ tutorial ’ , ’c ’ )
e x e c u t a b l e ( ’ t e s t p r o j e c t ’ , ’ main . c ’ )
MSBuild
Microsoft Build Engine, known as MSBuild, is a native build platform for the Windows oper-
ating system. It provides a frame in an XML file and describes how the build process will be
completed [40]. Visual Studio uses MSBuild for compiling C++, F and CSharp projects, how-
ever MSBuild does not necessarily require Visual Studio, the MSBuild runs from a command
192. Foundations
prompt [40]. MSBuild conceptually consists of four components; properties, items, tasks, and
targets, and walks through those components while building a project [41]. For a C++ project
the build process is defined in a project file (.vcxproj) that is modifiable as needed. In MSbuild
projects, the targets that apply specific operations to the project where the input and outputs
are needed by this operation are very important . A target may consist of multiple tasks.
The project file could be generated via other build systems, such as CMake which supports
MSBuild configuration files too.
qmake
qmake is a platform-independent build system that allows the generation of Makefiles for a
project. The projects does not has to be a qmake project, it could be used without any
further action and it supports macOS with human readable syntax. A sample configuration
file qmake_gprof.pro:
CONFIG += debug
HEADERS += h e l l o . h
SOURCES += h e l l o . cpp
SOURCES += main . cpp
win32 {
SOURCES += h e l l o w i n . cpp
}
un ix {
SOURCES += h e l l o u n i x . cpp
}
As it is in sample configuration, the file shows ease of readability and configuration for different
platforms [43].
2.3.2 Low Level Build Systems
The low level build systems describe the actual build process with its details such as a compiler.
The configuration language is not always human friendly. The abstraction layer is close to
the actual compile level and does not generate further configuration files. Below are some of
those tools.
Make
Make is one of the earliest build tools in the software industry introduced by Feldman [21].
Make enables a run build process in a declarative way. Make requires a configuration file which
is named explicitly makefile. The essential idea behind Make is that it looks for named targets
in the configuration file and ensures the existence of all dependencies as well as their latest
versions. After that it creates the target. The configuration file is a depth-first search of graph
dependency to determine necessary work to be done [22]. Today, there are different public
rewrites of Make such as Microsoft nmake, the GNU Make gmake and the BSD Make pmake.
Make works by invoking the make command and the build process will start automatically. In
Chapter 4 the sample project will be built by Make and the other build system during build
interception.
202. Foundations
Ninja
Ninja is an open-source build system that concentrates on speed. To compare ninja with
other build systems, ninja is an assembler whereas others are high-level languages. The ninja
configuration file could be generated by CMake and it could be written explicitly as well.
However the configuration language is humanly readable but still hard to read [41].
2.3.3 Convention Based Build Systems
Convention over Configuration (CoC) is a special pattern of implementation. Miller (2009)
noted, "CoC is a design philosophy and technique that seeks to apply defaults that can be
implied from the structure of the code instead of requiring explicit code" [48]. The build
system in this category does not necessarily require the source files as long as the structure
of the project filled the build system requirements. Since the CoC is a design philosophy, it
is used in other fields of technology as well. Here are some build system works with the CoC
principle.
Gradle
Gradle is another open-source software build tool that focuses on flexibility and perfor- mance
[31]. Gradle uses the Groovy language as a configuration file. The core concept of Gradle is
that it is a task-based build process which builds as Directed Acyclic Graphs (DAGs) of units
of work. Literally the task will be created based on their dependencies that are created by
DAGs [32]. Gradle uses the so-called Convention Over COnfiguration (CoC) pattern where
the developers need to follow certain conventions of the framework with no need for further
configuration [33].
Figure 2.8: A task graph sample[32]
212. Foundations
Maven
Maven is another build system that works with the CoC principle and hides details of build
procedures from the developer. The Maven build system is well-known in the Java ecosystem
and not only as a build system but also for dependency management. A developer does not
need to know how the compile process works in the background, but can instead focus on the
implementation of the software [49]. Maven also has a certain directory structure that has to
be followed by the developer.
2.3.4 Recent Studies
Due to being an important part of software development since the 1970s, the build system
has always had a significant research field. Different research focuses on different parts of the
build system to make it more maintainable, robust and performant. Here are some relatively
new resources in the build systems.
An approach presented by Kubota and Kono is unity build, with a sophisticated bundle
strategy which uses a technique that bundles multiple source files into one instead of running
them sequentially. To optimize and improve this approach, Kubota and Kono developed a new
bundle strategy that is based on hints from prepossessed sources. Here is the strategy they use
for bundling: 1. Bundling source files with high header-file similarity 2. Bundling source files
with similar compile time According to their study, the sophisticated bundle strategy achieves
better build performance than CMake-unity, Meson-unity and Webkit-unity in large C/C++
projects [46].
A further approach is from Smits, Konat and Visser, using an incremental compiler per-
spective where they separate compilation and the build process. The key point is that the
compiler reads files and splits them into small pieces, known as data splitting. These small
parts will be compiled, corresponding to a build task. The incremental build system allows
the definition of compiler stages as well. These stages and tasks cache the build process that
could be reused as needed [47].
Hassan and Wang describe another approach named HireBuild (History-Driven Repair of
Build Scripts), which generates patches for build scripts. This approach consists of three main
steps:
1. Build log analysis which logs a lot of useful data that probably addresses the reason for
build failures.
2. Build-fix-pattern templates, the common domain-specific operation for the build process.
3. Build Validation, the information from build logs and build script failure generate a ranked
list of patches that apply build script as long as build is favorable [48].
The next chapter is about the design and implementation of PTracer, which we have developed
during this study. The next chapter is about the design and implementation of PTracer that
we developed during this study.
22Chapter 3
Design and Implementation
This chapter describes the implementation details of PTracer that have been developed during
this bache- lor thesis. PTracer is a command-line tool for tracing a program and extracting
the execution path and command-line parameters of a targeted application. The section gives
a brief overview of how the application works through a simple flow chart. In the second
section, equipment and tools are covered, and the third section describes used approaches and
instruments to trace processes as well as libraries and modules. Details about the compilation
database are divided under corresponding subtitles.
3.1 Application Workflow
This section gives an overview and comprehension about how PTracer works. The application
takes the program(target) that is going to be traced and then the target application can be
started. After the execution of the program is completed, beside the terminal output, two
JSON files are extracted.
233. Design and Implementation
Figure 3.1: Application workflow
3.2 Equipment and Tools
PTracer is developed in C++, since the C++ is the one of the native languages to interact
with the Windows Operating System. Many APIs are used for accessing the specific system
resources implemented in C/C++. Due to those advantages, the decision is made in favour of
C++. For an integrated development environment (IDE), the Visual Studio 2019 Community
Edition is used.
243. Design and Implementation
3.3 Approach and Instruments
Microsoft provides multiple ways to trace processes on Windows. One way is using Event
Tracing for Windows (ETW) for the user and kernel-level tracing that allows log kernel or
application-defined events to become a log file [15]. Hence ETW requires administrative per-
missions, and the implementation decision is made to follow NtTrace. The NtTrace approach
is elegant and does not require privileges. For that reason, PTracer uses the underlying tech-
nologies from NtTracer. The process debugs information which will be captured by setting
breakpoints in NtDll around Windows system calls into the kernel.
Create Child Process
This part of the tool is inherited from NtTrace where it explicitly shows how the child process
will be created and which parameters will be given during this process. The code snippets
below are taken over from NtTrace, which allows us to create a child process and via debug
API, reach the debug information of each created process. By using Processthreadapi process
creation and setting Debugging flags is allowed. The Debug flags allow different types of
process tracing.
C r e a t e P r o c e s s ( 0 , const_cast(cmdLine . G e t S t r i n g ( ) ) , 0 , 0 , true ,
DEBUG_PROCESS, 0 , 0 , &s t a r t u p I n f o , &P r o c e s s I n f o r m a t i o n )
The DEBUG_ONLY_THIS_PROCESS flag allows trace only current process, not children
processes. The DEBUG_PROCESS is for recursive process tracing. The calling thread begins
and debugs the new process and all child processes created by the new process [20]. There
are many available process creation flags that can be seen in Microsoft documentation. In
the PTracer implementation, the DEBUG_PROCESS is used because it accesses all related
debug information via Debug API functions; WaitForDebugEvent and ContinueDebugEvent
from the process is the root of a debugging chain. This continues until another process
in the chain is created with DEBUG_PROCESS [20]. In processes that have parent-child
relationships, the parent process will not be terminated until an exit notification is received
from its child. The crucial part of the application is where the root process is in the waiting
state, however, we have modified this method by removing unrelated cases which indicate
further debug information. See below:
do
{
DEBUG_EVENT DebugEvent ;
DWORD c o n t i n u e F l a g = DBG_CONTINUE;
i f ( ! WaitForDebugEvent(&DebugEvent , INFINITE ) ) {
throw s t d : : r u n t i m e _ e r r o r ( "Debug␣ l o o p ␣ a b o r t e d " ) ; }
switch ( DebugEvent . dwDebugEventCode )
{
case CREATE_PROCESS_DEBUG_EVENT:
OnCreateProcess ( DebugEvent . dwProcessId , DebugEvent . dwThreadId ,
DebugEvent . u . C r e a t e P r o c e s s I n f o ) ;
break ;
case EXIT_PROCESS_DEBUG_EVENT:
OnExitProcess ( DebugEvent . dwProcessId , DebugEvent . u . E x i t P r o c e s s ,
m_isVerbose ) ;
break ;
253. Design and Implementation
case EXCEPTION_DEBUG_EVENT:
i f ( ! a t t a c h e d ) { a t t a c h e d = true ; }
e l s e i f ( DebugEvent . u . E x c e p t i o n . ExceptionRecord . ExceptionCode
== STATUS_WX86_BREAKPOINT && m_isVerbose ) {
s t d : : c o u t3. Design and Implementation
via psapi.h. In the PSAPI, the function DWORD GetModuleFileNameExA(HANDLE hPro-
cess, HMODULE hModule, LPSTR lpFilename, DWORD nSize) takes multiple parameters,
but the essential one is the first parameter, the hProcess that references the current running
process. The function returns the full path of the running process [38].
Extracting Build Process In JSON Format
JSON (JavaScript Object Notation) is a widely spread data transfer format that is easy to
read and use [38]. Due to the ease of use and for further usage, the JSON is selected as an
output format.
PTracer requires a program as an argument and observes it during execution. During the
execution of the program, PTracer accesses command-line parameters and the directory of the
current process by invoking an instance of the Process class. The process of creating structure
runs in a parent-child relationship; that is why the extracted information also has to be a
corresponding data structure. For handling structure, a process class is implemented to store
data in a tree data structure. The function TraverseAndInsertChild(Process) for each process
is created, will traverse the tree and find the parent of the process and insert it as its child
recursively. With the same logic, we will traverse and extract commands from each process
respectively.
void P r o c e s s : : T r a v e r s e A n d I n s e r t C h i l d ( P r o c e s s& p )
{
f o r ( auto& c : this−>c h i l d r e n )
{
i f ( p . ppid == c . p i d )
{
c . InsertChild (p ) ;
break ;
} else c . TraverseAndInsertChild (p ) ;
}
}
A process class instance is used as a root process, and for every following process, the tree
structure will be traversed and the new process inserted into the correct parent. Hence, the
data structure is a tree, and the data are stored as data lay under the root process. The end
of process execution, initial process, and the root process will be recursively traversed, and
the data will be manipulated to the JSON format. Finally, the data will be written in a JSON
file. The JSON output is also parsed via an external library called JSON for Modern C++
[39]. This library formats the output into a JSON file. However, there are two JSON files as
output at the end of the execution of the PTracer, one of them is also a valid JSON format
without indentations. To demonstrate how PTracer works and to see the output formats, a
simple c++ program will be compiled with g++ to keep it simple. The Figure 3.3 format is
an unformatted JSON output without an external library and Figure 3.4 is parsed by JSON
for Modern C++, initially implemented by Niels Lohmann and over time has become an
open-source library with over one hundred contributors. The first format is an unformatted
JSON output without an external library. The formatted output shows clearly the hierarchical
relationship between processes where the parent-child relationship made through indentations.
Even the compilation process of a simple Hello World program consists of many steps and
273. Design and Implementation
files,and it is hard to illustrate here without losing readability. For that reason, we compiled
and assembled the sample project. Here is the illustration of the compile and assemble steps
for the sample program.
Figure 3.2: The JSON Output via JSON for Modern C++
28Chapter 4
Evaluation
The aim of this chapter is to evaluate and test our approach for analyzing build and compile
processes of arbitrary applications. For this purpose, we will use the PTracer application that
we developed during this study. PTracer allows the capture and replay of completed processes.
Multiple open source projects with various build systems will be analysed via PTracer.
4.1 Procedure
Since we have to compile each project for binary analysis, the selected project has to be source
accessible. For this reason, we have chosen open source projects which are hosted on GitHub.
The analysis steps are as follow:
1. Find a project
2. Resolve the dependencies of the project
3. Fulfill the requirements
4. Compile the project while capturing via PTracer
5. Separate the output files(binary or library)
6. Replay build process via extracted script again
7. Analyse the outputs
We have used the workflow above, for each project that we have investigated. The main task
of the implemented tool is that all details about compilation processes such as compilation
parameters, source code, compiling and linking time, etc are extracted and this information
captured and written in files with a valid JSON format. After capturing and replaying com-
plete build processes, we have two binaries. These binaries could be analysed in various ways.
For instance, the binaries could be executed and we can observe the execution of them and
note the behaviour of the applications. However, in most cases the difference between binaries
might be not observable this way, because the difference might not change the application
behavior directly. Another option to analyse such possible minor changes is using an external
tool that shows more details about changes and modifications on binaries. For investigation
we use some available tools.
294. Evaluation
The static analysis of binaries gives information about whether any modifications or rather
differences between captured and replayed binaries are present. The projects are real-world
applications and big, complex ones to small size projects will be analyzed. Finally, all results
will be evaluated.
GNU diff
Takes the files as arguments and compares them line by line.
d i f f [OPTION ] . . . FILES
GNU cmp
compare two files byte by byte
cmp [OPTION ] . . . FILE1 [ FILE2 [ SKIP1 [ SKIP2 ] ] ]
objdump
The Linux man page describes “objdump and displays information about one or more object
files. The options control what particular information to display. This information is mostly
useful to programmers who are working on the compilation tools, as opposed to programmers
who just want their program to compile and work". The tools above, will be used in combi-
nation, or rather they will back each other up to investigate the outputs. The diff tool and
objdump will be used in a single command as below:
$ d i f f4. Evaluation
Here is the JSON output that shows the hierarchical relationship between processes. However,
a compilation process is complex and consists of many steps depending on project size. Below
is only part of those instructions that allows the observation of process structure.
Figure 4.1
The result of the command above an executable, two JSON files and a batch file will be
created. We will put the executable in a folder named captured. Afterwards, the compile.bat
will be executed to replay all processes exactly again. In compile.bat all commands and
parameters used during the compiling process are recorded.
C: \ U s e r s \mehme\ sample−c c \ c o m p i l e . bat
314. Evaluation
Figure 4.2: Compare Binaries
4.2 Projects
For the evaluation of this study we will use many projects. The criteria for selecting projects
are:
• The projects have to be open-source
• Preferably large and known projects
• Preferably, projects with different build systems
• Manageable dependencies in Windows Operating System
All projects are hosted on GitHub and we analysed and compiled each project individually.
Since the projects are open source, it is possible to make changes anytime. The results for
each project correspond to the given accessed time.
Spdlog - Fast C++ logging library
Spdlog is a widely used simple, header-only C++ logger library. Spdlog supports Windows,
Linux, MacOS and many other platforms.
Build system: CMake
Compiler: g++.exe
Dependencies:
Languages: C++
URL: https://github.com/gabime/spdlog
Line of Code(LoC):
Accessed: 15.05.2021
Projects details:
g i t h u b . com/ A l D a n i a l / c l o c v 1 . 8 2 T=0.31 s ( 5 2 7 . 5 f i l e s / s , 1 4 6 6 7 5 . 5 l i n e s / s )
−−−−−−−−−−−−−−−−−−−−−−−−−−−−−−−−−−−−−−−−−−−−−−−−−−−−−−−−−−−−−−−−−−−−−−−−−−−−−−−
Language files blank comment code
−−−−−−−−−−−−−−−−−−−−−−−−−−−−−−−−−−−−−−−−−−−−−−−−−−−−−−−−−−−−−−−−−−−−−−−−−−−−−−−
C/C++ Header 95 5912 3388 28928
C++ 36 711 308 3476
CMake 24 196 176 1085
make 2 194 131 375
Markdown 1 62 0 374
324. Evaluation YAML 2 26 11 146 SVG 1 0 0 43 reStructuredText 1 5 0 22 Python 1 4 0 13 Bourne S h e l l 1 4 0 12 −−−−−−−−−−−−−−−−−−−−−−−−−−−−−−−−−−−−−−−−−−−−−−−−−−−−−−−−−−−−−−−−−−−−−−−−−−−−−−− SUM: 164 7114 4014 34474 −−−−−−−−−−−−−−−−−−−−−−−−−−−−−−−−−−−−−−−−−−−−−−−−−−−−−−−−−−−−−−−−−−−−−−−−−−−−−−− command: PTracer.exe CMake -G "MinGW Makefiles". PTracer takes CMake and its argu- ments as argument After compiling spdlog via CMake, it generates makefiles. Figure 4.1 shows that by replaying the build process, at least the size difference is observable. The command below d i f f
4. Evaluation

command: PTracer scons

                                Figure 4.4: Size and Disassemble Difference

   After the compilation process with the extracted script, we got a library file(dll) for Win-
dows. for each compilation. The tools GNU diff and GNU cmp could not detect any difference.

Make - Command-Line Game of Hex in C++

A command line C++ implementation of Game of Hex during a university lecture at Univer-
sity of California, Santa Cruz. This command line application requires C++11 language as
standard.
Build system: make
compiler: g++.exe
Dependencies: no external dependencies
Languages: C++
URL: https://github.com/MaxLaumeister/hex109
Accessed: 19.05.2021
Projects details:
  g i t h u b . com/ A l D a n i a l / c l o c v 1 . 8 2 T=0.49 s ( 3 2 . 8 f i l e s / s , 2 0 8 3 . 1 l i n e s / s )
−−−−−−−−−−−−−−−−−−−−−−−−−−−−−−−−−−−−−−−−−−−−−−−−−−−−−−−−−−−−−−−−−−−−−−−−−−−−−−−
Language                                           files            blank                  comment                      code
−−−−−−−−−−−−−−−−−−−−−−−−−−−−−−−−−−−−−−−−−−−−−−−−−−−−−−−−−−−−−−−−−−−−−−−−−−−−−−−
C++                                                      4             122                         60                    460
C/C++ Header                                             4                39                       12                    132
JSON                                                     2                 0                          0                   90
Markdown                                                 2                15                          0                   38
DOS Batch                                                2                 5                          0                   20
make                                                     1                 5                          0                   13
YAML                                                     1                 0                          0                    5
−−−−−−−−−−−−−−−−−−−−−−−−−−−−−−−−−−−−−−−−−−−−−−−−−−−−−−−−−−−−−−−−−−−−−−−−−−−−−−−
SUM:                                                    16             186                         72                    758

                                Figure 4.5: Size and Disassemble Difference

34
4. Evaluation
mpags-cipher
A command-line application for line application for text encryption using classical ciphers.
Build system: CMake, make
compiler: g++.exe, clang++.exe
Dependencies: no external dependencies
Languages: C++
URL: https://github.com/mpags-cpp/mpags-cipher
Accessed: 24.05.2021
Projects details:
g i t h u b . com/ A l D a n i a l / c l o c v 1 . 8 2 T=1.32 s ( 2 1 . 9 f i l e s / s , 9 4 8 6 . 0 l i n e s / s )
−−−−−−−−−−−−−−−−−−−−−−−−−−−−−−−−−−−−−−−−−−−−−−−−−−−−−−−−−−−−−−−−−−−−−−−−−−−−−−−
Language files blank comment code
−−−−−−−−−−−−−−−−−−−−−−−−−−−−−−−−−−−−−−−−−−−−−−−−−−−−−−−−−−−−−−−−−−−−−−−−−−−−−−−
C/C++ Header 4 1606 369 7501
C++ 5 155 97 728
C 1 120 50 521
CMake 14 74 50 486
JSON 2 0 0 240
make 1 105 69 189
Markdown 1 39 0 123
DOS Batch 1 0 0 31
−−−−−−−−−−−−−−−−−−−−−−−−−−−−−−−−−−−−−−−−−−−−−−−−−−−−−−−−−−−−−−−−−−−−−−−−−−−−−−−
SUM: 29 2099 635 9819
This project is compiled with two different compilers: Clang and GNU GCC. The binaries
analysis is observable from Figure 4.8, there is no notable difference between captured binary
with replay binary. However, a significant size difference is seen between compilers, the Clang
binary’s is a bit smaller than the g++ binary. By default, the Clang optimization level is
higher than that of GCC.
Figure 4.6: Size and Disassemble Difference
35You can also read