Characterization of the Atlantic Water and Levantine Intermediate Water in the Mediterranean Sea using 20 years of Argo data
←
→
Page content transcription
If your browser does not render page correctly, please read the page content below
Ocean Sci., 18, 129–142, 2022
https://doi.org/10.5194/os-18-129-2022
© Author(s) 2022. This work is distributed under
the Creative Commons Attribution 4.0 License.

Characterization of the Atlantic Water and Levantine Intermediate
Water in the Mediterranean Sea using 20 years of Argo data
Giusy Fedele, Elena Mauri, Giulio Notarstefano, and Pierre Marie Poulain
National Institute of Oceanography and Applied Geophysics, OGS, 34010 Sgonico (TS), Italy

Correspondence: Giusy Fedele (gfedele@inogs.it)

Received: 4 July 2021 – Discussion started: 9 July 2021
Revised: 27 November 2021 – Accepted: 30 November 2021 – Published: 26 January 2022

Abstract. Atlantic Water (AW) and Levantine Intermediate         1   Introduction
Water (LIW) are important water masses that play a crucial
role in the internal variability of the Mediterranean thermo-    Atlantic Water (AW) and Levantine Intermediate Water
haline circulation. To be more specific, their variability and   (LIW) play a central role in the internal variability of the
interaction, along with other water masses that characterize     Mediterranean thermohaline circulation, contributing to the
the Mediterranean basin, such as the Western Mediterranean       dense water formation in this enclosed basin (Tsimplis et
Deep Water (WMDW), contribute to modify the Mediter-             al., 2006). The variability and interaction of these two wa-
ranean Outflow through the Strait of Gibraltar, and hence        ter masses modulate the Mediterranean outflow through the
they may influence the stability of the global thermohaline      Gibraltar Strait, which plays an important role in North
circulation.                                                     Atlantic oceanic variability and in turn in the stability of
   This work aims to characterize AW and LIW in the              the global thermohaline circulation (e.g. Rahmstorf, 2006;
Mediterranean Sea, taking advantage of the large obser-          Hernández-Molina et al., 2014). Therefore, from a climatic
vational dataset (freely available on https://argo.ucsd.edu,     point of view, it is relevant to characterize their main proper-
https://www.ocean-ops.org, last access: 17 January 2022;         ties and monitor their variability, which is the main purpose
Wong et al., 2020) provided by Argo floats from 2001 to          of this paper.
2019. AW and LIW were identified using different diagnos-           Flowing into the Mediterranean Sea through the Gibraltar
tic methods, highlighting the inter-basin variability and the    strait, AW is less dense than the surrounding water masses,
strong zonal gradient that both denote the two water masses      and it therefore populates most of the Mediterranean surface
in this marginal sea. Their temporal variability was also in-    layer. Its path is mainly driven by the Coriolis effect and by
vestigated over the last 2 decades, providing a more robust      the complex topography that characterizes this region (Millot
view of AW and LIW characteristics, which have only been         and Taupier-Letage, 2005).
investigated using very short periods in previous studies due       LIW is the most voluminous water mass produced in
to a lack of data.                                               the Mediterranean Sea (e.g. Skliris, 2014; Lascaratos et al.,
   A clear salinification and warming trend char-                1993), and it is the saltiest water formed with a relatively
acterize AW and LIW over the last 2 decades                      high temperature at intermediate depths. It is formed in the
(∼ 0.007 ± 0.140 and 0.006 ± 0.038 yr−1 ; 0.026 ± 0.715          Levantine sub-basin after which it is named, where one of the
and 0.022 ± 0.232 ◦ C yr−1 , respectively). The salinity and     main formation sites is the Rhodes Gyre (e.g. Tsimplis et al.,
temperature trends found at sub-basin scale are in good          2006; Kubin et al., 2019). LIW strongly influences the ther-
agreement with previous results. The strongest trends are        mohaline circulation, flowing at intermediate depths and then
found in the Adriatic basin in the properties of both AW and     passing over the sills, exiting the Gibraltar Strait, and mod-
LIW.                                                             ifying the Atlantic circulation (Rahmstorf, 1998; Bethoux et
                                                                 al., 1999).
                                                                    Several studies have been devoted to the analysis of the
                                                                 main features and variability of AW and LIW, taking advan-

Published by Copernicus Publications on behalf of the European Geosciences Union.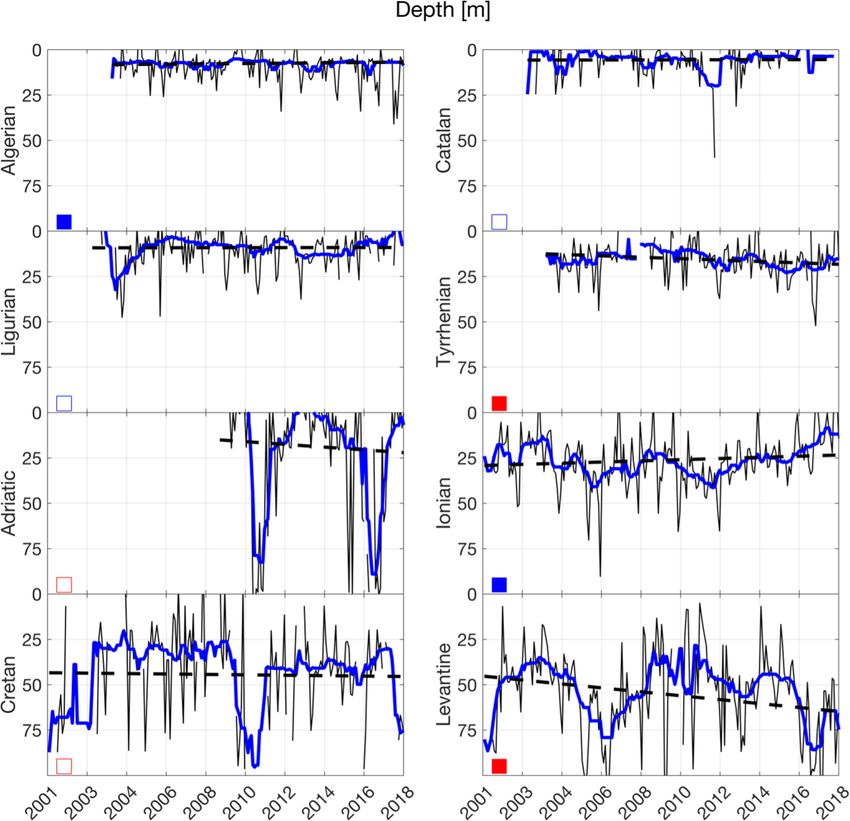
130                              G. Fedele et al.: Characterization of Atlantic Water and Levantine Intermediate Water

tage of different indicators to identify and track these two    vantage of Argo data. Exploring the water column from the
water masses in the Mediterranean Sea. Among these, AW          surface down to 1500 m in seven different regions of the
and LIW are usually referred to the minimum and maximum         EMED, they revealed a high inter-annual variability of the
salinity in the surface and intermediate layers of the water    stored heat and salt over this region.
column, respectively (e.g. Millot and Taupier-Letage, 2005;        In this study, by following a similar approach we investi-
Bergamasco and Malanotte-Rizzoli, 2010; Mauri et al., 2019;     gate AW and LIW properties, isolating their main character-
Juza et al., 2019; Kokkini et al., 2019; Vargas-Yáñez et al.,   istics and variability from the surrounding water masses, tak-
2020). However, different approaches can also be found in       ing advantage of several diagnostics discussed in Sect. 2.2.
the literature. To be more specific, Millot (2014) associated   Our work aims to provide a more robust view of AW and
LIW with the maximum of the potential temperature vertical      LIW characteristics, which in previous studies have only
gradient found in an intermediate water layer, while Bosse et   been investigated over short periods due to lack of data.
al. (2015) identified LIW in the northwestern Mediterranean        In the frame of climate change studies, it is important to
Sea with the maximum salinity value found between two po-       estimate possible impacts of AW and LIW changes on the
tential density values (σθ = [29.03–29.10] kg m−3 ), encom-     Mediterranean climate, since this region is one of the most
passing both temperature and salinity maxima characterizing     vulnerable climate change hotspots (Giorgi, 2006). In fact,
the LIW layer. The main findings related to the hydrological    changes in temperature and salinity can strongly affect the
properties of these two water masses are summarized below.      marine system over the Mediterranean and related human ac-
   AW enters into the Mediterranean Sea through the Gibral-     tivities.
tar Strait, occupying the upper 200 m of depth with po-            Previous studies highlighted a clear salinification of the
tential density, temperature, and salinity annual mean val-     Mediterranean Sea over the past few decades (e.g. Painter
ues: σθ ∼= [26.5–27] kg m−3 , T ∼
                                = [14–16] ◦ C, and S ∼
                                                     = [36.0–   and Tsimplis, 2003; Vargas-Yáñez et al., 2010; Schroeder
36.5], respectively (e.g. Bergamasco and Malanotte-Rizzoli,     et al., 2017; Skliris et al., 2018) and a clear deep water
2010; Hayes et al., 2019). AW flowing at the surface contin-    warming trend after the 1980s, which in the literature is of-
uously interacts with the atmosphere and is subject to evap-    ten related to the Nile River damming and global warm-
oration and mixing with the underlying water masses. Flow-      ing (Vargas-Yáñez et al., 2010). Positive temperature and
ing eastward, it becomes denser and the minimum salinity        salinity trends, oscillating between [0.0016/0.0091] ◦ C yr−1
core sinks. Therefore, it can be capped by the surface mixed    and [0.0008/0.001] yr−1 , respectively, are found in the deep
layer and less influenced by air–sea interactions. Its prop-    layer (below ∼ 700 m) between 1950 to 2005 (e.g. Bethoux
erties and variability are also modified by the local eddies    et al., 1990; Rohling and Bryden, 1992; Millot et al., 2006;
and by the river discharges in the coastal regions. These       Vargas-Yáñez et al., 2010; Borghini et al., 2014).
mechanisms shape the AW, leading to an increase of salinity        This observed salinification and warming are also found at
from about 36.25 in the Strait of Gibraltar to values around    intermediate depths in several studies (e.g. Zu et al., 2014;
39.2 in the Levantine Sea (e.g. Bergamasco and Malanotte-       Schroeder et al., 2017; Skliris et al., 2018), with ranges that
Rizzoli, 2010; Hayes et al., 2019). These values highlight      depend on the region of investigation. A clear positive salin-
strong AW temperature and salinity gradients between the        ity trend between 150–600 m is found in the Mediterranean
western Mediterranean (WMED) and the eastern Mediter-           Sea by Skliris et al. (2018), analysing the MEDATLAS data
ranean (EMED).                                                  from 1950 to 2002 (∼ 0.007 ± 0.004 yr−1 ).
   The properties of the LIW core in the WMED are com-             In contrast, heterogeneous temperature trends are found
monly referred to the following ranges of potential density,    in the upper layer in different regions (Painter and Tsimplis,
temperature, salinity and depth, respectively: σθ = [29–        2003). This sensitivity of the trends to the area of interest can
29.10] kg m−3 , T = [13–14.2] ◦ C, S = [38.4–38.8], and         be due to several reasons, such as the changes in the large-
D = [200–600] m (e.g. Millot, 2013; Hayes et al., 2019;         scale atmospheric forcing of the Mediterranean region, the
Vargas-Yáñez et al., 2020). In contrast, in the EMED            river runoff (which differs from one region to another), and
these properties span over different values: σθ = [28.85–       the data coverage over a specific area (e.g. Painter and Tsim-
29.15] kg m−3 , T = [14.6–16.4] ◦ C, S = [38.85–39.15], and     plis, 2003; Vargas-Yáñez et al., 2009, 2010). In this respect,
D = [150–400] m (e.g. Lascaratos et al., 1993; Hayes et al.,    Vargas-Yáñez et al. (2009) highlighted that the scarcity of
2019). Therefore, moving westward T and S decrease and          data makes trend estimations very sensitive to the data post-
LIW sinks.                                                      processing, comparing results from different studies dealing
   These studies provide a general view of AW and LIW           with the same time period. Therefore, in order to reduce the
properties in the Mediterranean Sea, highlighting a strong      uncertainty of the trend estimations, longer and less sparse
inter-basin variability of these water masses along their       time series are needed.
paths, which in turn influences their temporal changes.            In this respect, this work aims to provide an updated view
   An example is given by a recent paper by Kassis and Ko-      of the temporal evolution and trends of the AW and LIW,
rres (2020), which provides a detailed view of the EMED         taking advantage of the large observational dataset provided
hydrographic properties for the period 2004–2017 taking ad-     by the MedArgo Program (Poulain et al., 2007). It covers the

Ocean Sci., 18, 129–142, 2022                                                        https://doi.org/10.5194/os-18-129-2022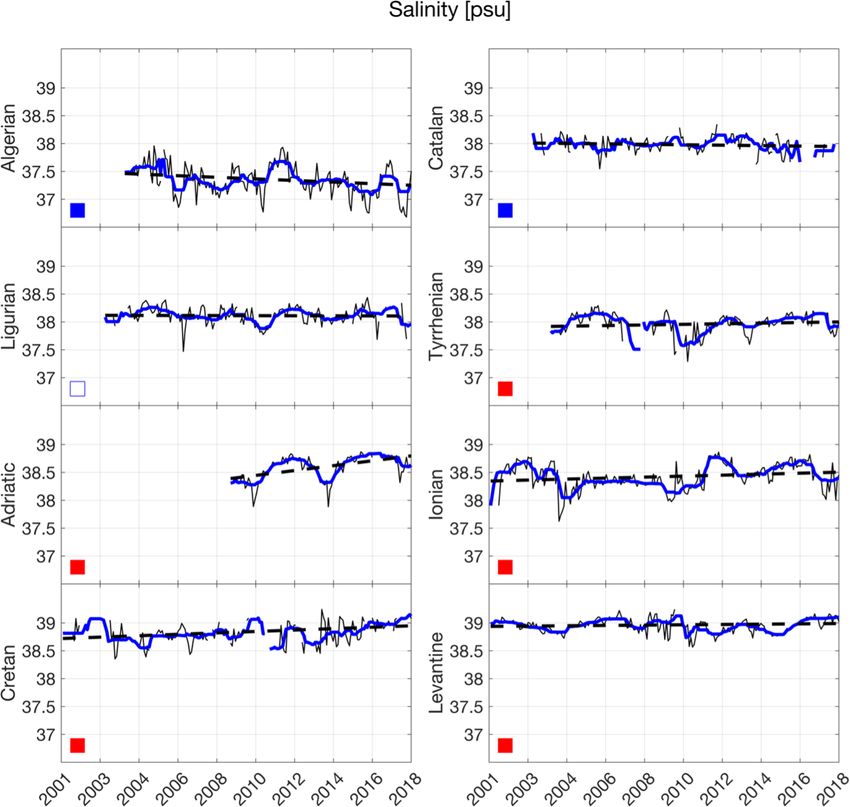
G. Fedele et al.: Characterization of Atlantic Water and Levantine Intermediate Water 131
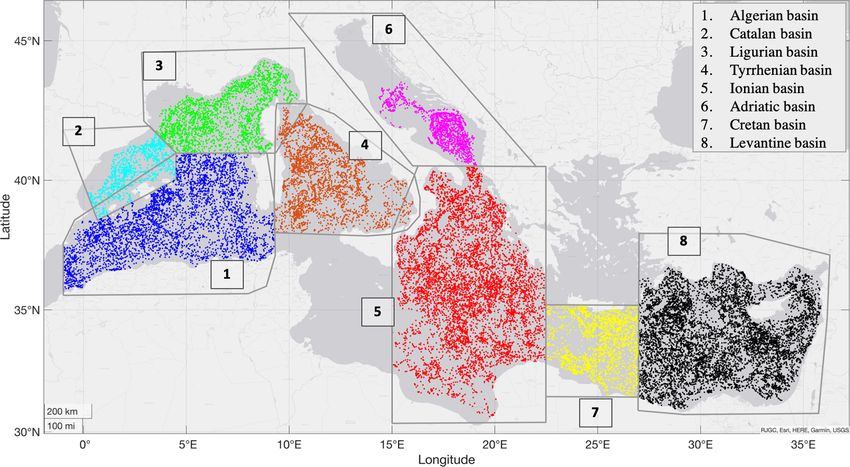
water column from the surface down to ∼ 2000 m over the The analyses are performed in eight Mediterranean
entire Mediterranean basin from 2001 to 2019. The Mediter- sub-basins following the climatological areas defined by
ranean Sea has been widely studied through the deployment the EU/MEDARMEDATLAS II project (http://nettuno.ogs.
of hundreds of Argo profiling floats (Argo, 2020) over the trieste.it/medar/climatologies/medz.html, last access: De-
last 2 decades as part of various national, European, and cember 2021), emphasizing the processes that take place in
global programmes (Wong et al., 2021) and with the partici- each sub-basin and that modify water mass properties. Fig-
pation of different institutions. For these reasons, this dataset ure 1 shows the geographical distribution of the Argo pro-
constitutes an optimal observational framework to investigate files from 2001 to 2019 in the eight sub-basins considered
AW and LIW properties. (Algerian, Catalan, Ligurian, Tyrrhenian, Adriatic, Ionian,
The dataset and the methods used in this study are de- Cretan, and Levantine). The Alboran, Aegean, and the Sicily
scribed in Sect. 2, and the results are presented in Sect. 3, Channel sub-basins are not analysed in this work due to the
where the inter-basin and inter-annual variabilities of AW scarcity of observations in these areas.
and LIW in the Mediterranean Sea are shown. The main con- Most sub-basins are spatially well covered, except for the
clusions are drawn in Sect. 4. Adriatic Sea, where the majority of observations are con-
centrated in the South Adriatic Pit (SAP), and therefore it
is important to keep in mind that the results found for this
2 Data and method region are only representative of the southern Adriatic Sea.
The SAP is an important deep-water convection site in the
2.1 Data
Mediterranean Sea (e.g. Kokkini et al., 2019; Mauri et al.,
In this work the AW and LIW properties in the Mediter- 2020; Mihanović et al., 2021; Azzaro et al., 2012; Bensi et
ranean Sea are investigated taking advantage of the Argo al., 2013), and therefore it is also considered a crucial area
float dataset, which consists of more than 30 000 T –S from a climatic perspective. The temporal distribution of the
profiles for the period 2001–2019. Since 2001, the number float data is different in the various sub-basins: the longest
of observations is generally increasing, reaching a peak time series are available in the Ionian, Cretan, and Levantine
of 4188 profiles in 2015, mainly thanks to the combined regions, with data from 2001 to 2019; followed by the Al-
efforts of national and international Argo initiatives. The gerian, Ligurian, and Tyrrhenian sub-basins where data are
deployments of most Argo floats in the Mediterranean available after 2003; and then by the Adriatic Sea with data
were coordinated by the MedArgo regional centre (Poulain available only after 2009. In this context, it is important to
et al., 2007). In the Mediterranean, the cycling period is mention that the low density in space and time of the Argo
usually reduced to 5 d, and the maximum profiling depth profiles induces uncertainties in the results, especially during
is mostly 700 or 2000 m (Poulain et al., 2007). The floats the first years of the analysed period.
are equipped with Sea-Bird conductivity–temperature–depth
2.2 Methods
(CTD) sensors (model SBE41CP; https://www.seabird.
com/sbe-41-argo-ctd/product-details?id=54627907875, last As discussed in the introduction, many indicators and char-
access: December 2021) with accuracies of ±0.002 ◦ C, acteristics have been adopted in literature to track AW and
±0.002, and ±2 dbar for temperature, salinity, and pres- LIW in the Mediterranean Sea. Most of them consider the
sure, respectively. The data measured by the profilers are minimum and maximum salinity at surface and intermedi-
transmitted to satellites (e.g. via the Iridium or Argos ate layer for AW and LIW, respectively, as the best indicator,
telemetry systems) and then to ground receiving stations, and this motivated us to follow a similar approach (e.g. Mil-
processed and real-time quality-controlled by the Argo Data lot and Taupier-Letage, 2005; Bergamasco and Malanotte-
Assembly Centres (https://www.euro-argo.eu/Activities/ Rizzoli, 2010; Hayes et al., 2019; Lamer et al., 2019).
Data-Management/Euro-Argo-Data-Centres, last access: A preliminary step in this analysis was the post-
December 2021), and sent to the Global Data Assembly processing: we first applied a time sub-sampling on each pro-
Centre where they are made available for free to users (https: filer to obtain a more homogeneous dataset (Notarstefano and
//fleetmonitoring.euro-argo.eu/dashboard?Status=Active, Poulain, 2009). This is applied to each float as follows: if the
last access: December 2021). The delayed-mode quality cycling period is 1 d or less, the profiles are sub-sampled ev-
control applied on pressure, temperature, and salinity follows ery 5 d; if the period is 2 or 3 d, they are sub-sampled every
the guidelines described in the Argo Quality Control Manual 6 d; and if the period is 5 or 10 d, no subsampling is applied.
for CTD (e.g. Wong et al., 2021; Cabanes et al., 2016), in Afterward, each profile was linearly interpolated from the
conjunction with other procedures developed at regional surface (0 m) to the bottom every 10 m to obtain comparable
level (Notarstefano and Poulain, 2008, 2013), to check profiles. Following this, a running filter with a 20 m window
the salinity data and any potential drift of the conductivity was applied to the data along the depth axis to smooth any
sensor. residual spike.
https://doi.org/10.5194/os-18-129-2022 Ocean Sci., 18, 129–142, 2022
132                                 G. Fedele et al.: Characterization of Atlantic Water and Levantine Intermediate Water

Figure 1. Scatter plot of Argo float profiles in the Mediterranean Sea between 2001 and 2019 in eight regions based on the climatological
areas defined by the EU/MEDARMEDATLAS II project. Basemap credits are attributed to RJGC, Esri, HERE, Garmin, USGS.

    The minimum and maximum salinity value in each profile             the estimation of the trends. The latter have been computed
is then associated with the AW and LIW core in the respec-             using the linear least-squares method to fit a linear regression
tive depth layer. Following this, the correspondent depth and          model to the data.
temperature values are considered.
    Once the AW and LIW core are identified in each profile,
the AW and LIW inter-basin variabilities were analysed by              3     Results and discussion
taking advantage of the boxplot approach applied to each pa-
                                                                       In this section, the AW and LIW properties are investigated
rameter and region (Fig. 2). In Fig. 2, the whiskers (dashed
                                                                       in the eight Mediterranean climatic regions mentioned above,
black line outside of the box) extend to the most extreme
                                                                       focusing on both their spatial and temporal variability. The
data points not considering the outliers at the 5 % signifi-
                                                                       analysis of the trends and spectral features are also shown.
cance level (p value ≤ 0.05). In order to test the significance,
Student’s t distribution was applied to each hydrological pa-          3.1     Inter-basin variability
rameter in every sub-basin (Pearson, 1895). The null hypoth-
esis (that states that the population is normally distributed)         3.1.1    AW
is rejected with a 5 % level of statistical significance. This
method is also applied to the time series trends. In Sect. 3.1         The hydrological properties of the AW core in eight sub-
we often refer to the range and skewness of the distributions,         basins (Fig. 1) are shown in Fig. 2a, b, and c, providing a
which are the difference between the upper and lower limits            compact view of the AW inter-basin variability for each pa-
and the measure of the symmetry of the distributions, respec-          rameter using the boxplot approach.
tively (including only the 5 % significance values).                      Moving eastward, the AW salinity increases from ∼ 36 to
    Considering only the AW and LIW salinity, temperature,             39.5 (minimum and maximum whiskers limits; Fig. 2a) since
and depth values at a 95 % level of significance (Fig. 2), as          the surface salinity minimum is progressively smoothed by
has been done for the spatial analysis, the time series from           horizontal mixing with surrounding saltier waters. In fact, as
2001 to 2019 have been computed in each sub-basin to anal-             discussed by Font et al. (1998), the AW minimum salinity
yse the low-frequency variability (LFV) and trends at inter-           is dependent on the different degrees of mixing due to its
annual to decadal timescale over the available observed pe-            residence times.
riods. In this respect, the high-frequency variability was fil-           In the Algerian sub-basin, the salinity range reaches the
tered out, first by subtracting the mean seasonal cycle to the         highest extension compared to the other regions, probably
raw time series and then by applying a median yearly average           due to the large baroclinic instability that produces high
filter. This last step is needed since the data are not homo-          mesoscale variability in the surface layer and horizontal mix-
geneous in time in every sub-basin from 2001 to 2019, and              ing by strong eddies (Demirov and Pinardi, 2007).
therefore without it the seasonal variability can contaminate

Ocean Sci., 18, 129–142, 2022                                                               https://doi.org/10.5194/os-18-129-2022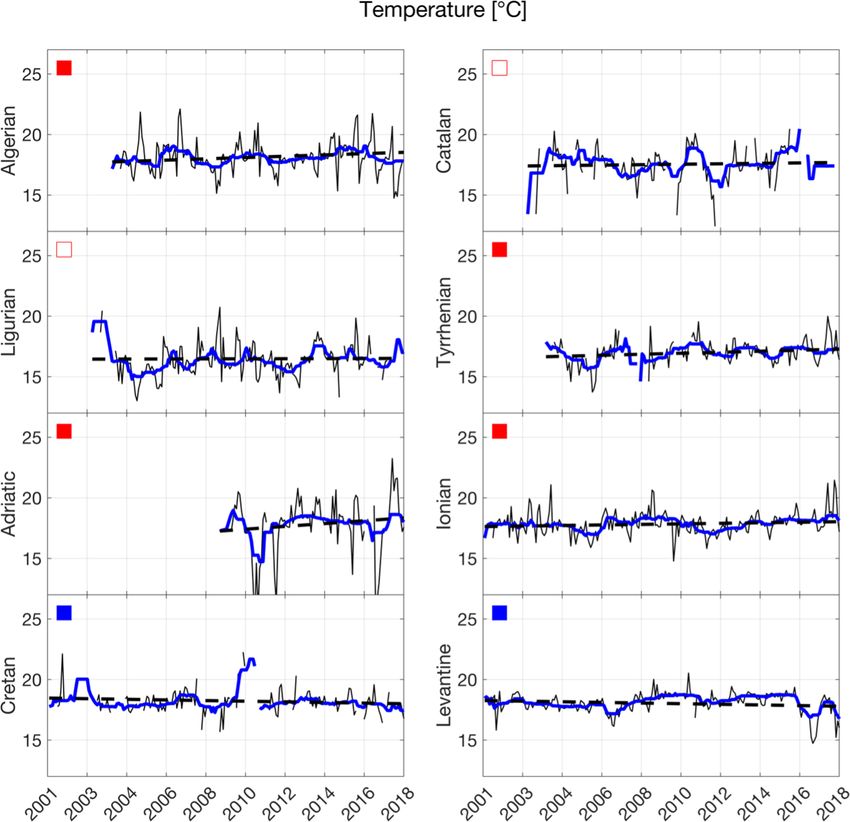
G. Fedele et al.: Characterization of Atlantic Water and Levantine Intermediate Water                                                   133

Figure 2. Boxplot diagrams for the AW salinity (a), temperature (b), and depth (c) in eight Mediterranean sub-basins. Inside each grey box,
the bold black line indicates the median, while the bottom and top edges of the box indicate the 25th and 75th percentiles, respectively, and
the black dots show the mode of each distribution, which corresponds to the maximum PDF. The number of profiles (black bars) for each
sub-basin is shown in (d). The corresponding diagrams for LIW are shown in (e), (f), (g), and (h).

   The AW salinity range is smaller in the Catalan, Ligurian,            for the AW distribution in the Adriatic Sea is the large river
and Tyrrhenian seas, where similar distributions are found               runoff observed in 2014 by Kokkini et al. (2019) that caused
both in terms of range and skewness (which is close to zero):            a saline stratification for more than a year. This episode is
the main mode and the median have salinity of ∼ 38. In                   also captured by our analyses (Fig. 3). As observed for the
the Adriatic Sea the distribution is probably skewed toward              AW salinity mode, even the temperature mode shifts toward
higher values because a clear positive salinity trend is found           higher values moving eastward, in agreement with the lit-
(Fig. 3; Lipizer et al., 2014). In the Adriatic, Ionian, and Cre-        erature (Bergamasco and Malanotte-Rizzoli, 2010). In the
tan seas, the range is higher than the surrounding sub-basins:           Algerian basin, the AW temperature mode is higher than it
in the Adriatic and Ionian seas this could be associated with            is in the Catalan sub-basin: this could be due to the influ-
the Bimodal Oscillation System (BiOS) and the reversal of                ence of freshwater fluxes in the Catalan region and led by the
the North Ionian Gyre (Rubino et al., 2020), while in the Cre-           high eddy activity over the Algerian region (Escudier et al.,
tan Sea we speculate that it is caused by the sinking of AW              2016), which is in turn led by the strong baroclinic instabil-
during winter. This is in agreement with Schroeder (2019),               ity already discussed for the salinity field (e.g. Demirov and
where it is shown that the strong wind-induced evaporation               Pinardi, 2007; Cotroneo et al., 2016; Aulicino et al., 2018,
and heat loss during winter in the Cretan Sea led the AW                 2019). The temperature and salinity ranges captured in the
transformation into salty and warm Cretan Intermediate Wa-               Algerian region are in good agreement with those found by
ter. The depths reached in the Cretan basin (Fig. 2c) seem to            Cotroneo et al. (2019) and shown in their Table 2.
confirm this hypothesis.                                                    The depths of the AW core oscillate between 0 and 90 m,
   The AW temperature is highly variable, ranging between                with the main mode sinking eastward (Fig. 2c). The distribu-
∼ 5 and ∼ 30 ◦ C, with a wider range in the Catalan and                  tions are all skewed toward lower depths, with the maximum
Adriatic regions (Fig. 2b) that is possibly due to the higher            probability density function (PDF) near the surface and a me-
seasonal sea surface temperature variability over these sub-             dian shifting from 0 to 45 m moving eastward, indicating a
basins (Shaltout and Omstedt, 2014). The lowest tempera-                 clear sinking of the AW along its pathway.
tures detected can be related to the freshwater fluxes in these
regions. In this respect, an episode that could be relevant

https://doi.org/10.5194/os-18-129-2022                                                                    Ocean Sci., 18, 129–142, 2022
134 G. Fedele et al.: Characterization of Atlantic Water and Levantine Intermediate Water
most of the Mediterranean Sea, except for the Adriatic Sea,
where a strong LIW bimodality in the depth domain is found,
with two peaks located at ∼ 190 and ∼ 500 m (here not
shown), in agreement with Kokkini et al. (2019) and Mi-
hanović et al. (2021). In this respect, Mihanović et al. (2021),
analysing observed data from CTD measurements, Argo
floats, several glider missions, satellite observations, and op-
erational ocean numerical model products, provide a possible
explanation for this double-maxima vertical pattern, suggest-
ing that these two peaks may be explained by two concurrent
events: the winter convection at the beginning of 2017, which
leads higher salinities in the water column, and a very strong
inflow of high-salinity waters from the North Ionian Gyre in
late winter and spring of 2017, which this time is almost re-
stricted to the surface.
3.2 Inter-annual variability
In this section, the temporal variability of the AW and LIW
in each sub-basin is studied analysing the 1-year moving av-
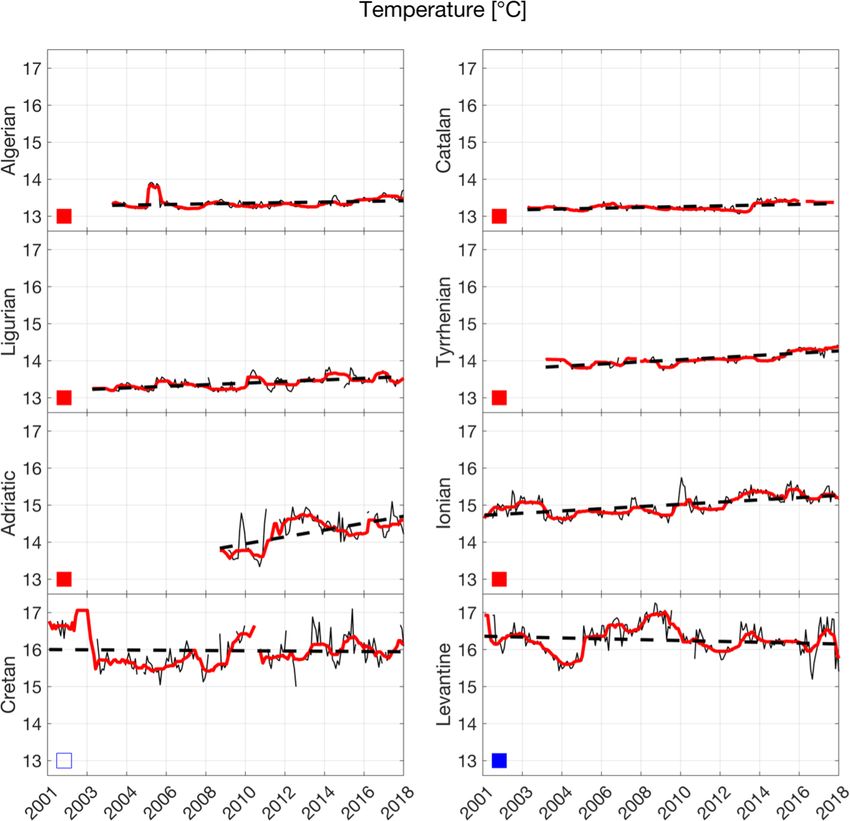
Figure 3. AW salinity time series in eight sub-basins: the thin black erage time series and the relative trends.
lines show the monthly time series (seasonal cycle filtered out), the The results of this analysis are affected by the irregular
thick blue lines are the 1-year moving average time series, and the spatial and temporal sampling of the Argo floats. Time gaps
dashed black lines are the trends. The filled red and blue squares in the data are found in the Catalan, Tyrrhenian, and Cre-
identify the positive and negative trends with p value ≤ 0.05, re- tan seas (Fig. 3). The missing data are due to the lack of
spectively, while the unfilled red and blue squares identify the posi- Argo float samplings. Data in the Adriatic Sea are available
tive and negative trends with p value > 0.05, respectively.
only after 2009, while the Ionian, Cretan, and Levantine sub-
basins have much longer time series, with data covering the
period from 2001 to 2019.
3.1.2 LIW
3.3 Trends
In this section, the main hydrological properties of LIW are
analysed in each sub-basin. 3.3.1 AW
Flowing away from the region of formation, LIW inter-
acts with the surrounding water masses and becomes less The AW salinity temporal evolution is shown in Fig. 3,
salty; the salinity sharply drops from ∼ 39.2 to ∼ 38.5, mov- where significant trends (at 5 % level of significance) are
ing from the Levantine to the Ligurian sub-basin, and then it found in each region (Table 1). Positive trends are clearly
becomes more stable in the Algerian and Catalan regions, os- found in the EMED and in the Tyrrhenian Sea, highlighting
cillating around ∼ 38.5 (Fig. 2e). The distributions are highly a clear salinification of the AW in the last 2 decades over
symmetric around the median, and the variability decreases most of the Mediterranean Sea (∼ 0.007 ± 0.140 yr−1 ; Ta-
flowing westward, possibly because LIW becomes deeper, ble 1). Comparable positive salinity trends between 0–150 m
sinking from ∼ 100 to ∼ 650 m (Fig. 2g). The highest salin- (∼ 0.009 ± 0.009 yr−1 ) are also found in Skliris et al. (2018),
ity is reached in the Cretan basin, where the formation of where multi-decadal salinity changes in the Mediterranean
salty and warm Cretan Intermediate Water, caused by strong Sea are investigated taking advantage of the MEDATLAS
wind-induced evaporation and heat loss during winter, influ- database (MEDAR Group, 2002), which consists of temper-
ences the LIW properties and detection (Schroeder, 2019). ature and salinity profiles in the Mediterranean from 1945 to
The LIW temperature decreases westward from ∼ 18 to 2002 (https://www.bodc.ac.uk/resources/inventories/edmed/
∼ 12.8 ◦ C. The range is higher in the EMED, as also found report/4651/, last access: December 2021). A clear merid-
for salinity, suggesting that over this region the intrusion ional separation is found in the AW trends during the ob-
of warmer and saltier surface waters due to convective pro- served period. In the Tyrrhenian Sea and in the entire EMED
cesses characterizes the LIW formation (Fig. 2f; Schroeder, the AW becomes saltier, with significant positive trends,
2019). whilst in the WMED a significant negative trend emerges in
The sinking of the LIW flowing westward is shown in the Algerian and Catalan sub-basins (Table 1). This fresh-
Fig. 2g, dropping from about 100 to 650 m (maximum ening of the AW inflow could be related to the observed
whisker values). The distributions tend to be symmetric in rapid freshening of the North Atlantic Ocean (Dickson et al.,
Ocean Sci., 18, 129–142, 2022 https://doi.org/10.5194/os-18-129-2022
G. Fedele et al.: Characterization of Atlantic Water and Levantine Intermediate Water 135
2002), the causes of which are related to different phenom-
Table 1. Trends by year for the AW and LIW salinity, temperature, and depth time series in eight Mediterranean sub-basins. The trends that are significant at a 5 % level are shown in
bold. The rightmost column shows the mean and standard deviation trend values computed over the eight sub-basins (here identified with MED). Trends are defined as mean ± standard
ena, including the accelerating Greenland melting triggered
MED
0.007 ± 0.140
0.006 ± 0.038
0.026 ± 0.715
0.022 ± 0.232
0.238 ± 10.537
1.099 ± 46.458
by the global warming (Dukhovskoy et al., 2019). These
findings seem in contradiction with the results provided by
Millot (2007), which show a salinification of the Mediter-
ranean outflow and were obtained by analysing autonomous
CTD measurements on the Moroccan shelf in the Strait of
Levantine
0.003 ± 0.100
0.004 ± 0.039
0.026 ± 0.683
0.012 ± 0.391
1.087 ± 17.024
0.849 ± 32.912
Gibraltar in the period 2003–2007; this contradiction may be
caused by the different epochs under study. In fact, compar-
ing Fig. 3 in Millot (2007) and Fig. 3 in this work, a sim-
ilar positive trend is captured in the Algerian sub-basin in
the same period, but when extending the analysis to a longer
Cretan
0.013 ± 0.166
0.005 ± 0.048
−0.026 ± 0.786
−0.003 ± 0.226
0.116 ± 17.480
−1.630 ± 26.943
time series, a clear negative trend leads the AW variabil-
ity at inter-annual to decadal timescales. Opposite trends are
found in the EMED and in the Tyrrhenian sub-basin, where
the very strong increase in net evaporation of ∼ 8 % to 12 %
over 1950–2010 (Skiliris et al., 2018) and the damming of
the Nile River (as projected by Nof, 1979) may have caused
Ionian
0.009 ± 0.181
0.004 ± 0.031
0.023 ± 0.395
0.030 ± 0.226
−0.324 ± 7.352
−4.973 ± 42.536
the AW salinification. The trends are steep in the Adriatic
and Cretan sub-basins, where the salinity increases by an or-
der of magnitude (O[10−2 ]), and the largest increase is found
in the Adriatic Sea (0.044 ± 0.188 yr−1 ). Here the impact of
the negative E–P anomalies and large river runoff observed
by Kokkini et al. (2019) around 2014 is well captured by the
Adriatic
0.044 ± 0.188
0.021 ± 0.074
0.117 ± 0.951
0.093 ± 0.384
0.757 ± 25.800
2.609 ± 115.404
salinity time series. The results in the EMED are in good
agreement with Fig. 9 of Kassis and Korres (2020), where
the yearly average salinity per depth zone and per region
between 2004–2017 are shown. Similarities in the observed
trend in the Ionian Sea (0.009±0.181 yr−1 ) are also found by
Zu et al. (2014) (mean trend ∼ 0.011 yr−1 ), where the Argo
Tyrrhenian
0.006 ± 0.157
0.006 ± 0.035
0.042 ± 0.528
0.030 ± 0.167
0.394 ± 4.002
−7.034 ± 46.395
float data between 2004 and 2014 are analysed.
According to the above-mentioned meridional salinity
transition from negative to positive salinity trends moving
eastward, the temperatures also show a meridional shift from
positive to negative significant trends east of the Ionian Sea,
with a mean positive AW temperature trend over the eight
Ligurian
−0.001 ± 0.089
0.005 ± 0.034
0.004 ± 0.914
0.022 ± 0.138
−0.012 ± 5.720
−0.155 ± 40.249
analysed sub-basins (0.026 ± 0.715 ◦ C yr−1 ; Table 1; Fig. 4).
Inter-basin changes between the sub-basins are instead linked
to changes in the large-scale meteorological forcing of the
Mediterranean region (Painter and Tsimplis, 2003). As found
for the salinity field, the sharper increase is related to
the Adriatic Sea (∼ 0.117 ± 0.951 ◦ C yr−1 ), highlighting the
Catalan
−0.004 ± 0.088
0.002 ± 0.017
0.019 ± 0.846
0.010 ± 0.088
−0.019 ± 4.646
1.895 ± 52.582
presence of mechanisms that enhance the trends over this re-
gion. A sharpening in the trend over the last decade is cap-
tured in the Catalan sub-basin (Fig. 7) and confirmed by
Schuckmann et al. (2019), who observed the same behaviour
in the northwestern Mediterranean with a trend over the last
decade (∼ 0.047 ◦ C yr−1 ) that doubles the respective trend in
Algerian
−0.014 ± 0.151
0.002 ± 0.022
0.054 ± 0.614
0.008 ± 0.125
−0.092 ± 2.271
−0.352 ± 14.639
Temperature [◦ C yr−1 ]
the previous 1982–2011 period (0.029 ◦ C yr−1 ).
The AW depth time series (Fig. 5) show a heterogeneous
Depth [m yr−1 ]
trend in the Mediterranean Sea, with significant negative val-
Salinity [yr−1 ]
ues (the depth decreases) in the Algerian and Ionian sub-
basins and positive values in the Tyrrhenian and Levantine
deviation.
regions (Table 1), which reflects into a tendency of the AW to
LIW
LIW
LIW
AW
AW
AW
become shallower, increasing the stratification at basin scale
https://doi.org/10.5194/os-18-129-2022 Ocean Sci., 18, 129–142, 2022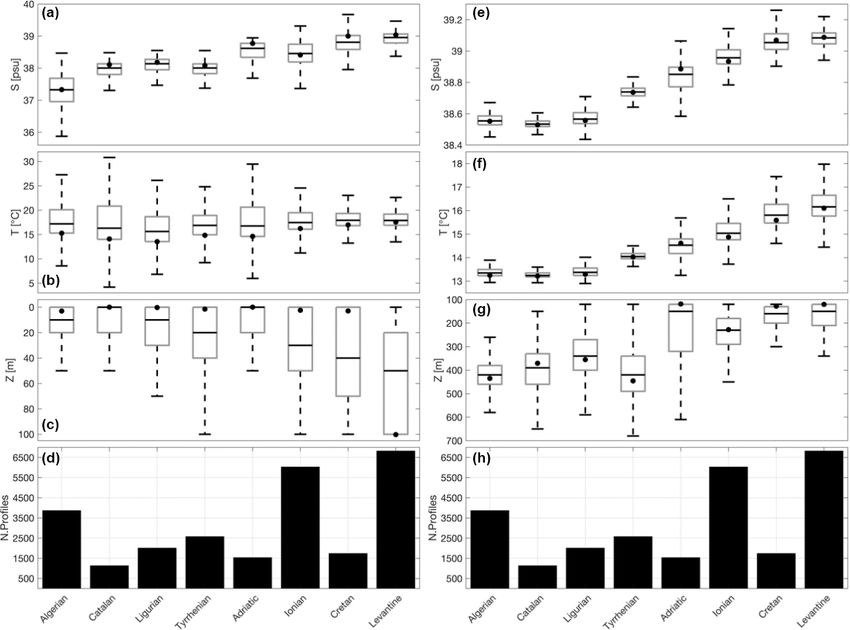
136                                G. Fedele et al.: Characterization of Atlantic Water and Levantine Intermediate Water

(0.238 ± 10.537 m yr−1 ). Wider temporal changes are found
in the Levantine region, where the trend is 1 to 2 orders of
magnitude higher than the other regions.

3.3.2   LIW

The LIW temporal variability will now be analysed. Figure 6
shows the salinity changes from 2001 to 2019 in the eight
sub-basins considered. A positive trend is found in the whole
Mediterranean Sea at a 5 % level of significance, highlight-
ing an additional salinification at intermediate depths of this
enclosed basin over 2 decades (∼ 0.006 ± 0.038 yr−1 ; Ta-
ble 1). A similar positive trend between 150–600 m is found
by Skliris et al. (2018) in the MEDATLAS data from 1950 to
2002 (∼ 0.007 ± 0.004 yr−1 ) with lower standard deviations.
The higher standard deviations found in this study compared
to those founds by Skliris et al. (2018) could be related to the
wider range of depths considered and the different epochs
considered. The LIW properties vary less than those of AW
in most of the basin, except for the Ligurian and Levantine
regions, where deep water and LIW water formations occur,
respectively. The strongest salinity increase is found in the
Adriatic Sea (0.021 ± 0.074 yr−1 ), exceeding the trends in
                                                                   Figure 4. The same as Fig. 3 but for the AW temperature.
other regions by an order of magnitude. The Adriatic salin-
ity trend from 2008 to 2018 is about 5 times larger than the
Adriatic salinity trend observed in the period 1952–2010 and
quantified by Vilibić et al. (2013). The possible source of
such a large trend may be due to the biassing of the signal by
the BiOS oscillations since the series starts in 2008 when the
anticyclonic BiOS was present. Here, the periodicity of the
BiOS has a magnitude that is comparable to the time series
length in the Adriatic, which might be also relevant for other
sub-regions. Therefore, the longest time series are needed to
better estimate the trend over this sub-basin.
   The positive LIW salinity trends over the Mediterranean
Sea are also found by Zu et al. (2014), which confirms the
salinification of the basin at intermediate depths, as also
observed at surface in most of the analysed regions. This
suggests that the enhancement of the net evaporation over
the Mediterranean in the last decades that was observed by
Skiliris et al. (2018), may lead the formation of saltier LIW
in the EMED and, as a consequence, a mean positive salinity
trend over the whole basin. In contrast, in the WMED posi-
tive trends (0.008 ± 0.002; 0.009 ± 0.0007 yr−1 ; from gliders
missions) are found from 2011 to 2017 by Juza et al. (2019),
in agreement with the positive trends found in the last few
years in the western sub-basins shown in Fig. 6.
   Positive temperature trends (5 % level of significance) are
found in the whole Mediterranean Sea, except in the Levan-
tine sub-basin, where the negative trend could be related to       Figure 5. The same as Fig. 3 but for the AW depth. Positive and neg-
oscillations with decadal timescales that take place over this     ative trends (red and blue squares, respectively) in this case corre-
region. This is confirmed by the continuous wavelet trans-         spond to an increase or decrease in depth (i.e. deeper or shallower),
forms applied to the time series (not shown). Peaks of salin-      respectively.
ity and temperature are observed in ∼ 2009 in the Levantine
basin and then reach the Cretan Sea in ∼ 2010. The same

Ocean Sci., 18, 129–142, 2022                                                            https://doi.org/10.5194/os-18-129-2022
G. Fedele et al.: Characterization of Atlantic Water and Levantine Intermediate Water 137
the intermediate layers to the warming trend observed at sur-
face.
The sub-basins with the steepest increase are located in
the central longitudinal band of the Mediterranean Sea and
are therefore far from the LIW main sources. The range of
temperature and salinity and the respective variability in the
Tyrrhenian and Ionian sub-basins are in good agreement with
Poulain et al. (2009), where T and S time series from 2001
to 2009 are computed from Argo floats data near 600 m. The
ranges and trends for T and S found in the Ligurian Sea
are also confirmed by Margirier et al. (2020), where verti-
cal profiles collected by gliders, Argo floats, CTD sensors,
and XBTs in the northwestern Mediterranean Sea over the
2007–2017 period are analysed.
The LIW depth time series are shown in Fig. 8: sig-
nificant negative trends (the depth decreases) are found
in the Tyrrhenian, Ionian, and Cretan seas, while in
the Catalan and Levantine sub-basins the LIW sinks
(p value ≤ 0.05). Non-significant trends are found in the
other regions. Abrupt shifts are found in the Adriatic sub-
Figure 6. The same as Fig. 3 but for the LIW salinity. basin from ∼ 200 to ∼ 500–600 m at different time steps
(trend ∼ 2.609 ± 115.404 m yr−1 ), highlighting a bimodal
behaviour of the LIW depth and an intense dense water pro-
duction activity as also shown by Kokkini et al. (2019) and
Mihanović et al. (2021). Previous studies attribute dramatic
shifts in the Adriatic hydrological properties to the BiOS
and the Eastern Mediterranean Transient (e.g. Vilibić et al.,
2012). This hypothesis can also be supported by correlations
between the BiOS (definition by Vilibić et al., 2020) and the
AW and LIW yearly averaged salinity time series in the Adri-
atic Sea, which have maximum values that are about −0.49
and −0.43 at a lag of 0 −4 years (at negative year lag, the
BiOS leads; p value ≤ 0.05), respectively. Further investiga-
tions are left to future studies.
The results related to the EMED match those shown in
Kassis and Korres (2020), where the time series of salin-
ity and temperature averaged between different depth layers
(below 100 m) in similar sub-basins are shown (see Fig. 8
in Kassis and Korres, 2020). The LIW depth mean trend
and standard deviation averaged over the eight sub-basins is
1.099 ± 46.458 m yr−1 (Table 1).
Figure 7. The same as Fig. 3 but for the LIW temperature.
4 Conclusions
variability is discussed in Ozer et al. (2017) and explained We presented an analysis of the main properties and variabil-
in connection with the Ionian Bimodal Oscillating System ity of the AW and LIW in the Mediterranean Sea, exploit-
(BiOS). These maxima are in fact attributed to periods of ing the Argo float data that provide an optimal observational
anticyclonic circulation in the northern Ionian Sea (2006– dataset to study their thermohaline properties. Indeed, this
2009) and limited AW advection in the southeastern Lev- dataset covers the water column down to ∼ 2000 m and pro-
antine basin, referring to the study by Artale et al. (2006). vides data for almost 2 decades.
The LIW temperature mean trend and standard deviation av- Taking advantage of different diagnostics discussed in
eraged over the eight sub-basins is ∼ 0.002 ± 0.232 ◦ C yr−1 Sect. 2, AW and LIW have been detected in the Mediter-
(Table 1), which can be interpreted as a weaker response of ranean Sea through a sub-basin approach, which allowed
https://doi.org/10.5194/os-18-129-2022 Ocean Sci., 18, 129–142, 2022138 G. Fedele et al.: Characterization of Atlantic Water and Levantine Intermediate Water
with previous results (e.g. Skliris et al., 2018; Margirier
et al., 2020; Kassis and Korres, 2020).
– Negative AW salinity trends in the Algerian and Cata-
lan sub-basins suggest a freshening of the AW inflow,
in agreement with the observed rapid freshening of the
North Atlantic Ocean (Dickson et al., 2002).
– Positive AW salinity trends are found east of the Lig-
urian sub-basin, highlighting a clear salinification of
this water mass in the last 2 decades that is probably due
to the combined effect of the strong increase in net evap-
oration and the damming of the Nile (e.g. Nof, 1979;
Skiliris et al., 2018; Sect. 3.3.1).
– Positive trends in the LIW salinity time series are found
in the whole Mediterranean Sea at a 5 % level of sig-
nificance, highlighting that salinification also exists at
intermediate depths (Sect. 3.3.2).
– Positive LIW temperature trends (p value ≤ 0.05) are
found everywhere except in the Levantine sub-basin,
Figure 8. The same as Fig. 3 but for the LIW depth. Positive and
negative trends (red and blue squares, respectively) in this case cor-
where the negative trend might be related to oscillations
respond to an increase and decrease of the depth (i.e. deeper or shal- with decadal timescales that play a role in this region.
lower), respectively. These results highlight a clear warming at intermediate
depths in most of the Mediterranean Sea.
– The AW and LIW depth trends are highly space de-
to define the main hydrological features over this enclosed pendent, showing different behaviours in the eight sub-
basin in different regions. basins.
In addition to previous studies, this work provides a more
detailed view of the AW and LIW characteristics in the last 2 – Abrupt shifts in the LIW depth are found in the Adriatic
decades over most of the Mediterranean Sea, except for the sub-basin from ∼ 200 to ∼ 500–600 m at different time
Alboran sub-basin, the Sicily Channel, and the Aegean sub- steps (trend 2.609 ± 115.404 m yr−1 ), highlighting a bi-
basin where Argo data are too scarce. modal behaviour of the LIW depth and an intense dense
To achieve this goal, the first step of this study was the water production activity, as also shown by Kokkini et
detection of the AW and LIW cores in each available pro- al. (2019) and Mihanović et al. (2021).
file. In agreement with previous studies (e.g. Lascaratos et
al., 1993; Bergamasco and Malanotte-Rizzoli, 2010; Millot, – The time series length could affect the measurement of
2013; Hayes et al., 2019; Vargas-Yáñez et al., 2020), we the trends in the sub-basins that are affected by peri-
confirmed the mean zonal gradients of the AW and LIW odicity forcings with the same order of magnitude. In
properties over the Mediterranean Sea: AW becomes saltier, this respect, the trends observed in the Adriatic Sea are
warmer, and deeper moving eastward, while LIW becomes clearly impacted by the BiOS since the time series starts
fresher, colder, and deeper moving westward. These results in 2008 when the anticyclonic BiOS was present. This
not only match the present literature but also provide a more might be also relevant for other sub-regions.
detailed view of these water masses over eight sub-basins.
These results therefore provide interesting new insights about
The time series derived from the AW and LIW parame-
the AW and LIW inter-basin and inter-annual variability that
ters have also highlighted some interesting features that are
can be further analysed to investigate which mechanisms led
in good agreement with the previous literature. The most rel-
to the observed temporal trends in each sub-basin.
evant results are summarized below.
– Positive salinity and temperature trends character-
Code availability. The analyses are performed with the MAT-
ize AW and LIW in the last 2 decades over most LAB programming and numeric computing platform, devel-
of the Mediterranean Sea (average values over the oped by MathWorks (https://ch.mathworks.com/products/matlab.
whole region of 0.007 and 0.006 yr−1 and 0.026 and html, MathWorks, 2007). The codes have been implemented di-
0.022 ◦ C yr−1 respectively). The warming and salinifi- rectly by the first author, and thus they are not available to other
cation of the Mediterranean Sea is in good agreement users.
Ocean Sci., 18, 129–142, 2022 https://doi.org/10.5194/os-18-129-2022G. Fedele et al.: Characterization of Atlantic Water and Levantine Intermediate Water 139
Data availability. Data used in this paper are freely available from Aulicino, G., Cotroneo, Y., Ruiz, S., Sánchez Román, A.,
the International Argo Program and the national programs that Pascual, A., Fusco, G., Tintoré, J., and Budillon, G.:
contribute to it (https://argo.ucsd.edu, https://www.ocean-ops.org; Monitoring the Algerian Basin through glider observa-
https://archimer.ifremer.fr/doc/00652/76377/, Wong et al., 2020). tions, satellite altimetry and numerical simulations along
a SARAL/AltiKa track, J. Marine Syst., 179, 55–71,
https://doi.org/10.1016/j.jmarsys.2017.11.006, 2018.
Author contributions. Conceptualization of the study was done by Aulicino, G., Cotroneo, Y., Olmedo, E., Cesarano, C., Fusco, G.,
GF and PMP. GF prepared the original manuscript. GF, EM, GN, and Budillon, G.: In Situ and Satellite Sea Surface Salinity in
and PMP reviewed and edited the manuscript. GF, EM, GN, and the Algerian Basin Observed through ABACUS Glider Measure-
PMP created the methodology. GF created the codes. GF performed ments and BEC SMOS Regional Products, Remote Sens.-Basel,
the validation. GF performed the formal analysis. GF, EM, GN, and 11, 1361, https://doi.org/10.3390/rs11111361, 2019.
PMP conducted the investigation. GF and GN curated the data. EM, Azzaro, M., La Ferla, R., Maimone, G., Monticelli, L. S., Zaccone,
GN, and PMP provided supervision. EM was responsible for project R., and Civitarese, G.: Prokaryotic dynamics and heterotrophic
administration. EM was responsible for funding acquisition. All au- metabolism in a deep convection site of Eastern Mediterranean
thors have read and agreed to the published version of the paper. Sea (the Southern Adriatic Pit), Cont. Shelf Res., 44, 106–118,
https://doi.org/10.1016/j.csr.2011.07.011, 2012.
Bensi, M., Cardin, V., Rubino, A., Notarstefano, G., and Poulain, P.
Competing interests. The contact author has declared that neither M.: Effects of winter convection on the deep layer of the South-
they nor their co-authors have any competing interests. ern Adriatic Sea in 2012, J. Geophys. Res.-Oceans, 118, 6064–
6075, https://doi.org/10.1002/2013JC009432, 2013.
Bergamasco, A. and Malanotte-Rizzoli, P.: The circulation of the
Mediterranean Sea: A historical review of experimental investi-
Disclaimer. Publisher’s note: Copernicus Publications remains
gations, Advances in Oceanography and Limnology, 1, 11–28,
neutral with regard to jurisdictional claims in published maps and
https://doi.org/10.1080/19475721.2010.491656, 2010.
institutional affiliations.
Borghini, M., Bryden, H., Schroeder, K., Sparnocchia, S., and Ve-
trano, A.: The Mediterranean is becoming saltier, Ocean Sci., 10,
693–700, https://doi.org/10.5194/os-10-693-2014, 2014.
Special issue statement. This article is part of the special issue “Ad- Bosse, A., Testor, P., Mortier, L., Prieur, L., Taillandier,
vances in interdisciplinary studies at multiple scales in the Mediter- V., d’Ortenzio, F., and Coppola, L.: Spreading of Lev-
ranean Sea”. It is a result of the 8th MONGOOS Meeting & Work- antine Intermediate Waters by submesoscale coherent vor-
shop, Trieste, Italy, 3–5 December 2019. tices in the northwestern Mediterranean Sea as observed
with gliders, J. Geophys. Res.-Oceans, 120, 1599–1622,
https://doi.org/10.1002/2014JC010263, 2015.
Acknowledgements. This research was funded by the Italian Min- Bethoux, J. P., Gentili, B., Raunet, J., and Taillez, D.: Warming
istry of University and Research as part of the ARGO-ITALY pro- trend in the Western Mediterranean deep water, Nature, 347,
gram. 660–662, https://doi.org/10.1038/347660a0, 1990.
Bethoux, J. P., Gentili, B., Morin, P., Nicolas, E., Pierre, C., and
Ruiz-Pino, D.: The Mediterranean Sea: A miniature ocean for
Financial support. This research has been supported by the Min- climatic and environmental studies and a key for the climatic
istero dell’Istruzione, dell’Università e della Ricerca (MOCCA functioning of the North Atlantic, Prog. Oceanogr., 44, 131–146,
project, grant no. EASME/EMFF/2015/1.2.1.1/SI2.70962). https://doi.org/10.1016/S0079-6611(99)00023-3, 1999.
Cabanes, C., Thierry, V., and Lagadec, C.: Improvement of bias
detection in Argo float conductivity sensors and its applica-
Review statement. This paper was edited by Alejandro Orfila and tion in the North Atlantic, Deep-Sea Res. Pt. I, 114, 128–136,
reviewed by three anonymous referees. https://doi.org/10.1016/j.dsr.2016.05.007, 2016.
Cotroneo, Y., Aulicino, G., Ruiz, S., Pascual, A., Budillon, G.,
Fusco, G., and Tintoré, J.: Glider and satellite high resolution
monitoring of a mesoscale eddy in the algerian basin: Effects on
the mixed layer depth and biochemistry, J. Marine Syst., 162,
References 73–88, https://doi.org/10.1016/j.jmarsys.2015.12.004, 2016.
Cotroneo, Y., Aulicino, G., Ruiz, S., Sánchez Román, A., Torner
Argo: Argo float data and metadata from Global Data As- Tomàs, M., Pascual, A., Fusco, G., Heslop, E., Tintoré, J., and
sembly Centre (Argo GDAC), SEANOE [data set], Budillon, G.: Glider data collected during the Algerian Basin Cir-
https://doi.org/10.17882/42182, 2020. culation Unmanned Survey, Earth Syst. Sci. Data, 11, 147–161,
Artale, V., Calmante, S., Malanotte-Rizzoli, P., Pisacane, G., https://doi.org/10.5194/essd-11-147-2019, 2019.
Rupolo, V., and Tsimplis, M.: The Atlantic and Mediterranean Demirov, E. K. and Pinardi, N.: On the relationship between
Sea as connected systems, in: Mediterranean Climate Variabil- the water mass pathways and eddy variability in the West-
ity Dev. Earth Environ. Sci., edited by: Lionello, P., Malanotte- ern Mediterranean Sea, J. Geophys. Res., 112, C02024,
Rizzoli, P., and Boscoli, R., Vol. 4, Elsevier, Amsterdam, 283– https://doi.org/10.1029/2005JC003174, 2007.
323, 2006.
https://doi.org/10.5194/os-18-129-2022 Ocean Sci., 18, 129–142, 2022140 G. Fedele et al.: Characterization of Atlantic Water and Levantine Intermediate Water Dickson, B., Yashayaev, I., Meincke, J., Turrell, B., Dye, S., termediate water, J. Geophys. Res., 98, 14739–14749, and Holfort, J.: Rapid freshening of the deep North Atlantic https://doi.org/10.1029/93JC00912, 1993. Ocean over the past four decades, Nature, 416, 832–837, Lipizer, M., Partescano, E., Rabitti, A., Giorgetti, A., and Crise, https://doi.org/10.1038/416832a, 2002. A.: Qualified temperature, salinity and dissolved oxygen clima- Dukhovskoy, D. S., Yashayaev, I., Proshutinsky, A., Bam- tologies in a changing Adriatic Sea, Ocean Sci., 10, 771–797, ber, J. L., Bashmachnikov, I. L., Chassignet, E. P., Lee, https://doi.org/10.5194/os-10-771-2014, 2014. C. M., and Tedstone, A. J.: Role of Greenland fresh- Margirier, F., Testor, P., Heslop, E., Mallil, K., Bosse, A., Houpert, water anomaly in the recent freshening of the subpolar L., Mortier, L., Bouin, M.-N., Coppola, L., D’Ortenzio, F., de North Atlantic, J. Geophys. Res.-Oceans, 124, 3333–3360, Madron, X. D., Mourre, B., Prieur, L., Raimbault, P., and Tail- https://doi.org/10.1029/2018JC014686, 2019. landier, V.: Abrupt warming and salinification of intermedi- Escudier, R., Mourre, B., Juza, M., and Tintoré, J.: Subsurface cir- ate waters interplays with decline of deep convection in the culation and mesoscale variability in the Algerian subbasin from Northwestern Mediterranean Sea, Sci. Rep.-UK, 10, 20923, altimeter-derived eddy trajectories, J. Geophys. Res.-Oceans, https://doi.org/10.1038/s41598-020-77859-5, 2020. 121, 6310–6322, https://doi.org/10.1002/2016JC011760, 2016. Mauri, E., Sitz, L., Gerin, R., Poulain, P. M., Hayes, D., Font, J., Millot, C., Pérez, J. D. J. S., Julià, A., and Chic, and Gildor, H.: On the Variability of the Circulation O.: The drift of Modified Atlantic Water from the Alboran and Water Mass Properties in the Eastern Levantine Sea Sea to the eastern Mediterranean, Sci. Mar., 62, 211–216, between September 2016–August 2017, Water, 11, 1741, https://doi.org/10.3989/scimar.1998.62n3211, 1998. https://doi.org/10.3390/w11091741, 2019. Giorgi, F.: Climate change hot-spots, Geophys. Res. Lett., 33, Mauri, E., Menna, M., Notarstefano, G., Gerin, R., Martellucci, R., L08707, https://doi.org/10.1029/2006GL025734, 2006. and Poulain, P.-M.: Recent changes of the salinity distribution in Hayes, D. R., Schroeder, K., Poulain, P. M., Testor, P., Mortier, the South Adriatic, EGU General Assembly 2020, Online, 4–8 L., Bosse, A., and Du Madron, X.: Review of the Circulation May 2020, EGU2020-9874, https://doi.org/10.5194/egusphere- and Characteristics of Intermediate Water Masses of the Mediter- egu2020-9874, 2020. ranean: Implications for Cold-Water Coral Habitats, in: Mediter- MEDAR Group: MEDATLAS/2002 database, Mediterranean and ranean Cold-Water Corals: Past, Present and Future, edited by: Black Sea database of temperature salinity and bio-chemical pa- Orejas, C. and Jiménez, C., Coral Reefs of the World, Vol. 9, rameters, Climatological Atlas, Institut Français de Recherche Springer, Cham, https://doi.org/10.1007/978-3-319-91608-8_18, pour L’Exploitation de la Mer, (IFREMER) Edition & Instituto 2019. Nazionale di Oceanografia e di Geofisica Sperimentale (OGS), Hernández-Molina, F., Stow, D., Zarikian, C., Acton, G., Bahr, A., 2002. Balestra, B., Ducassou, E., Flood, R., Flores, J. A., Furota, S., Mihanović, H., Vilibić, I., Šepić, J., Matić, F., Ljubešić, Z., Mauri, Grunert, P., Hodell, D., Jiménez-Espejo, F., Kim, J. K., Krissek, E., Gerin, R., Notarstefano, G., and Poulain, P.-M.: Obser- L., Kuroda, J., Li, B., Llave, E., Lofi, J., and Xuan, C.: Onset vation, preconditioning and recurrence of exceptionally high of Mediterranean outflow into the North Atlantic, Science, 344, salinities in the Adriatic Sea, Front. Mar. Sci., 8, 672210, 1244–1250, https://doi.org/10.1126/science.1251306, 2014. https://doi.org/10.3389/fmars.2021.672210, 2021. Juza, M., Escudier, R., Vargas-Yáñez, M., Mourre, B., Heslop, Millot, C.: Interannual salinification of the Mediter- E., Allen, J., and Tintoré, J.: Characterization of changes in ranean inflow, Geophys. Res. Lett., 34, L21609, Western Intermediate water properties enabled by an innovative https://doi.org/10.1029/2007GL031179, 2007. geometry-based detection approach, J. Marine Syst., 191, 1–12, Millot, C.: Levantine Intermediate Water characteristics: https://doi.org/10.1016/j.jmarsys.2018.11.003, 2019. An astounding general misunderstanding, Sci. Mar., 78, Kassis, D. and Korres, G.: Hydrography of the Eastern Mediter- https://doi.org/10.3989/scimar.04045.30H, 2013. ranean basin derived from argo floats profile data, Deep-Sea Res. Millot, C.: Levantine intermediate water characteristics: an astound- Pt. II, 171, 104712, https://doi.org/10.1016/j.dsr2.2019.104712, ing general misunderstanding! (addendum), Sci. Mar., 78, 165– 2020. 171, https://doi.org/10.3989/scimar.04045.30H, 2014. Kokkini, Z., Mauri, M., Gerin, R., Poulain, P. M., Simon- Millot, C. and Taupier-Letage, I.: Circulation in the Mediterranean celli, S., and Notarstefano, G.: On the salinity structure in Sea, in: The Mediterranean Sea. Handbook of Environmental the South Adriatic as derived from float and glider obser- Chemistry, edited by: Saliot, A., Vol. 5K, Springer, Berlin, Hei- vations in 2013–2016, Deep-Sea Res. Pt. II, 171, 104625, delberg, https://doi.org/10.1007/b107143, 2005. https://doi.org/10.1016/j.dsr2.2019.07.013, 2019. Millot, C., Candela, J., Fuda, J. L., and Tber, Y.: Large warm- Kubin, E., Poulain, P.-M., Mauri, E., Menna, M., and Notarstefano, ing and salinification of the Mediterranean outflow due to G.: Levantine Intermediate and Levantine Deep Water Forma- changes in its composition, Deep-Sea Res., 53, 656–665, tion: An Argo Float Study from 2001 to 2017, Water, 11, 1781, https://doi.org/10.1016/j.dsr.2005.12.017, 2006. https://doi.org/10.3390/w11091781, 2019. Nof, D.: On man-induced variations in the circulation of the Lamer, P. A., Mauri, E., Notarstefano, G., and Poulain, P. M.: The Mediterranean Sea, Tellus, 31, 558–564, 1979. Levantine Intermediate Water in the eastern Mediterranean Sea, Notarstefano, G. and Poulain, P. M.: Delayed mode qual- available at: http://maos.inogs.it/pub/REPORT_LAMER_final_ ity control of Argo floats salinity data in the Tyrrhenian last.pdf (last access: December 2021), 2019. Sea, Technical Report OGS 2008/125 OGA 43 SIRE, avail- Lascaratos, A., Williams, R. G., and Tragou, E.: A able at: http://nettuno.ogs.trieste.it/sire/DMQC/dmqc_1900593_ mixed-layer study of the formation of Levantine in- 54073_V1.pdf (last access: December 2021), 2008. Ocean Sci., 18, 129–142, 2022 https://doi.org/10.5194/os-18-129-2022
You can also read


