Hydrogeology and groundwater management in a coastal granitic area with steep slopes in Galicia (Spain)
←
→
Page content transcription
If your browser does not render page correctly, please read the page content below
Hydrogeology Journal
https://doi.org/10.1007/s10040-021-02349-5

    REPORT

Hydrogeology and groundwater management in a coastal granitic
area with steep slopes in Galicia (Spain)
Acacia Naves 1 & Javier Samper 1 & Bruno Pisani 1 & Alba Mon 1 & Jorge Dafonte 2 & Luis Montenegro 1 &
Aitor García-Tomillo 3

Received: 17 August 2020 / Accepted: 4 April 2021
# The Author(s) 2021

Abstract
Groundwater availability, management and protection are great challenges for the sustainability of groundwater resources in the
scattered rural areas of the Atlantic regions of Europe where groundwater is the only option for water supply. This report presents
a hydrogeological study of the coastal granitic area of Oia in northwestern Spain, which has unique geomorphological and
hydrogeological features with steep slopes favoring the erosion of the weathered granite. The hydrogeological conceptual model
of the study area includes: (1) the regolith layer, which is present only in the flat summit of the mountains; (2) the slope debris and
the colluvial deposits, which are present in the intermediate and lowest parts of the hillside; (3) the marine terrace; and (4) the
underlying fractured granite. Groundwater recharge from rainfall infiltration varies spatially due to variations in terrain slope,
geology and land use. The mean annual recharge estimated with a hydrological water balance model ranges from 75 mm in the
steepest zone to 135 mm in the lowest flat areas. Groundwater flows mostly through the regolith and the detrital formations,
which have the largest hydraulic conductivities. Groundwater discharges in seepage areas, springs, along the main creeks and into
the sea. The conceptual hydrogeological model has been implemented in a groundwater flow model, which later has been used to
select the best pumping scenario. Model results show that the future water needs for domestic and tourist water supply can be
safely provided with eight pumping wells with a maximum pumping rate of 700 m3/day.

Keywords Igneous rocks . Numerical modelling . Groundwater recharge/water budget . Spain . Water supply

Introduction                                                           surface (Detay et al. 1989). Their geometry, hydraulic conduc-
                                                                       tivity and storativity depend mainly on the weathering of the
Well failure and low well yields (˂20 m3/day) are common in            parent rock and stripping (colluvial and fluvial erosion; Taylor
hard rocks aquifers (Taylor and Howard 2000; Courtois et al.           and Howard 2000; Wyns et al. 2004). A typical weathering
2009). However, these types of aquifers are well suited for the        profile includes two main stratiform layers subparallel to the
water supply of scattered populations where total demand is low        paleo-surface contemporaneous of the weathering processes
in comparison to more populous areas. Groundwater resources            having specific hydrodynamic properties (Chilton and Smith-
are commonly found in the first tens of meters below the ground        Carington 1984; Chilton and Foster 1995; Wyns et al. 1999,
                                                                       2004; Krásný 2002; Maréchal et al. 2004, 2006; Lubczynski
                                                                       and Gurwin 2005; Dewandel et al. 2006; Krásný and Sharp
* Javier Samper                                                        2007). From top to bottom, the weathering profile includes: (1)
  j.samper@udc.es                                                      the unconsolidated weathered layer derived from in situ decom-
                                                                       position of bedrock, which is commonly known as regolith,
1
     Universidade da Coruña, Centro de Investigaciones Científicas     saprolite or alterite, which may have a thickness of a few tens
     Avanzadas (CICA), ETS Ingenieros de Caminos, Canales y Puertos,   of meters, (Mc Farlane 1991; Nahon and Tardy 1992; Thomas
     Universidade da Coruña, A Coruña, Spain
                                                                       1994; Taylor and Howard 1998), and (2) the fractured rock layer
2
     Universidade de Santiago de Compostela, Escuela Politécnica       characterized by a dense network of horizontal fractures in the
     Superior de Ingeniería, Lugo, Spain
                                                                       first few meters and a depth-decreasing density of subhorizontal
3
     Universidade da Coruña, Centro de Investigaciones Científicas     and subvertical fractures (Houston and Lewis 1988; Howard
     Avanzadas (CICA), Facultad de Ciencias, Universidade da Coruña,
     A Coruña, Spain
                                                                       et al. 1992; Cho et al. 2003; Maréchal et al. 2004, 2006; Wyns
Hydrogeol J
et al. 2004; Dewandel et al. 2006, 2012). The underlying media model, the unconsolidated weathering layer is represented
unfractured and fresh rock is only locally permeable in fracture by a porous medium. The continuum approach to the fractured
zones. These conductive fracture zones are much less dense than rock layer is much more complex due to the heterogeneity, dis-
in the fractured rock layer and their hydrodynamic properties are continuity and anisotropy of the fracture network. Data from
highly variable (Pickens et al. 1987; Walker et al. 2001; Cho wells next to each other may show differences of several orders
et al. 2003). of magnitude in the hydraulic conductivity of the fractured layer
The development of a weathering profile requires significant (Krásný 1997; Dewandel et al. 2006). The simplification of this
rainfall to ensure mineral hydrolysis and high mean temperatures layer to an equivalent porous media requires assuming relatively
to favor the kinetics of weathering (Acworth 1987; Wyns et al. well-connected fractures and upscaling hydraulic parameters to
2003; Oliva et al. 2003). Its development requires long periods regional scale. The fresh basement can be disregarded for
under stable tectonic conditions; thus, relatively flat topographic groundwater resources management.
areas are required to avoid erosion of weathering products and to Water supply in the scattered rural areas of the Atlantic
favor water infiltration (Dewandel et al. 2006). Deep layers of regions of Europe such as Galicia (Spain) relies on groundwa-
weathered crystalline rock are common features of landscapes ter catchments and wells. The construction of large centralized
across equatorial Africa, South America and Asia. In Europe, infrastructures in these areas requires large investments and
stable tectonic conditions of Carboniferous, infra Permian and maintenance costs. Groundwater supply in rural communities
infra Triassic in the Primary era, the Early Cretaceous and the is a paramount challenge for the implementation of the
early and middle Eocene lasted enough for the formation of thick European water protection and management regulations
(20–30 m) weathering profiles (Wyns et al. 2003). They usually (Directive 2000/60/EC) and the quality of water for human
have a high porosity and a low permeability and, when saturated, consumption (Directive 98/83/EC).
constitute most of the storage capacity of the aquifer. The weath- Oia is a rural coastal area of Galicia (Spain) located in a
ered layer, however, cannot develop in regions of sharp topog- granitic mountain range. Groundwater is used for water supply
raphy where the erosion rate is higher than the rate of weathering by private spring catchments at the summit of the mountains,
(Dewandel et al. 2006). The weathered layer is thin and bedrock domestic wells and municipal wells. Several alternatives were
outcrops occur due to stripping. A sharp topography also entails explored to overcome the water shortages and address the fu-
a low ratio of annual recharge to runoff component, which, to- ture demand of a planned residential and hotel complex in the
gether with a small thickness of the regolith layer, results in a Cistercian Royal Monastery of Santa María de Oia. There are
reduction of the water resources buffering and the discharge as no surface-water sources with significant flowrates. The tech-
highly variable flowrate streams (Taylor and Howard 2000). nical and economic feasibility of connecting this area to cen-
Groundwater flow in hard rocks is controlled by the con- tralized infrastructures in the neighbor areas is severely limited
nectivity of the fracture network which depends on the distri- by the distance to highly populated areas (Eyser 2012a).
bution of fracture lengths, orientations and density (Bour and The evaluation of the feasibility and sustainability of the future
Davy 1998). Fracturing may be caused by cooling stress in the municipal groundwater supply system of Oia has been addressed
magma and subsequent tectonic activity (Houston and Lewis with a study of the hydrogeology and groundwater management.
1988), lithostatic decompression processes (Davis and Turk The study included: (1) the integration of available geological
1964; Acworth 1987; Wrigth 1992) and from the weathering and hydrogeological data into a hydrogeological conceptual
process itself (Lachassagne et al. 2001; Cho et al. 2003; Wyns model of the study area; (2) the quantification of groundwater
et al. 2004). The presence of horizontal and sub-vertical frac- recharge with a hydrological water balance model; and (3) the
ture sets ensures a good connectivity between fractures and an evaluation of several pumping scenarios with a groundwater flow
overall anisotropy of the hydraulic conductivity. The fracture numerical model. The report starts with a description of the study
hydraulic connectivity decreases with depth and the limited area. Then, the geology and the hydrogeology of the area are
extension of the deeper flowing fractures can lead to a lateral presented, after which the groundwater use and the groundwater
compartmentalization of the aquifer when the groundwater resources evaluation with a hydrological water balance model are
level decreases significantly (Guihéneuf et al. 2014). described afterwards. Then, the conceptual and numerical flow
Rushton and Weller (1985) and Maréchal et al. (2004) esti- models are presented, and finally, the evaluation of several sce-
mated an anisotropy ratio near 10 (Khoriz ˃ Kvert). narios of expansion of the municipal groundwater supply system
The proposed conceptualizations of groundwater flow in hard is presented. The report ends with the main conclusions.
rocks include (Selroos et al. 2002): double porosity models
(Barenblatt et al. 1960), discrete fracture models (Lee and
Farmer 1993; Long et al. 1982; Dong et al. 2019), parallel plate Study area
models (Bear 1993; Lee and Farmer 1993) and equivalent porous
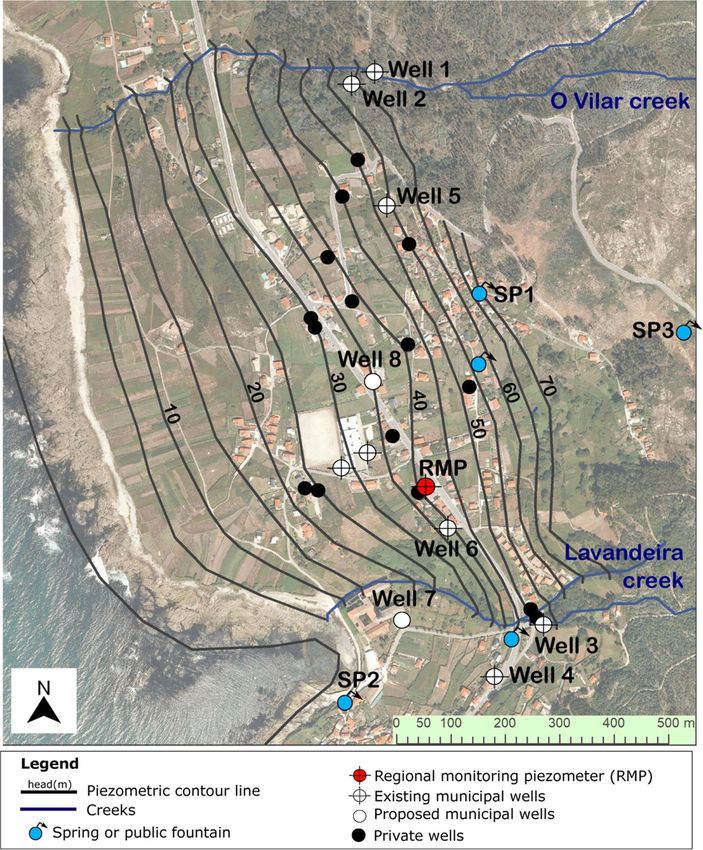
media models (Lubczynski and Gurwin 2005; Courtois et al. The study area is located in Oia on the north Atlantic coast
2010; Dewandel et al. 2006, 2012). In an equivalent porous of Spain near the border with Portugal, between the Vigo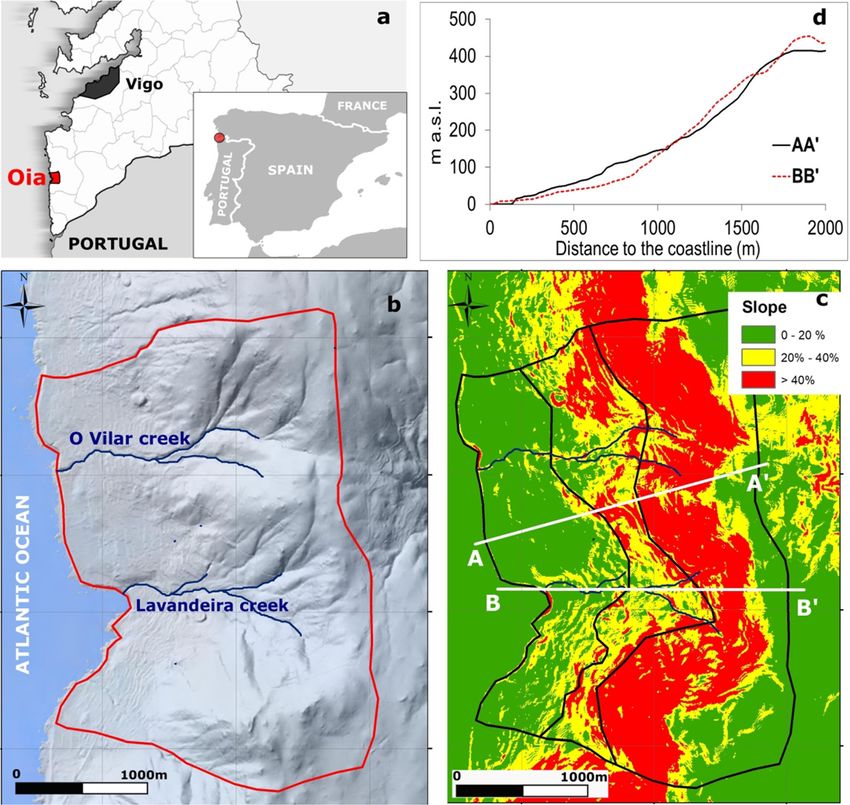
Hydrogeol J

Bay and the mouth of the Miño River (Fig. 1). This region                       The climate in the study area is wet oceanic with relatively
covers a narrow straight coastal strip of N–S direction and                  abundant rainfall. According to the Köppen classification, the
a mountain range parallel to the coastline. That coastal                     climate is type Csb with mild temperatures and dry and warm
mountain range functioned as an orographic barrier, pro-                     summers (Kottek et al. 2006; Peel et al. 2007). Most of the
viding suitable conditions for fluvio-nival and periglacial                  rainfall occurs from October to May. The mean annual tem-
slope processes when the sea level was lower than today, in                  perature and precipitation in the period 2004–2017 are equal
the middle and late Weichselian (Blanco-Chao et al. 2003,                    to 13.1 °C and 1,149 mm respectively.
2007). The study area covers a surface of 84 km2. It limits                     Oia municipality is a rural area with scattered low-
to the west with the Atlantic Ocean and to the east with the                 density population. Land use is strongly linked to the to-
water divide along the mountain range (Fig. 1). The area                     pography. Fractured granites outcrop in areas with steep
presents steep slopes with elevations ranging from sea lev-                  slopes which are covered with pine and eucalyptus forests.
el to about 590 m above sea level (asl) at ~2 km from the                    Most of the population is settled in the intermediate zone,
shore. O Vilar and Lavandeira creeks are the most impor-                     which presents moderate slopes. Natural pastures and cul-
tant water channels of the drainage network, and run nearly                  tivated areas cover most of the lowest zones where the
perpendicular to the shoreline.                                              slopes are nearly flat.

Fig. 1 Location, relief and slope map of the study area: a Location map of   which the domain is divided in the hydrometeorological model are dis-
Oia in Galicia (Spain); b Relief map in which the study area is bounded      tinguished (black lines) and d Topographic cross sections perpendicular
by the red line and the location of O Vilar and Lavandeira creeks is also    to the coast which location is shown in the slope map
shown (blue lines); c Slope map in which the three homogenous zones in

Hydrogeol J
Geology electrode spacing and a spread length of 200 m (see Fig. 3 for
location of the ERT line). The apparent resistivity data were
The study area is occupied by two-mica granites formed in the inverted with the RES2DINV software (GeoTomo software)
Hercynian orogenesis. These only leave some small enclaves to generate a 2D image of the modelled resistivity along the
of metasedimentary rocks, which show a high degree of as- profile. Topography effects were removed during the interpre-
similation with the granites and belong to the graywacke tation of the resistivity field by using the method of Lu et al.
schists of the lowest levels of the Ordes Complex (Pliego (2015) to avoid misleading ERT anomalies (Fox et al. 1980).
and Corretge 1978; Pliego et al. 1978; Abril and Corretge The topography along the profile was obtained from LIDAR
1978a, b). The highest area is formed by less weathered gra- data. The resistivity model obtained from the inversion of the
nitic rocks (Fig. 2). The summits of the mountain range are apparent resistivity data shows a large interval of resistivities,
rounded and form a flat area with a weathered granite layer. A which range from 100 to 30,000 Ω-m. Resistivities show large
few faults of limited extent have been mapped in the study horizontal and vertical heterogeneities (Fig. 3). The resistivity
area which are located near O Vilar Creek and run parallel to field allows the identification of the contact of the slope debris
the coastline. and the fractured granite as well as the interface of the collu-
The metamorphic rocks together with weak terrigenous vial deposits and fractured granite. The approximate thickness
deposits and alteration soils form a narrow terrace along the of the slope debris in this area is equal to 15 m. A remarkable
coastline, which is characterized by the absence of beaches heterogeneity in resistivities is detected between wells 1 and 2.
and the outcrop of granites. The terrace progressively loses
height towards the north. The terrace consists of 5–6-m-thick
deposits of brownish silts over which a level of thick boulders Hydrogeology
(up to 20–25 cm in diameter) is superimposed. A boulder
beach covers the rearmost 20–75-m-wide shore platform Piezometric data
(Pérez-Alberti and Trenhaile 2014). Posthercinic colluvial de-
posits and slope debris are found downhill, and are formed by Hydraulic head and water quality data were collected at do-
sands, silts and granite ridges, coming from the granite degra- mestic dug wells and boreholes, municipal wells 1–6 (Fig. 4),
dation, with a chaotic structure and generally with a low de- a regional monitoring piezometer (RMP) of the Galicia-Costa
gree of compaction. hydrological district, spring catchments and public groundwa-
An electric resistivity tomography (ERT) campaign was ter fountains. Most of the springs are located in the highest
performed at O Vilar Creek near wells 1 and 2. The two- zone along the contact between the flat mountain summit, in
dimensional (2D) resistivity tomography was obtained by which rocks are covered by a significant layer of regolith, and
using the ABEM Lund Imaging system. A multielectrode the steepest slope hillside where fractured rocks outcrop. A
dipole-dipole configuration was used to collect the resistivity few springs are scattered in the intermediate and the lowest
data along a profile with a total of 40 electrodes with 5 m of zones of the study area (Fig. 4). Available hydraulic head data
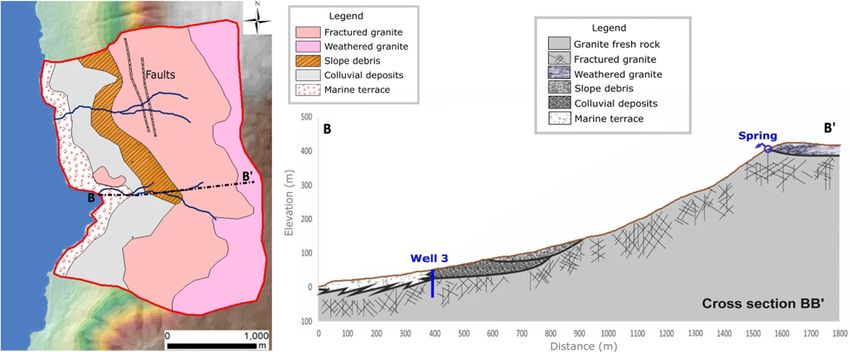
Fig. 2 Geological map of the study area and vertical cross-section along Lavandeira Creek (BB′) illustrating the hydrogeological conceptual model. The
profile extends from the coast to the summit of the mountain range and its location is shown in the geological map
Hydrogeol J

Fig. 3 Vertical cross-section along O Vilar Creek illustrating the         inversion of the 2D tomographic data (bottom), including the location
hydrogeological conceptual model (top), with location shown in the geo-    of the wells (red lines) and the measured groundwater levels in the wells
logical map, and vertical profile of the resistivities obtained from the   (white symbols)

show that the water table is generally shallow, with a depth               was drilled on slope debris which overly the fractured
less than 10 m in most of the study area. Head data recorded at            granite. A well yield of about 1.5 L/s was recorded with
the RPM from 2011 to 2014 show that: (1) the water table                   a drawdown of 1 m when the depth to the water table was
rises in response to rainfall events, and (2) the seasonal oscil-
Hydrogeol J

Fig. 4 Piezometric map in a strip
of the study area by the coast
between O Vilar and Lavandeira
creeks. Piezometric head of
contour lines is expressed in
meters (m). The locations of the
piezometer of the regional
monitoring network (RMP), the
existing and proposed municipal
wells, the inventoried private
wells and the springs and
fountains in the area are indicated
with different symbols. Water
samples for physico-chemical and
microbiological analyses were
taken in wells 1–4 and springs
SP1, SP2 and SP3. Notice that the
location of the spring SP3 is re-
lated to the sampling point in a
private small supply network but
sampled water comes from sev-
eral springs located near the sum-
mit of the mountains

fractured granite ranges from 0.6 to 1.4 m2/day. Well 4 is                     The results of the pumping tests show that the maximum
60 m deep and about 100 m away from Lavandeira Creek                         pumping rate in well 1 near O Vilar Creek is equal to 200 m3/
(Fig. 2). The estimated yield of well 4 was about 1 L/s for                  day, except during the dry season (July–September) when the
a drawdown of 32 m.                                                          maximum rate is 40 m3/day. The pumping rates in wells 3 and

a                                                              b

Fig. 5 a Scattergram of the computed and the measured steady-state heads in the observation wells in which dashed lines represent an error of ±5 m. b
Time evolution of the computed transient head (line) and measured (symbols) at the regional monitoring piezometer (RMP)

Hydrogeol J

4 near Lavandeira Creek are estimated to be equal to 150 and     heavy metals (As, Cd, Cu, Zn, Cr, Sn, Sr, Hg, Ni, Pb and
90 m3/day, respectively.                                         Se) and microbiological presence.
                                                                    Table 1 shows the measured values of pH, EC, and the
                                                                 concentrations of the m ain ca tions and anions.
Lavandeira and O Vilar creeks
                                                                 Groundwater is slightly acidic, with a pH range between
                                                                 5.46 and 6.46. The electrical conductivity is low and
Weekly gauging campaigns were carried out in the
                                                                 ranges from 78 to 204 μs/cm. The most abundant
Lavandeira and O Vilar creeks from May to September of
                                                                 hydrochemical facies is sodium/chloride. The cation com-
2017. These data were supplemented with qualitative obser-
                                                                 position is similar in all samples while the differences
vations during several field campaigns. Lavandeira Creek
                                                                 occur in bicarbonate and sulphate.
maintains a permanent flow all year long, especially at its
                                                                    The measured concentrations of the cations and anions are
lowest stretch. Measured flow rates during the dry season
                                                                 below the parametric values for drinking water (RD 140/2003;
range from 0.1–4.5 L/s. This creek has springs throughout
                                                                 EC 2010). No significant nitrate contamination is observed.
its course. Water springing up on its banks was observed in
                                                                 Groundwaters in the study area show a slight bacteriological
a stretch ~100 m downstream from well 3 after several days
                                                                 contamination. This contamination is avoided by the chlori-
without rainfall. The water table near Lavandeira Creek is
                                                                 nation of the municipal supply system.
shallow (~3 m deep).
    Available data show that Lavandeira Creek is a discharge
zone, at least in the lower stretches when the water table is
high. On the other hand, the creek may act as a recharging       Groundwater uses and resources
zone when the water table drops, as attested by the stabilized
drawdowns recorded in pumping tests performed in wells 3         Groundwater uses
and 4 near the creek.
    Field data show that O Vilar Creek is a discharge zone       The current groundwater municipal use ranges from 25 to
in some stretches in winter when the water table is high.        30 m3/day. Private groundwater use from spring catch-
On the other hand, the creek was dry during 90% of the           ments and wells is estimated to be equal to 118 m3/day.
weekly gauging campaigns performed during the dry sea-           Private water consumption increases in the summer due to
son. According to communication with local residents, the        seasonal population, garden irrigation and use of swim-
current morphology of O Vilar Creek reflects the conse-          ming pools. Assuming a seasonal peak consumption factor
quences of the floods that occurred after a big fire in the      of 1.4, the peak groundwater consumption is ~200 m3/day.
summer of 2013. The bed of the creek was filled with large          The population of Oia has remained nearly constant during
boulders and pebbles dragged during floods. There might          the last 10 years. No significant increase in water demand is
probably be a subsurface flow that runs below the bed of         foreseen in the study area, except for the development of a
boulders even when the channel is dry on the surface. The        tourist center in the former Cistercian Royal Monastery of
available streamflow data from O Vilar Creek clearly un-         Santa María de Oia. According to the “Technical instructions
derestimates the actual discharge because: (1) the morphol-      for hydraulic works in Galicia” (Aguas de Galicia 2011), the
ogy of the creek does not allow an accurate gauging of the       water demand of the touristic complex will be ~500 m3/day;
creek; and (2) most of the discharge data were collected         thus, the expected total future demand in the study area is
during the dry season when the creek was dry.                    estimated to be ~700 m3/day.

Groundwater chemistry                                            Hydrological model

Available groundwater chemical and bacteriological data          Groundwater recharge comes from the infiltration of precipi-
include: (1) 20 water samples from the regional monitor-         tation throughout the study area. Its magnitude varies spatially
ing piezometer (RPM) from 2012 to 2015; (2) 3 water              and temporally, with the spatial variability depending mainly
samples from 2012 in springs SP1 and SP2 and in a tank           on the terrain slope, geology and land use.
of a private water supply system, where water from sev-              A hydrological water balance model was performed to
eral springs located at the highest area is stored; and (3) 4    evaluate the groundwater resources in the study area. The
samples collected in 2017 from wells 1–4. Figure 4 shows         hydrological model was carried out with VISUAL-BALAN,
the location of the sampling points. The following param-        a semidistributed hydrological code which solves daily the
eters were measured: temperature, pH, Eh, dissolved ox-          water balance in the soil, the unsaturated zone and the aquifer
ygen, electrical conductivity (EC), concentrations of ma-        (Samper et al. 1999, 2015a, b; Stigter et al. 2014; Pisani et al.
jor cations and anions, concentrations of Fe, Al, Mn and         2019).
Hydrogeol J

Table 1     Chemical data from groundwater samples taken in the study area. The location of the sampling points is shown in Fig. 4

Parameter       RMPa                 Well 1           Well 2             Well 3              Well 4       Spring 1          Spring 2   Spring 3
                                                                                                          (SP1)             (SP2)      (SP3)

pH at 20 °C     6.18                 5.46             5.81               6.37                6.46         5.76              6.09       6.25
EC at 20 °C     142                  78               87                 108                 204          143               184        95
  (μS/cm)
Chloride        27.6                 19.7             19.9               20.2                29.3         33.7              33.8       21.3
  (mg/L)
Sulphate        19.5                 3.2              4.7                4.3                 10.0         4.4               10.9       3.5
  (mg/L)
Bicarbonate     13.8                 17.1             12.2               20.3                43.6         9.0               6.3        7.5
  (mg/L)
Nitrate         4.9
Hydrogeol J
flow according to the available field data. Piezometric head
data show that groundwater flows from the highest parts of the
mountain range towards the coastline and towards Lavandeira
and O Vilar creeks. Both creeks are discharge zones when the
water table is shallow; on the other hand, the creeks become
losing creeks when the water table drops in the summer or due
to groundwater pumping. Water accumulates in the regolith
and flows through this layer towards the hillside, where frac-
tured granite outcrops (Fig. 2). Although most springs are
located along the contact of the regolith layer with the frac-
tured granite in the hillside, some springs are also found at
lower elevations in detrital formations near the outcrops of
granitic rocks.
The fractured granite is assumed to behave as an equivalent
porous medium. Groundwater flow is assumed to be 2D and
nearly parallel to the water table. Vertical groundwater flow is
disregarded. Most of the pumping and observation wells are
not affected by changes in water density; therefore, the spatial
variability of water density near the coast is disregarded.
Groundwater flow numerical model
A 2D groundwater flow numerical model was performed to
test the conceptual model with field data and evaluate the Fig. 6 Finite element mesh and hydraulic conductivity zones of the 2D
feasibility of expanding the municipal water supply system groundwater flow numerical model. Zones 1, 5, 7, 8 and 9 are related to
fractured granite, zone 6 to weathered granite, zone 2 to slope debris,
to provide the future water demands. The numerical model zones 3 and 10 to colluvial deposits, and zone 4 to the marine terrace
was calibrated by using the available piezometric data.
Afterwards, it was used to simulate pumping scenarios and based on the hydrogeological conceptual model (Fig. 6).
compute groundwater drawdowns and evaluate the potential The saturated thickness of the fractured granite, the regolith
for seawater intrusion. and the slope debris were estimated from geophysical surveys
The model domain was discretized with a finite element and published data. They are equal to 60, 25 and 15 m,
mesh of 2,426 nodes and 4,764 triangular elements (Fig. 6). respectively (see Table 2). The thickness of the colluvial de-
The mesh was refined along the creeks and near the pumping posits and the marine terrace was derived from groundwater
wells. The estimates of groundwater recharge rates in the three flow model calibration and was taken equal to 20 m (Table 2).
homogeneous zones considered in the hydrological water bal-
ance model were used as inputs to the groundwater flow mod-
el. The numerical model accounts for groundwater discharge
along the coast, along O Vilar and Lavandeira creeks, at the Table 2 Calibrated transmissivities (T), specific yield (Sy) and thickness
(b) of the parameter zones considered in the groundwater flow model.
springs located along the regolith/fractured granite contact at The geometry of the zones is shown in Fig. 6
the summit of the mountains and at the springs in detrital
formations near rock outcrops. The hydraulic head (h) is pre- Geological formation Zone number T (m2/day) Sy (−) b (m)
scribed and equal to 0 along the coast. Lavandeira and O Vilar
Fractured granite 1 0.35 0.009 60
creeks and the springs are simulated with a Cauchy boundary 5 0.25
condition according to which the nodal flux, Q (m3/day), is 7 0.55
equal to α·(hext – h), where α is a leakage coefficient (m2/day), 8 0.25
h is the hydraulic head and hext is an external head which is 9 0.9
taken equal to ground surface elevation. The leakage coeffi- Weathered granite 6 1.2 0.125 25
cients were taken equal to 100 m2/day to ensure that the com- Slope debris 2 1.4 0.112 15
puted hydraulic heads at the boundaries are equal to the hext.
Colluvial deposits 3 4.5 0.150 20
The rest of the model boundaries are water divides and are 10 5.1
assumed impervious. The model accounts for 10 hydraulic Marine terrace 4 4 0.150 20
conductivity and specific yield zones which were definedHydrogeol J
Fig. 7 Contour lines of the a computed steady-state hydraulic heads correspond to s = 0.1, 1 and 5 m, respectively. The maximum drawdowns
(lines every 10 m) and b computed drawdown (s) during the dry season in O Vilar and Lavandeira creeks are equal to 15.9 and 15.4 m,
for the maximum pumping rates in wells 1–8. White, black and red lines respectively
The groundwater flow numerical model was performed piezometric data recorded at the Oia RMP piezometer from
with CORE2D (Molinero et al. 2004; Samper et al. 2009, 2011 to 2014. The computed hydraulic heads match the mea-
2012; Lu et al. 2011; Águila et al. 2019; Naves et al. 2019). sured heads (Fig. 5). Model results validate the recharge rates
The model was calibrated in two stages. In the first stage, the estimated with the hydrological water balance model.
transmissivities were calibrated under steady-state conditions
by using prior information on transmissivities from pumping
tests and ensuring that the computed hydraulic heads match
the measured heads. The absolute value of the calibration head Table 3 Components of the steady-state groundwater balance in the
errors is smaller than 5 m (Fig. 5). The calculated Nash index domain of the groundwater flow model of the study area
is almost equal to 1. Figure 7 shows the contour map of the
Balance component Q (m3/day) Percentage
computed water table.
Table 3 presents the recharge and discharge components of Recharge 1,978 100%
the steady-state groundwater balance in the model domain. Highest zone 724 37%
Groundwater recharge in the model domain is equal to 1,978 Intermediate zone 852 43%
m3/day. Most of the groundwater discharges to the sea (72%), Lowest zone 402 20%
while 12% discharges in springs and 16% along the creeks. Discharge 1,913 100%
The computed discharge in Lavandeira Creek (174 m3/day) is Coast line 1,383 72%
within the range of the gauged values. The computed dis- Springs 229 12%
charge along O Vilar Creek is larger than the measured flow O Vilar Creek 127 7%
rates which underestimate the actual discharge. Lavandeira Creek 174 9%
In the second calibration stage, the storage coefficients Water balance error 3.2%
were calibrated under transient conditions by using theHydrogeol J
Table 4 Comparison of
calibrated values of the hydraulic Geological formation Calibrated K (m/day) Estimated K (m/day) in other granitic areas
conductivity (K) in the K (m/day) derived from tests
groundwater flow numerical
model of Oia with estimated K Fractured granite 0.004–0.015 NA 0.4–0.7 Taylor and Howard (2000)
from the interpretation of the 0.26 Houston and Lewis (1988)
hydraulic tests and estimated K 1.73 Maréchal et al. (2004, 2006)
values for other granitic
formations in the literature. NA 4.32 Rushton and Weller (1985)
not available Weathered granite 0.05 NA 0.008–2.6 Taylor and Howard (2000)
0.05–3.5 Houston and Lewis (1988)
0.006–0.86 Compaore et al. (1997)
0.35–0.5 Rushton and Weller (1985)
0.06–2.5 Dewandel et al. (2006)
Slope debris 0.09 ~0.06
Colluvial deposits 0.34 ~0.05
Marine terrace 0.20 NA
Table 2 lists the calibrated transmissivities and specific Evaluation of several scenarios of expansion
yields of the parameter zones. The calibrated hydraulic con- of municipal groundwater supply
ductivities (K) have been compared to the conductivities de-
rived from the interpretation of the pumping tests and the The water-table drawdowns and seawater intrusion were eval-
conductivities reported in the literature for granitic formations uated for two pumping scenarios with a 2D numerical ground-
(see Table 4). The calibrated conductivities for the fractured water flow model. Pumping scenarios include the combination
granite range from 4 · 10−3 to 1.5 · 10−2 m/day. These values of the existing wells (wells 1–6) and additional wells (wells 8
are lower than the values compiled from the literature. This and 9). Pumping rates vary seasonally. The pumping rate is
discrepancy of the Oia site might be explained by the erosion largest in the summer and smallest in the winter. Figure 8 shows
of the shallowest and most fractured granite, due to the steep- the dimensionless pumping rate function considered in the
ness of the hillside and its great exposure to rain and wind, pumping scenarios. The actual pumping rate is equal to the
resulting in a less thick and fractured granite. The calibrated product of the dimensionless pumping rate function times the
conductivity of the regolith (K) is equal to 0.05 m/day. The maximum pumping rate, Qmax. An acceptable scenario is one
calibrated K is within the range of published values (Table 4). which produces moderate drawdowns (Hydrogeol J
Table 5 Maximum and average pumping rates used in the numerical of the first scenario. The maximum pumping rates in wells 5
model
and 6 are equal to 35 m3/day, while those of wells 7 and 8 are
Well No. Qmax (m3/day) Average Q (m3/day) equal to 70 and 100 m3/day, respectively (Table 5).
Figure 7 shows the map of the computed drawdowns at the
1 25 15 end of the dry season for scenario 2. The maximum computed
2 25 15 drawdowns in wells 5, 6, 7 and 8 are equal to 14.1, 14.2, 7.4
3 250 148 and 13.4 m, respectively. Figure 9 shows the computed draw-
4 150 89 downs in wells 1–4. The total maximum pumping rate in
5 35 21 scenario 2 is about 690 m3/day during the dry season, while
6 35 21 the average pumping rate is about ~400 m3/day. Model results
7 70 41 of scenario 2 show no significant effects on existing wells.
8 100 59 The potential impact of pumping wells on seawater intrusion
was analyzed by computing the decrease of the discharge rate
of fresh groundwater into the sea along the coastal line com-
pared to the natural discharge rate. The total groundwater dis-
charge after 6 years of pumping decreases 7.5%. The maxi-
drawdowns are equal to 14.9 m near O Vilar Creek (wells 1 mum decrease is 18% at the mouth of Lavandeira Creek. This
and 2) and 15.6 m near Lavandeira Creek (wells 3 and 4). The small reduction in groundwater discharge is not expected to
total maximum pumping rate of the current municipal system lead to a significant advance of the saline wedge. It is con-
is 450 m3/day. Therefore, it can be concluded that the future cluded that no seawater intrusion is expected in scenario 2.
estimated demand (~700 m3/day) cannot be satisfied with the
current groundwater supply system and additional pumping
wells are required. Conclusions
Scenario 2 considers wells 1–4 and the following additional
four wells: (1) the existing municipal well 5 located south of O A hydrogeological study of a coastal granitic area having
Vilar Creek in the intermediate zone of the slope scree; (2) the unique geomorphological and hydrogeological features
existing municipal well 6 located north of Lavandeira Creek in with steep slopes favoring the erosion of the weathered
the colluvial deposits; (3) a proposed new well in the marine granite, has been presented. The steep slopes and the great
terrace near Lavandeira Creek (well 7); and (4) a proposed new exposure of the hills to rain and wind promote the erosion
well (well 8) located in the colluvial deposits near wells 5 and 6. of the weathered and altered granite. The regolith layer is
The maximum pumping rates of wells 1–4 are similar to those present only at the flat summit of the mountains and is not
formed on the hillside where the fractured granite is bare-
ly covered. The proposed hydrogeological conceptual
model of the study area includes: (1) the regolith, which
is present only in the flat summit of the mountains; (2) the
fractured granite which lies below the soil in the hillside;
(3) the slope debris and the colluvial deposits, which are
present in the intermediate and the lowest parts of the
hillside; and (4) the marine terrace. Water accumulates
in the regolith and flows through this layer, having a
hydraulic conductivity significantly larger than that of
fractured granite, towards the hillside. Most of the springs
are for domestic use and are found at the contact of the
regolith with the fractured rock along the hillside (Eyser
2012b). Slope debris and colluvial deposits are present in
the intermediate and lowest parts of the hill slope. The
regolith and the detrital layers exhibit a hydraulic conduc-
tivity larger than that of the fractured granite.
Groundwater resources in the study area have been evalu-
ated with a hydrological water balance model. Average aqui-
fer recharge ranges from 73 mm/year in the steepest zones to
Fig. 9 Time evolution of the computed drawdowns in a wells 1 and 2 and 135 mm/year in the lowest areas. Thus, average groundwater
b in wells 3 and 4 resources are equal to 2,000 m3/day, which are sufficient toHydrogeol J
supply the estimated current groundwater use (200 m3/day) References
and the foreseen future needs (700 m3/day).
The conceptual hydrogeological model has been implement- Abril J, Corretge LG (1978a) Geologic map of Spain (MAGNA), scale 1:
50.000, sheet 298: La Guardia. Instituto Geológico y Minero de
ed in a groundwater flow numerical model, which later has been
España (IGME), Madrid
used to evaluate the performance of two pumping scenarios and Abril J, Corretge LG (1978b) Geologic map of Spain (MAGNA), scale 1:
select the optimum solution to attain sustainable conditions. The 50.000, sheet 299: Tomiño. Instituto Geológico y Minero de España
results of the numerical groundwater flow model confirm the (IGME), Madrid
validity of the proposed conceptual hydrogeological model, Acworth RI (1987) The development of crystalline basement aquifers in a
tropical environment. Q J Eng Geol 20:265–272
which for the most part is consistent with the available geophys- Aguas de Galicia (2011) Instruccións Técnicas para Obras Hidráulicas en
ical, geological and pumping test data as well as with the con- Galicia, vol 1 [Technical instructions for hydraulic works in Galicia,
ceptual models reported in the literature. vol 1]. https://augasdegalicia.xunta.gal/c/document_library/get_
Model predictions show that the needs for domestic and file?folderId=216484&name=DLFE-17837.pdf. Accessed 8
March 2021
tourist water supply can be safely provided with groundwater
Águila JF, Samper J, Pisani B (2019) Parametric and numerical analysis
pumping wells with admissible drawdowns and no seawater of the estimation of groundwater recharge from water-table fluctua-
intrusion. Our study illustrates that the combination of a sound tions in heterogeneous unconfined aquifers. Hydrogeol J 27:1309–
conceptual hydrogeological model, a hydrological water bal- 1328. https://doi.org/10.1007/s10040-018-1908-x
ance model and a numerical groundwater flow model provides Barenblatt GI, Zheltov IP, Kochina IN (1960) Basic concepts in the
theory of seepage of homogeneous liquids in fissured rocks. Appl
a robust tool to evaluate the feasibility and sustainability of Math Mech 24 (5):852–864
groundwater supply systems. Bear J (1993) Modeling flow and contaminant transport in fractured
The results of our study could be improved by: (1) rocks. In: Bear J, Tsang C, de Marsily G (Eds.), Flow and
performing a more detailed piezometric and hydraulic charac- Contaminant Transport in Fractured Rocks. Academic Press, San
Diego, pp 1–36
terization of the study area with additional field tests, especial-
Blanco-Chao R, Costa Casais M, Martínez Cortizas A, Pérez Alberti A,
ly in the regolith, the fractured granites and the marine terrace; Trenhaile AS (2003) Evolution and inheritance of a rock coast:
and (2) collecting water samples directly in spring catchments western Galicia, northwestern Spain. Earth Surf Process Landf 28:
instead of water samples from water tanks. 757–775. https://doi.org/10.1002/esp.496
Blanco-Chao R, Pérez-Alberti A, Trenhaile AS, Costa-Casais M,
Valcárcel-Díaz M (2007) Shore platform abrasion in a para-
periglacial environment, Galicia, northwestern Spain.
Acknowledgements We acknowledge the support provided by Gonzalo Geomorphology 83(1–2):136–151. https://doi.org/10.1016/j.
Mosqueira and Belén Quinteiro from Aguas de Galicia (Xunta de Galicia) geomorph.2006.06.028
and Cristina Correa and Eugenio Portela from the Municipality of Oia.
Bour O, Davy P (1998) On the connectivity of three-dimensional fault
We also thank the fruitful collaboration and discussion with José Martins
networks. Water Resour Res 12:423–428. https://doi.org/10.1029/
Carvalho. We appreciate the comments, corrections and suggestions of
98WR01861
Jorge Jódar and the other reviewers, which contributed to improving the
Chilton PJ, Foster SSD (1995) Hydrogeological characteristics and
report.
water-supply potential of basement aquifers in tropical Africa.
Hydrogeol J 3:3–49. https://doi.org/10.1007/s100400050061
Funding This work has been funded by the Water Authority of the Chilton PJ, Smith-Carington AK (1984) Characteristics of the weathered
Galician Regional Government (Xunta de Galicia), the Spanish basement aquifer in Malawi in relation to rural water supplies. In:
Ministry of Economy and Competitiveness (Project PID2019- Proc. Challenges Afr Hydrol Water Resour Symp, IAH Series Publ
109544RB-I00), FEDER funds and the Galician Regional Government, 144, IAH, Goring, UK, pp 15–23
Xunta de Galicia (Grant number ED431C 2017/57) from “Consolidación
Cho M, Ha KM, Choi Y-S, Kee W-S, Lachassagne P, Wyns R (2003)
e estruturación de unidades de investigación competitivas”, Grupos de
Relationship between the permeability of hard-rock and their weath-
referencia competitiva.
ered cover based on geological and hydrogeological observation in
Open Access This article is licensed under a Creative Commons
South Korea. In: IAH Conference on groundwater in fractured
Attribution 4.0 International License, which permits use, sharing, adap- rocks, Prague, 15–19 September 2003
tation, distribution and reproduction in any medium or format, as long as Compaore G, Lachassagne P, Pointet T, Trabi Y (1997) Evaluation du
you give appropriate credit to the original author(s) and the source, pro- stock d’eau des altérites: éxperimentation sur le site granitique de
vide a link to the Creative Commons licence, and indicate if changes were Sanon (Burkina Faso) [Assessment of the alterites water stock: ex-
made. The images or other third party material in this article are included perimentation on the granite site of Sanon (Burkina Faso)]. Rabat
in the article's Creative Commons licence, unless indicated otherwise in a IASH conference, Publ. 241. IASH, Atlanta, GA, pp 37–46
credit line to the material. If material is not included in the article's Courtois N, Lachassagne P, Wyns R, Blanchin R, Bougaïre FD, Some S,
Creative Commons licence and your intended use is not permitted by Tapsoba A (2010) Large-scale mapping of hard-rock aquifer prop-
statutory regulation or exceeds the permitted use, you will need to obtain erties applied to Burkina Faso. Ground Water 48:269–283. https://
permission directly from the copyright holder. To view a copy of this doi.org/10.1111/j.1745-6584.2009.00620.x
licence, visit http://creativecommons.org/licenses/by/4.0/. Davis SN, Turk LJ (1964) Optimum depth of wells in crystalline rocks.
Ground Water 2:6–11. https://doi.org/10.1111/j.1745-6584.1964.
tb01750.xHydrogeol J
Detay M, Poyet P, Emsellem Y, Bernardi A, Aubrac G (1989) Krásný J (1997) Transmissivity and permeability distribution in hard
Development of the saprolite reservoir and its state of saturation: rock environment: a regional approach. Hard Rock Hydrosystems
influence on the hydrodynamic characteristics of drillings in crys- (Proceedings of Rabat Symposium S2, May 1997). IAHS Pub. no.
talline basement (in French). C R Acad Sci Paris II 309:429–436 241, pp 81–90
Dewandel, B, Maréchal JC, Bour O, Ladouche B, Ahmed S, Chandra S, Krásný J (2002) Quantitative hardrock hydrogeology in a regional scale.
Pauwels H (2012) Upscaling and regionalizing hydraulic conductiv- Norges Geol Unders Bull 439:7–14
ity and effective porosity at watershed scale in deeply weathered Krásný J, Sharp J (2007) Hydrogeology of fractured rocks from particular
crystalline aquifers. J Hydrol 416–417:83–97. https://doi.org/10. fractures to regional approaches: state-of-the-art and future chal-
1016/j.jhydrol.2011.11.038 lenge. In: Krásný J, Sharp J (eds) Groundwater in fractured rocks.
Dewandel B, Lachassagne P, Wyns R, Maréchal JC, Krishnamurthy NS IAH Selected Papers, vol 9. Taylor and Francis, London, pp 1–30
(2006) A generalized 3D geological ad hydrogeological conceptual Lachassagne P, Wyns R, Bérad P, Bruel T, Chéry L, Coutand T, Desprats
model of granite aquifers controlled by single or multiphase JF, Le Strat P (2001) Exploitation of high-yield in hard-rock aqui-
weathering. J Hydrol 330:260–284. https://doi.org/10.1016/j. fers: downscaling methodology combining GIS and multicriteria
jhydrol.2006.03.026 analysis to delineate field prospecting zones. Ground Water 41:
Dong Y, Fu F, Yeh TJ, Wang Y, Zha Y, Wang L, Hao Y, (2019) 333–341. https://doi.org/10.1111/j.1745-6584.2001.tb02345.x
Equivalence of Discrete Fracture Network and Porous Media Lee C-H, Farmer I (1993) Fluid Flow in Discontinuous Rocks, Chapman
Models by Hydraulic Tomography. Water Resour Res 55(4): & Hall, London
3234–3247. https://doi.org/10.1029/2018WR024290 Long JCS, Remer JS, Wilson CR, Witherspoon PA (1982) Porous media
EC (2010) Report from the Commission in accordance with Article 3.7 of equivalents for networks of discontinuous fractures. Water Resour
the Groundwater Directive 2006/118/EC on the establishment of Res 18 (3):645–658. https://doi.org/10.1029/WR018i003p00645
groundwater threshold values. 5.3.2010 C 1096 final, European Lu C, Samper J, Fritz B, Clement A, Montenegro L (2011) Interactions of
Commission, Brussels, 10 pp corrosion products and bentonite: an extended multicomponent re-
Espinha Marques J, Samper J, Pisani B, Alvares D, Carvalho JM, active transport model. Phys Chem Earth Parts A/B/C 36:1661–
Chaminé HI, Marques JM, Vieira GT, Mora C, Sodré Borges F 1668. https://doi.org/10.1016/j.pce.2011.07.013
(2010) Evaluation of water resources in a high-mountain basin in Lu D-B, Zhou Q-Y, Junejo SA, Xiao AL (2015) A systematic study of
Serra da Estrela, central Portugal, using a semi-distributed hydrolog- topography effect of ERT based on 3-D modeling and inversion.
ical model. Environ Earth Sci 62(6):1219–1234. https://doi.org/10. Pure Appl Geophys 172:1531–1546. https://doi.org/10.1007/
1007/s12665-010-0610-7 s00024-014-1015-4
Lubczynski MW, Gurwin J (2005) Integration of various data sources for
Espinha Marques J, Marques JM, Chaminé HI, Carreira PM, Fonseca PE,
transient groundwater modeling with spatio-temporally variable
Monteiro Santos FA, Moura R, Samper J, Pisani B, Teixeira J,
fluxes: Sardon study case, Spain. J Hydrol 306:71–96. https://doi.
Carvalho JM, Rocha F, Borges FS (2013) Conceptualizing a moun-
org/10.1016/j.jhydrol.2004.08.038
tain hydrogeologic system by using an integrated groundwater as-
Maréchal JC, Dewandel B, Subrahmanyam K (2004) Use of hydraulic
sessment (Serra da Estrela, central Portugal): a review. Geosci J
17(3):371–386. https://doi.org/10.1007/s12303-013-0019-x tests at different scales to characterize fracture network properties in
the weathered-fractured layer of a hard rock aquifer. Water Resour
Eyser (2012a) Estudio de la explotación en alta del abastecimiento al
Res 40:W11508. https://doi.org/10.1029/2004WR003137
Baixo Miño, Augas de Galicia Technnical Report [Study of the
Maréchal JC, Dewandel B, Ahmed S, Galeazzi L, Zaidi FK (2006)
exploitation of the supply in the Baixo Miño, Aguas de Galicia
Combined estimation of specific yield and natural recharge in a
Technical Report]. Xunta de Galicia, A Coruña, Spain
semi-arid groundwater basin with irrigated agriculture. J Hydrol
Eyser (2012b), Informe acerca de la captación de manantiales para
329:281–293. https://doi.org/10.1016/j.jhydrol.2006.02.022
abastecer al depósito de A Riña en Oia, Augas de Galicia
McFarlane MJ (1991) Some sedimentary aspects of lateritic weathering
Technnical Report [Report on the collection of springs to supply
profile development in the major bioclimatic zones of tropical
the A Riña reservoir in Oia, Aguas de Galicia Technnical Report].
Africa. J Afr Earth Sci 12:267–282. https://doi.org/10.1016/0899-
Xunta de Galicia, A Coruña, Spain
5362(91)90076-B
Fox RC, Hohmann GW, Killpack TJ, Rijo L (1980) Topographic effects Molinero J, Samper J, Zhang G, Yang C (2004) Biogeochemical reactive
in resistivity and induced polarization surveys. Geophys 45:75–93. transport model of the redox zone experiment of the Äspö Hard
https://doi.org/10.1190/1.1441041 Rock Laboratory in Sweden. Nucl Technol 148:151–165
Guihéneuf N, Boisson A, Bour O, Dewandel PJ, Dausse A, Viossanges Nahon D, Tardy Y (1992) The ferruginous laterites. In: Butt CRM,
M, Chandra S, Ahmed S, Maréchal JC (2014) Groundwater flows in Zeegers H (Eds) Regolith exploration geochemistry in tropical and
weathered crystalline rocks: impact of piezometric variations and sub-tropical terrains. Handb Explor Geochem 4, Elsevier,
depth-dependent fracture connectivity. J Hydrol 511:320–334. Amsterdam, pp. 41–55
https://doi.org/10.1016/j.jhydrol.2014.01.061 Naves A, Samper J, Mon A, Pisani B, Montenegro L, Martins Carvalho J
Gurtz J, Zappa M, Jasper K, Lang H, Verbunt M, Badoux A, Vitvar T (2019) Demonstrative actions of spring restoration and groundwater
(2003) A comparative study in modelling runoff and its components protection in rural areas of Abegondo (Galicia, Spain). Sustain
in two mountainous catchments. Hydrol Process 17:297–311. Water Resour Manag 5:175–186. https://doi.org/10.1007/s40899-
https://doi.org/10.1002/hyp.1125 017-0169-5
Houston JFT, Lewis RT (1988) The Victoria Province drought relief Oliva P, Viers J, Dupre B (2003) Chemical weathering in granitic envi-
project, II: borehole yield relationships. Ground Water 26(4):418– ronments. Chem Geol 202:225–256. https://doi.org/10.1016/j.
426. https://doi.org/10.1111/j.1745-6584.1988.tb00407.x chemgeo.2002.08.001
Howard KWF, Hughes M, Charlesworth DL, Ngobi G (1992) Peel MC, Finlayson BL, McMahon TA (2007) Updated world map of the
Hydrogeologic evaluation of fracture permeability in crystalline Köppen-Geiger climate classification. Hydrol Earth Syst Sci 11:
basement aquifers of Uganda. Hydrogeol J 1:55–65. https://doi. 1633–1644. https://doi.org/10.5194/hess-11-1633-2007
org/10.1007/S100400050029 Pérez-Alberti A, Trenhaile AS (2014) An initial evaluation of drone-
Kottek M, Grieser J, Beck C, Rudolf B, Rubel F (2006) World map of the based monitoring of boulder beaches in Galicia, north-western
Köppen-Geiger climate classification updated. Meteorol Z 15(3): Spain. Earth Surf Process Landf 40:105–111. https://doi.org/10.
259–263 1002/esp.3654Hydrogeol J
Pickens JF, Grisak GE, Avis JD, Belanger DW, Thury M (1987) alluvial aquifers (Spain). Environ Earth Sci 73:2595–2608. https://
Analyses and interpretation of borehole hydraulic tests in deep bore- doi.org/10.1007/s12665-014-3734-3
holes: principles model development, and applications. Water Selroos J-O, Walker DD, Ström A, Gylling B, Follind S (2002)
Resour Res 23:1341–1375. https://doi.org/10.1029/ Comparison of alternative modelling approaches for groundwater
WR023i007p01341 flow in fractured rock. J Hydrol 257:174–188. https://doi.org/10.
Pisani B, Samper J, Espinha-Marques J (2019) Climate change impact on 1016/S0022-1694(01)00551-0
groundwater resources of Serra da Estrela mountain region in central Stigter TY, Nunes JP, Pisani B, Fakir Y, Hugman R, Li Y, Tomé S,
Portugal. Sustain Water Resour Manag 5:289–304. https://doi.org/ Ribeiro L, Samper J, Oliveira R, Monteiro JP, Silva A, Tavares
10.1007/s40899-017-0129-0 PCF, Shapouri M, Cancela da Fonseca L, Himer E (2014)
Pliego D, Corretge LG (1978) Geologic map of Spain (MAGNA), scale Comparative assessment of climate change impacts on coastal
1:50.000, sheet: Oya. Instituto Geológico y Minero de España groundwater resources and dependent ecosystems in the
(IGME), Madrid Mediterranean. Reg Environ Chang 14(Suppl 1):S41–S56. https://
Pliego D, Rubio J, Abril J, Corretge LG (1978) Geologic map of Spain doi.org/10.1007/s10113-012-0377-3
(MAGNA), scale 1:50.000, sheet: Tuy. Instituto Geológico y Taylor R, Howard K (1998) Post-Paleozoic evolution of weathered land
Minero de España (IGME), Madrid surfaces in Uganda by tectonically controlled deep weathering and
Rushton KR, Weller J (1985) Response to pumping test of a weathered- stripping. Geomorphology 25:173–192
fractured granite aquifer. J Hydrol 80:299–309. https://doi.org/10. Taylor R, Howard K (2000) A tectono-geomorphic model of hydrogeol-
1016/0022-1694(85)90123-4 ogy of deeply weathered crystalline rock: evidence from Uganda.
Samper J, Huguet L, Ares J, García Vera MA (1999) Manual del usuario Hydrogeol J 8:279–294. https://doi.org/10.1007/s100400000069
del programa VISUAL BALAN v1.0: código interactivo Para la Thomas MF (1994) Geomorphology in the tropics. Wiley, New York
realización de balances hidrológicos y la estimación de la recarga Walker DD, Gylling B, Strom A, Selroos JO (2001) Hydrogeological
[User manual of the program VISUAL BALAN v1.0: a user- studies for nuclear-waste disposal in Sweden. Hydrogeol J 9:419–
friendly code to compute water balances and assess the aquifer re- 431. https://doi.org/10.1007/s100400100156
charge]. ENRESA 05/99, ENRESA, Madrid, 134 pp Wrigth EP (1992) The hydrogeology of crystalline basement aquifers in
Samper J, García Vera MA, Pisani B, Varela A, Losada JA, Alvares D, Africa. In: Wrigth EP, Burgess WG (eds) Hydrogeology of crystal-
Espinha Marques J (2007) Using hydrological models and geo- line basement aquifers in Africa. Geol Soc Lond Spec Publ 66:1–27
graphic information systems for water resources evaluation: GIS- Wu Y, Xu Y (2005) Snow impact on groundwater recharge in
VISUAL-BALAN and its application to Atlantic basins in Spain Table Mountain Group aquifer systems with a case study of the
(Valiñas) and Portugal (Serra da Estrela). In: Lobo Ferreira JP, Kommissiekraal River catchment South Africa. Water SA 31:275–
Vieira JMP (eds) Water in Celtic countries: quantity, quality and 282. https://doi.org/10.4314/wsa.v31i3.5207
climate variability. IAHS Publ. 310, IAHS, Wallingford, UK, pp Wyns RJ, Gourry JC, Baltassat JM, Lebert F (1999) Caractérisation
259–266 multiparamètres des horizons de subsurface (0–100 m) en contexte
Samper J, Xu T, Yang C (2009) A sequential partly iterative approach for de socle altéré [Multiparameter characterization of subsurface hori-
multicomponent reactive transport with CORE2D. Comput Geosci zons (0–100 m) in an altered basement context]. In: 2ème Colloque
13:301–316. https://doi.org/10.1007/s10596-008-9119-5 GEOFCAN, Orléans, France, BRGM, Orléans, France, pp 105–110
Samper J, Yang C, Zheng L, Montenegro L, Xu T, Dai Z, Zhang G, Lu C, Wyns RJ, Quesnel F, Simon-Coinçon R, Guillocheau F, Lacquement F
Moreira S (2012) CORE2D V4: a code for water flow, heat and (2003) Major weathering in France related to litospheric deforma-
solute transport, geochemical reactions, and microbial processes. tion. Géol France 2003(1):79–87
In: Groundwater reactive transport models. Bentham Science, pp Wyns RJ, Baltassat M, Lachassagne P, Legchenko A, Vairon J, Mathieu
160–185. https://doi.org/10.2174/978160805306311201010160 F (2004) Application of SNMR soundings for groundwater reserves
Samper J, Pisani B, Espinha Marques J (2015a) Hydrological models of mapping in weathered basement rocks (Brittany, France). Bull Soc
interflow in three Iberian mountain basins. Environ Earth Sci 73: Géol Fr 175:21–34
2645–2656. https://doi.org/10.1007/s12665-014-3676-9
Samper J, Li Y, Pisani B (2015b) An evaluation of climate change im- Publisher’s note Springer Nature remains neutral with regard to jurisdic-
pacts on groundwater flow in the La Plana de la Galera and Tortosa tional claims in published maps and institutional affiliations.You can also read