Climate change and Northern Hemisphere lake and river ice phenology from 1931-2005
←
→
Page content transcription
If your browser does not render page correctly, please read the page content below

The Cryosphere, 15, 2211–2234, 2021
https://doi.org/10.5194/tc-15-2211-2021
© Author(s) 2021. This work is distributed under
the Creative Commons Attribution 4.0 License.

Climate change and Northern Hemisphere lake and river ice
phenology from 1931–2005
Andrew M. W. Newton and Donal J. Mullan
Geography, School of Natural and Built Environment, Queen’s University Belfast, Belfast, BT7 1NN, UK

Correspondence: Andrew M. W. Newton (amwnewton@gmail.com)

Received: 23 June 2020 – Discussion started: 31 July 2020
Revised: 1 March 2021 – Accepted: 16 March 2021 – Published: 10 May 2021

Abstract. At high latitudes and altitudes one of the main           erned by the geographical setting (heat exchange, wind, pre-
controls on hydrological and biogeochemical processes is            cipitation, latitude, and altitude) and the morphometry and
the breakup and freeze-up of lake and river ice. This study         heat storage capacity of the water body (Jeffries and Morris,
uses 3510 time series from across 678 Northern Hemisphere           2007; Korhonen, 2006; Leppäranta, 2015; Livingstone and
lakes and rivers to explore historical patterns in lake and river   Adrian, 2009; Weyhenmeyer et al., 2004; Williams, 1965;
ice phenology across five overlapping time periods (1931–           Williams and Stefan, 2006). Though preceding surface air
1960, 1946–1975, 1961–1990, 1976–2005, and 1931–2005).              temperatures provide a seasonal energy flux that is well cor-
These time series show that the number of annual open-water         related with breakup and freeze-up (Assel and Robertson,
days increased by 0.63 d per decade from 1931–2005 across           1995; Brown and Duguay, 2010; Jeffries and Morris, 2007;
the Northern Hemisphere, with trends for breakup and, to            Livingstone, 1997; Palecki and Barry, 1986), cycles of tem-
a lesser extent, freeze-up closely correlating with regionally      perature linked to large-scale climatic indices have also oc-
averaged temperature. Breakup and freeze-up trends display          casionally been observed to impact ice phenology (Living-
a spatiotemporally complex evolution and reveal consider-           stone, 2000).
able caveats with interpreting the implications of ice phe-            The majority of lakes and rivers that seasonally freeze are
nology changes at lake and river sites that may only have           in the Northern Hemisphere, and most research has focused
breakup or freeze-up data, rather than both. These results          on breakup and freeze-up dates, ice season length, and ice
provide an important contribution by showing regional varia-        thickness (Duguay et al., 2003; Prowse et al., 2011). As ac-
tion in ice phenology trends through time that can be hidden        knowledged by the IPCC (2007), an assessment of changes
by longer-term trends. The overlapping 30-year time peri-           in broader ice phenology is complicated by, among several
ods also show evidence for an acceleration in warming trends        factors, the tendency to consider only local areas. Although
through time. Understanding the changes on both long- and           trends vary, there is a proclivity for breakup and freeze-up
short-term timescales will be important for determining the         records to lean towards shorter ice seasons that are correlated
causes of this change, the underlying biogeochemical pro-           with temperature trends (Table 1). Changes in ice breakup
cesses associated with it, and the wider climatological sig-        and freeze-up dates, therefore, provide an additional data
nificance as global temperatures rise.                              source for investigating climate patterns (Assel et al., 2003).
                                                                    Whilst the current literature supports observations of a warm-
                                                                    ing climate, the full spatiotemporal variation seen in smaller
                                                                    case studies has not been transferred to a hemispheric scale.
1   Introduction                                                    This is important because over the next century temperature
                                                                    rise is expected to continue across the Arctic, where lakes
One of the main controls on hydrological and biogeochemi-           and rivers subjected to freeze and thaw cycles are predom-
cal processes at high latitudes is the freeze-up and breakup        inantly located (Collins et al., 2013). Understanding histor-
of lake and river ice (Bengtsson, 2011; Rees et al., 2008;          ical patterns and changes in lake and river ice phenology is
Stottlemyer and Toczydlowski, 1999). Ice phenology is gov-

Published by Copernicus Publications on behalf of the European Geosciences Union.
2212                            A. M. W. Newton and D. J. Mullan: Climate change and NH lake and river ice phenology

required to confidently project future evolution and climate     2005, and 1931–2005. These are investigated across three
system feedbacks (Brown and Duguay, 2011; Emilson et al.,        broad areas: North America, Europe, and Russia. All study
2018). In the last century the number of ice phenology ob-       sites in the database which fall within these time periods and
servations has increased markedly due to their importance        have a maximum percentage of missing values of 10 % were
for energy and water balances (Rouse et al., 2003; Weyhen-       included. These specific time periods were chosen as they of-
meyer et al., 2011) and infrastructure such as ice roads (Mul-   fer the opportunity to include as many data from the IPD as
lan et al., 2017). This paper explores the hemispheric spa-      possible. Initial analysis showed that of the 1736 lakes and
tiotemporal trends in ice phenology by investigating an ex-      rivers in the IPD, 678 sites had ≥ 90 % of annual data for
tensive database containing 3510 individual time series from     either freeze-up or breakup for at least one of the time pe-
678 Northern Hemisphere study sites. The aim of this work        riods within one of the three regions. The number of sites
is to use this database to explore how spatiotemporal trends     contained within each time period and for each geograph-
in lake and river ice breakup and freeze-up dates, as well as    ical area is shown in Table 2. The final dataset provides
the number of annual open-water days, have changed across        3510 individual time series spread across the Northern Hemi-
several 30-year-long overlapping time periods from 1931–         sphere (Fig. 1a) but primarily concentrated in North America
2005. Sites with data available for the full 1931–2005 time      (Fig. 1b) and Europe (Fig. 1c). Data on breakup, freeze-up,
period are used to investigate how short-term trends observed    and annual open-water days for the 1931–2005 time period
from 30-year-long records compare to longer-term changes.        were available for 87, 48, and 37 sites, respectively (Table 2).
Sites with data for the full 1931–2005 time period are also      The majority of these sites are clustered around the Lauren-
compared with regional climate drivers (e.g. temperature) to     tian Great Lakes in North America and Sweden and Finland
investigate how much of the variability in lake and river ice    in Europe. In Russia there is only one site in the southwest
phenology can be attributed to longer-term regional climate      of Lake Baikal.
changes.                                                            Breakup and freeze-up dates were first converted to ordi-
                                                                 nal days. For some sites, freeze-up or breakup in a specific
                                                                 year occasionally fell in a preceding or succeeding year, and
2   Materials and methods                                        the ordinal date reflects this by providing a relative date –
                                                                 i.e. if freeze-up for the 1941 ice season occurred on 5 Jan-
The Global Lake and River Ice Phenology Database from            uary 1942, then the ordinal day allocated was 370. Like-
the National Snow and Ice Data Center (NSIDC) (avail-            wise, if breakup for the 1943 ice season occurred on 28 De-
able at https://nsidc.org/data/lake_river_ice/, last access:     cember 1942, then the ordinal date allocated was −3. These
13 July 2020 – Benson et al., 2013) provides breakup and         records were adjusted as necessary to calculate the number of
freeze-up dates for 865 Northern Hemisphere sites. In this       annual open-water days. The ordinal-day records were tested
database the freeze-up date is defined as the first day in       using the Mann–Kendall test where the null hypothesis of no
which the water is completely ice covered and the breakup        trend was tested against the alternative hypothesis that there
is the date of the last ice breakup before the open-water        is a monotonic trend in the time series. The Mann–Kendall
season. Whilst the specific definitions for breakup/freeze-up    test is a nonparametric test which detects trends without
may vary between different sites, the precise definition is      specifying if they are linear or nonlinear. It does not, how-
thought to be consistent at each site. Thus, if climate sig-     ever, calculate trend magnitude, so Sen’s slope was also used
nals are present in the ice phenology data, then they should     (Yue et al., 2002). A full description of these combined meth-
still be observable and broadly comparable. This database        ods can be found in Salmi et al. (2002). These two statistical
is supplemented with data from the Swedish Meteorological        techniques are commonly used in climate and environmental
and Hydrological Institute (SMHI) which contain 749 lakes        science as they can account for missing values. These meth-
and rivers using similar terminology. Data for 122 lakes and     ods were applied to all sites with at least 90 % data cover-
rivers were provided by the Finnish Meteorological Institute.    age (Table 2) for each individual time period to document
Several sites were already in the NSIDC dataset but were         the significance (α < 0.1), the magnitude of the slope, and
updated where necessary. The three datasets were integrated      decadal change derived from that magnitude. The 90 % al-
to create the Ice Phenology Database (IPD) containing data       lowance means that the maximum number of sites was used
across North America, Europe, and Russia (Fig. 1). It is im-     for each of the five time periods. The trend magnitudes and
portant to note that in the later part of the 1980s and 1990s    directions were converted into the number of days per decade
data for many Russian and Canadian sites are not recorded in     change in the date of breakup and freeze-up or number of
the database.                                                    annual open-water days at each site during each time period.
   Prior to 1931 data are sparse, and many of the longer         The magnitude of the decadal change is mapped for all sites,
time series have been explored by Magnuson et al. (2000)         with those that are statistically significant clearly identified in
and Benson et al. (2012). To investigate the spatiotempo-        the symbology. To investigate short-term variations over the
ral patterns of ice phenology, five overlapping time periods     75-year time period, residuals were calculated for breakup,
were studied: 1931–1960, 1946–1975, 1961–1990, 1976–             freeze-up, and open-water days. Similarly to in Sharma and

The Cryosphere, 15, 2211–2234, 2021                                                  https://doi.org/10.5194/tc-15-2211-2021
A. M. W. Newton and D. J. Mullan: Climate change and NH lake and river ice phenology                                                 2213

Table 1. Summary of ice phenology trend observations from across the Northern Hemisphere. Note this is not meant to be an exhaustive list,
but it provides a general overview of ice phenology changes.

         Region            Reference                      Time period     Key observations
         North America     Assel and Robertson (1995)     1851–1993          – Breakup dates have become earlier since 1940
                                                                               with air temperatures increasing during the win-
                                                                               ter season at Lake Michigan
         North America     Assel et al. (2003)            1963–2001          – Great Lakes show a reduction in the maximum
                                                                               fraction of lake surface ice coverage
         North America     Bai et al. (2012)              1963–2010          – Great Lakes show ice cover has detectable rela-
                                                                               tionships with NAO and ENSO
         North America     Bennington et al. (2010)       1979–2006          – Model results show increased Lake Superior sur-
                                                                               face temperatures and declining ice coverage of
                                                                               886 km2 per year
         North America     Bonsal et al. (2006)           1950–1999          – Ice phenology influenced by extreme phases of
                                                                               PNA, PDO, ENSO, and NP in Canada
                                                                             – Lakes have a stronger and more coherent pattern
                                                                               compared to rivers
         North America     Brammer et al. (2015)          1972–2013          – Ice season length decreased over the time period
                                                                               and was driven by earlier breakup
         North America     Duguay et al. (2006)           1951–2000          – Earlier breakup trends in most lakes that were con-
                                                                               sistent with snow cover duration
                                                                             – Freeze-up trends were more variable with later
                                                                               and earlier dates
                                                                             – Strong relationship is shown between 0 ◦ C and
                                                                               breakup/freeze-up dates in Canada
         North America     Futter (2003)                  1853–2001          – In Southern Ontario significant trends towards
                                                                               earlier breakup and an extension to the ice-free
                                                                               season length
         North America     Ghanbari et al. (2009)         1855–2005          – PDO, ENSO, and NAO explain some, but not all,
                                                                               ice phenology variability at Lake Mendota
         North America     Hewitt et al. (2018)           1981–2015          – Lake ice breakup occurred 1.5 d per decade earlier
                                                                               and freeze-up 2.3 d per decade later
                                                                             – Strong association with warming air temperatures
         North America     Hodgkins et al. (2005)         1930–2000          – River sites in New England show a decrease in ice
                                                                               season length by 20 d
         North America     Jensen et al. (2007)           1975–2004          – Recent trends for changes in breakup and freeze-
                                                                               up dates were larger than historical trends, with
                                                                               ice duration decreasing by 5.3 d per decade in the
                                                                               Great Lakes region
         North America     Lacroix et al. (2005)          1822–1999          – Across Canada breakup dates tend to be earlier,
                                                                               whilst freeze-up trends tend to be spatiotempo-
                                                                               rally more variable
         North America     Latifovic and Pouliot (2007)   1950–2004          – Average of 0.18 d per year earlier breakup and
                                                                               0.12 d per year later freeze-up for the majority of
                                                                               sites in Canada
         North America     Magnuson et al. (2005)         1977–2002          – Lakes in the Great Lakes region show a generally
                                                                               coherent pattern for breakup

https://doi.org/10.5194/tc-15-2211-2021                                                       The Cryosphere, 15, 2211–2234, 2021
2214                              A. M. W. Newton and D. J. Mullan: Climate change and NH lake and river ice phenology

Table 1. Continued.

     Region           Reference                                Time period   Key observations
     North America    Sharma et al. (2013)                     1905–2004       – Linear trends in rain and snowfall in the month
                                                                                 prior to breakup, air temperature in the winter, and
                                                                                 large-scale climatic oscillations all significantly
                                                                                 influence breakup timing
     North America    White et al. (2007)                      1912–2001       – Earlier breakup and later freeze-up for a number
                                                                                 of river sites across Alaska and Maine
     Europe           Blenckner et al. (2004)                  1961–2002       – NAO and ice cover show strong relationship that
                                                                                 is less pronounced in the north compared to the
                                                                                 south in Sweden and Finland
     Europe           Gebre and Alfredsen (2011)               1864–2009       – Variable trends towards later and earlier breakup
                                                                                 and freeze-up for rivers in Norway
                                                                               – Temperature and river discharge important for
                                                                                 breakup and freeze-up
     Europe           George (2007)                            1933–2000       – Reduction in the number of days with ice and fre-
                                                                                 quency of ice cover
                                                                               – NAO strong influence on annual variability at
                                                                                 Lake Windermere
     Europe           Korhonen (2006)                          1693–2002       – In Finland there are significant trends towards ear-
                                                                                 lier breakup in the late 19th century to 2002
                                                                               – Trends towards later freeze-up leading to a reduc-
                                                                                 tion in ice season length
     Europe           Marszelewski and Skowron (2006)          1961–2000       – Ice season length has been reducing by 0.8–0.9 d
                                                                                 per year at six lakes in northern Poland
     Europe           Nõges and Nõges (2014)                   1922–2011       – Greater levels of snowfall associated with later
                                                                                 breakup
                                                                               – Lake ice phenology trends were weak, despite sig-
                                                                                 nificant air and lake surface temperature trends
     Europe           Šarauskienė and Jurgelėnaitė (2008)   1931–2005       – In Lithuania warmer winters caused later freeze-
                                                                                 up and reduced ice season length
     Europe           Stonevicius et al. (2008)                1812–2000       – Reduction in ice season length for the river Nemu-
                                                                                 nas, Lithuania
     Europe           Weyhenmeyer et al. (2004)                1960–2002       – Results from 196 Swedish lakes showing a non-
                                                                                 linear temperature response of breakup dates
                                                                               – Future climate change impacts will likely vary
                                                                                 along a temperature gradient
     Russia           Borshch et al. (2001)                    1893–1991       – In European Russia freeze-up occurs later and
                                                                                 breakup occurs earlier
                                                                               – Rivers assessed in Siberia show insignificant and
                                                                                 occasionally opposite trends
     Russia           Karetnikov and Naumenko (2008)           1943–2007       – NAO is well correlated with the ice cover at Lake
                                                                                 Ladoga
     Russia           Kouraev et al. (2007)                    1869–2004       – Lake Baikal trends change through time with
                                                                                 period from 1990–2004 characterised by an in-
                                                                                 creased ice season length
     Russia           Livingstone (1999)                       1869–1996       – Breakup relationship with NAO after 1920 at Lake
                                                                                 Baikal

The Cryosphere, 15, 2211–2234, 2021                                                        https://doi.org/10.5194/tc-15-2211-2021
A. M. W. Newton and D. J. Mullan: Climate change and NH lake and river ice phenology                                        2215

Table 1. Continued.

    Region                Reference                    Time period   Key observations
    Russia                Smith (2000)                 1917–1994       – Fluctuations of patterns between longer and
                                                                         shorter ice season lengths that are generally con-
                                                                         sistent with temperature trends
    Russia                Todd and Mackay (2003)       1869–1996       – Significant trends towards reduced ice season and
                                                                         ice thickness at Lake Baikal over the period of
                                                                         study
    Russia                Vuglinsky (2002)             1917–1994       – Rivers in Asian Russia freeze earlier and break up
                                                                         later compared to rivers in European Russia
                                                                       – This is due to antecedent climatological condi-
                                                                         tions
    Asia                  Batima et al. (2004)         1945–1999       – River ice thickness and ice season length have de-
                                                                         creased over the time period
    Asia                  Jiang et al. (2008)          1968–2001       – Yellow River has experienced later freeze-up and
                                                                         earlier breakup, leading to a reduction in the ice
                                                                         season by 12–38 d at different sites along the river
    Northern Hemisphere   Benson et al. (2012)         1855–2005       – For 75 lakes the trends towards earlier breakup,
                                                                         later freeze-up, and a shorter ice season duration
                                                                         were stronger for the most recent time period stud-
                                                                         ied
    Northern Hemisphere   Livingstone (2000)           1865–1996       – NAO signal detected at a number of sites but with
                                                                         variable strength across several Northern Hemi-
                                                                         sphere sites
    Northern Hemisphere   Magnuson et al. (2000)       1846–1995       – Breakup on average 6.3 d per century earlier
                                                                         across multiple Northern Hemisphere sites
                                                                       – Freeze-up on average 5.7 d later per century
    Northern Hemisphere   Sharma and Magnuson (2014)   1855–2004       – All 13 lake study sites demonstrated oscillatory-
                                                                         dynamics-influenced ice breakup
    Northern Hemisphere   Sharma et al. (2016)         1443–2014       – Trends towards later freeze-up in Japan and earlier
                                                                         breakup in Finland
                                                                       – Strong linkage between these trends and climate
                                                                         change and variability
    Northern Hemisphere   Sharma et al. (2019)         1443–2018       – Analysis of 513 sites shows the importance of
                                                                         air temperature, lake morphometry, elevation, and
                                                                         shoreline geometry in governing ice cover
                                                                       – Future projections suggest an extensive loss of
                                                                         lake ice over the next generation
    Northern Hemisphere   Šmejkalová et al. (2016)     2000–2013       – All areas showed significant trends of earlier
                                                                         breakup
                                                                       – The 0 ◦ C isotherm shows the strongest relation-
                                                                         ship with ice phenology trends
    Northern Hemisphere   Wynne (2000)                 1896–1995       – Trend directions for four sites regularly switched
                                                                         over the 100-year time span

https://doi.org/10.5194/tc-15-2211-2021                                             The Cryosphere, 15, 2211–2234, 2021
2216                               A. M. W. Newton and D. J. Mullan: Climate change and NH lake and river ice phenology

Table 2. Summary of the number of sites with at least 90 % of annual data available for breakup, freeze-up, or annual open-water days across
the five time periods and geographical regions. NAM, EUR, and RUS are abbreviations for North America, Europe, and Russia, respectively.

                              Breakup                                     Freeze-up                            Annual open-water days
                     Lakes                   Rivers               Lakes                Rivers               Lakes                  Rivers
             NAM     EUR     RUS   NAM        EUR     RUS   NAM   EUR     RUS   NAM     EUR     RUS   NAM   EUR     RUS    NAM      EUR     RUS
 1931–1960      64    188      5         7       9      0    14    163      6      6       5      0    13    143       5       4        4     0
 1946–1975     104    245     24        14       8      0    27    220     24     11       4      0    22    200      24       7        2     0
 1961–1990     128    255     26        16       6      0    49    252     27     12       4      0    47    236      25      10        3     0
 1976–2005      91    172      1         2       5      0    41    170      1      0       2      0    38    144       1       0        2     0
 1931–2005      44     39      1         0       3      0     9     36      1      0       2      0     7     28       1       0        1     0

Figure 1. (a) Map showing the three main study areas. The red and green circles in panels (b)–(d) are lake and river sites, respectively, that
have time series containing at least 90 % coverage for breakup and/or freeze-up during at least one time period. The majority of river sites
are located in Canada, with Russia only having data available for lakes. The geographical extent used in panels (b)–(d) for each region of
interest is the same in subsequent figures. The zoomed-in extent of the Russian study area in Fig. 7 is shown by the blue outline on (a).

Magnuson (2014), a range of running means were applied,                    were downloaded as a spatially averaged regional time se-
with an 11-year window shown to be the most useful for the                 ries for three geographical regions encompassing only study
75-year time series.                                                       sites with data for the full 1931–2005 time period: Europe
   A range of climate variables and atmospheric/oceanic                    (EUR), 57.5–68.5◦ N, 12–29◦ E; North America (NAM),
modes of variability were downloaded from the KNMI Cli-                    42.5–47◦ N, 73.5–95.5◦ W; and Russia (RUS), 51.5–52◦ N,
mate Explorer (http://climexp.knmi.nl/, last access: 31 Au-                104.5–105◦ E. Data were extracted for 1931–2005 to cor-
gust 2018) to facilitate examination of potential regional                 respond with the length of the IPD. We elected for this re-
drivers of ice phenology change. Monthly mean tempera-                     gionalised strategy because (1) the computational and human
tures and precipitation were extracted from the Climatic Re-               resources needed to analyse climate records for each indi-
search Unit (CRU) Time-Series (TS) Version 4.01 (Harris et                 vidual site are vast and (2) we were interested in establish-
al., 2014). CRU TS4.01 applies angular-distance weighting                  ing broader regional climate drivers of ice phenology rather
(ADW) interpolation to monthly observational data derived                  than in developing correlations with local climate, which we
from national meteorological services to produce monthly                   would expect to be very strong. For 1931–2005, monthly
gridded mean temperatures and precipitation at a spatial res-              data on the Arctic Oscillation (AO) (Thompson and Wal-
olution of 0.5◦ latitude × 0.5◦ longitude. Wind speed data                 lace, 2000), the Atlantic Multidecadal Oscillation (AMO)
were extracted from the International Comprehensive Ocean-                 (van Oldenborgh et al., 2009), the North Atlantic Oscillation
Atmosphere Data Set (ICOADS), which provides simple                        (NAO) (Jones et al., 1997), and the Southern Oscillation in-
gridded monthly wind speeds for 2◦ latitude × 2◦ longi-                    dex (SOI) (Ropelewski and Jones, 1987) were also extracted.
tude grid boxes (Freeman et al., 2017). All these data

The Cryosphere, 15, 2211–2234, 2021                                                              https://doi.org/10.5194/tc-15-2211-2021
A. M. W. Newton and D. J. Mullan: Climate change and NH lake and river ice phenology                                             2217

   Ice breakup and freeze-up records from the IPD were spa-         erate correlation (R 2 = 0.49–0.59) with latitude, with freeze-
tially averaged into three regional composite records corre-        up occurring earlier in the year with increasing latitude. Like
sponding to the three geographical regions (EUR, NAM, and           breakup trends, the 1976–2005 time period shows the weak-
RUS) defined above. Statistical relationships were then ex-         est correlation, but it is not associated with an anomalous
amined between ice phenology dates and climate records              high-latitude site. Unlike North America, where sites cover a
(maximum temperatures and modes of variability) using               wide range of longitudes, in Europe the data are generally re-
Pearson product-moment correlation. These relationships             stricted to a narrower range in Sweden and Finland (Fig. 1).
were analysed on a monthly basis, first for each of the 12 cal-     In all four of the 30-year time periods there is a strong corre-
endar months and second for 12 sliding windows of 3-month           lation (R 2 = 0.77–0.86) between median breakup dates and
means (e.g. mean of January, February, March, then mean of          latitude (Fig. 2). Freeze-up dates appear to show some as-
February, March, April).                                            sociation with latitude, but trends are very weak in the first
                                                                    two time periods (R 2 = 0.19–0.21) and weak in the last two
                                                                    (R 2 = 0.39–0.42). The range of breakup and freeze-up dates
3     Results – ice phenology change                                recorded at European sites (grey points in Fig. 2) becomes
                                                                    more scattered through time, especially south of 60◦ N. This
A climate regime with increasing mean air temperatures              shows greater variability in breakup and freeze-up dates at
would be expected to increase the number of annual open-            lower-latitude sites and that the time window in which ice
water days for sites that seasonally freeze through earlier         breakup and freeze-up occurs appears to have become wider
breakup and/or later freeze-up dates. The decadal trend for         from 1961–2005. These date shifts also show that in the latter
the number of annual open-water days allows for an inte-            two time periods, compared with the first two time periods,
grated observation of breakup and/or freeze-up date changes         there is an increased occurrence of breakup dates within the
relative to each other – i.e. the longevity of open water, rather   first 40 d of the year and freeze-up dates shifting to a later part
than a specific shift in the precise breakup and/or freeze-up       of the winter season – i.e. freeze-up not occurring until Jan-
dates. In this section the results from the Mann–Kendall and        uary and February of the following year. The wide longitu-
Sen’s slope analysis are presented for the three main study ar-     dinal and latitudinal spread of a comparatively small number
eas: North America, Europe, and Russia. In total, 678 study         of lakes in Russia for any time period (Table 2) precludes any
sites provide at least one time series with ≥ 90 % complete         confident correlations or associations. Although it is sporadic
annual data across the four 30-year time periods and the one        and not consistent in study areas or time periods, additional
75-year time period, with 3510 individual time series avail-        analysis of all the lake and river sites show that occasionally
able (Table 2). A summary of the breakup/freeze-up dates            median dates were weakly or very weakly (R 2 = 0.05–0.25)
available for each of the four 30-year time periods is pre-         correlated with other criteria such as lake area and elevation.
sented in Fig. 2. These data are used to determine decadal             For each 30-year time period the proportions of trends dis-
trend directions that have been summarised in Fig. 3 and in         playing warming and cooling trends have been summarised
Table 3 as mean changes in breakup and freeze-up dates, as          in Fig. 3. This shows that through time the proportion of
well as in the number of annual open-water days. The general        sites displaying warming trends has increased. Freeze-up and
trends are first presented, before looking at the spatiotempo-      the number of annual open-waters days display a gradual in-
ral trends across the three study regions.                          crease in warming trends through time and an increase in
                                                                    the proportion of sites with statistically significant warm-
3.1    General trends                                               ing trends. Mean decadal values show a gradual reduction
                                                                    in cooling trends from 1931–1960 and an increased warm-
The combined time series and spread of dates for breakup            ing during 1976–2005, albeit with high standard deviations
and freeze-up across each time period is summarised in              when averaged across all sites (Table 3). Despite this consis-
Fig. 2. In North America across all time periods the majority       tent pattern, when observed at the three regional scales (dis-
of sites are in a band of latitude between 42–55◦ . There is a      cussed below), the proportions of warming and cooling pat-
moderate correlation between median breakup dates and lat-          terns tend to fluctuate between the different time periods. It is
itude, with the R 2 values typically ≥ 0.50 showing that the        only freeze-up changes in Europe that show a similar pattern
breakup date becomes later with increasing latitude (Fig. 2).       to that observed for all freeze-up sites when combined, likely
The one exception to this is for the 1976–2005 time period          reflecting that data in Europe provide a larger proportion of
where the R 2 value is 0.27. However, one site in the north-        the total number of sites (Fig. 3). What is common amongst
west of the region has a latitude 16◦ more northerly than any       all sites is that the 1976–2005 time period displays the largest
other site and appears to skew the correlation as when this         proportion of sites with warming trends, with the exception
outlier is removed the R 2 value increases to 0.48. An addi-        of Russia (which has only one site), for freeze-up and the
tional caveat is that this time period also marks a reduction       number of open-water days. For breakup the warming pat-
in the latitudinal range of the sites included in the database.     tern for all sites also shows a longer-term increase through
Median freeze-up dates in North America also show a mod-            time that is interrupted by an increased proportion of sites

https://doi.org/10.5194/tc-15-2211-2021                                                    The Cryosphere, 15, 2211–2234, 2021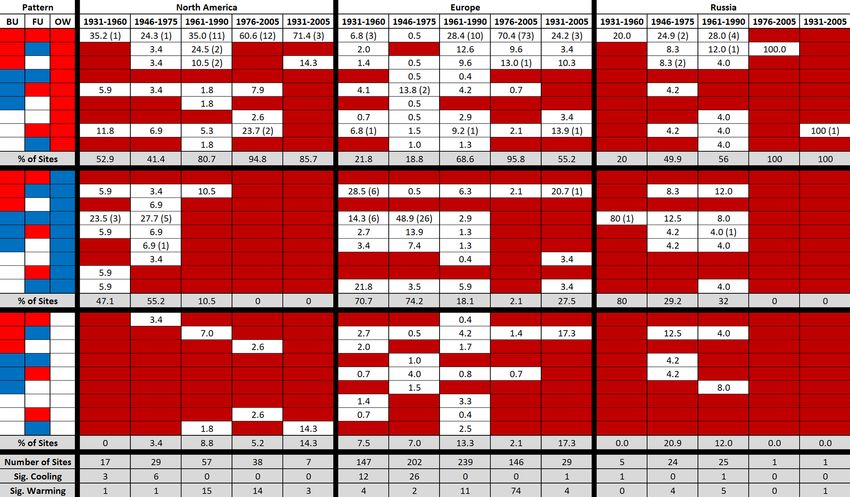
2218                                A. M. W. Newton and D. J. Mullan: Climate change and NH lake and river ice phenology

Figure 2. Summary graphs showing breakup and freeze-up dates against latitude for all lake and river sites included in each of the four
30-year-long time periods. The data are colour coded by region in the key. The numbers that are adjacent to the recorded dates are R 2 values
for each set of regional data. These are also coloured coded on the key – e.g. light blue data show the median breakup dates for North America
and an R 2 value between the median date and latitude of 0.52 from 1931–1960. The underlying grey points show the total ranges of dates
that were recorded for each site in each time period. Note that some European breakup observations demonstrate that breakup occurred in the
December preceding the start of that year’s open-water season – i.e. a very early winter cessation of the ice season. Likewise there are sites
in all study areas where freeze-up dates were sufficiently late that they did not occur until late in the winter season – i.e. January or February
of the following year.

displaying cooling trends from 1946–1975 (Fig. 3). This ap-                variation higher than 1 standard deviation is required to po-
pears to be largely driven by an increase in the proportion                tentially move across a zero value and change the trend di-
of sites in Europe during that time period displaying either               rection – i.e. whilst the standard deviation is larger than most
cooling or significant cooling trends. A similar interruption              other time periods, the higher magnitude means that more of
is also observed in North America but is followed during                   this variability is in one trend direction (Table 3). A differ-
1961–1990 by a major increase in the number of warming                     ence is also observed for the evolution of lakes and rivers,
trends. Like trends for freeze-up and the number of annual                 where rivers appear to show a more consistent warming pat-
open-water days, the mean decadal change for all sites shows               tern for breakup, freeze-up, and the number of annual open-
warming trends develop and increase in magnitude by 1976–                  water days through time (Table 3).
2005, again with the caveat that the standard deviation is high
enough to switch the trend direction (Table 3). The limited                3.2    North America
number of Russian sites with breakup data show a decrease
through time in the proportion of cooling trends (Fig. 3).                 In North America, the only sites with consistent data are clus-
   For breakup, freeze-up, and annual open-water days there                tered around the Great Lakes. During 1931–1960, in the east,
is general pattern towards warming through time and mean                   earlier breakup dates dominate, and in the west, later breakup
values increase in the magnitude of change. This increase                  (Fig. 4a), with a number of sites being statistically significant
in magnitude is sufficient so that during 1976–2005 breakup                (Fig. 3). This variation explains the large standard deviation
was 2.81 d per decade earlier (σ = 2.18) and the number                    (σ = 2.56) of the mean trend towards a 0.36 d per decade
of annual open-water days increased by 5.83 per decade                     earlier breakup (Table 3). An east–west pattern is reversed
(σ = 4.08) for all sites. The standard deviation from these                in the 1946–1975 period, with later breakup more common
sites is lower than the mean magnitude of change, meaning                  in the east (Fig. 4d). Mean trends show breakup dates be-

The Cryosphere, 15, 2211–2234, 2021                                                              https://doi.org/10.5194/tc-15-2211-2021
Table 3. Breakdown of mean decadal trends for each time period where each value is the number of days per decade change. The trend directions and magnitudes were derived from
                                          the Mann–Kendall and Sen’s slope tests and provide a general overview of the prevalent patterns during each time period for each study area. The standard deviation between the sites
                                          in each category is shown in brackets. Negative values represent earlier breakup (warming trend), earlier freeze-up (cooling trend), and a reduced number of open-water days (cooling
                                          trend). Positive values indicate the opposite. Bold and italic text has been added to aid in the interpretation of whether the mean values support warming (bold) or cooling (italic) trends.
                                          Boxes with “X” indicate time periods where no data were available.

                                                                                                   Breakup                                            Freeze-up                                        Open water

https://doi.org/10.5194/tc-15-2211-2021
                                                                                      Lakes              Rivers              Total          Lakes         Rivers             Total            Lakes         Rivers             Total
                                           All sites          1931–1960      − 0.13 ( 1.70 )    − 0.60   ( 1.95 )   − 0.15 ( 1.72 )   −2.11 (3.41)    3.08 (3.06)   −1.82 (3.60)      −2.18 (4.05)     3.33 (2.48)    −1.92 (4.16)
                                                              1946–1975         1.54 (1.90)     − 0.09   ( 2.12 )      1.45 (1.95)    −0.59 (3.36)    0.98 (3.91)   −0.51 (3.41)      −1.91 (3.99)     1.23 (3.10)    −1.80 (4.00)
                                                              1961–1990      − 1.52 ( 1.83 )    − 1.98   ( 1.77 )   − 1.54 ( 1.83 )    0.22 (2.12)    0.07 (2.11)    0.21 (2.12)       1.94 (2.99)     1.46 (1.88)     1.92 (2.95)
                                                              1976–2005      − 2.86 ( 2.19 )    − 1.18   ( 1.26 )   − 2.81 ( 2.18 )    2.73 (2.96)    0.64 (1.36)    2.71 (2.96)       5.88 (4.06)     0.71 (0.24)     5.83 (4.08)
                                                              1931–2005      − 0.60 ( 0.47 )    − 0.23   ( 0.16 )   − 0.58 ( 0.46 )   −0.01 (1.02)    0.70 (0.70)    0.02 (1.02)       0.60 (1.04)     1.62 (0.00)     0.63 (1.04)
                                           North America      1931–1960      − 0.28 ( 2.52 )    − 1.09   ( 2.78 )   − 0.36 ( 2.56 )    0.05 (2.92)    2.71 (2.91)    0.85 (3.16)      −1.39 (4.99)     3.29 (0.89)    −0.29 (4.82)
                                                              1946–1975         1.58 (2.55)     − 1.05   ( 1.97 )      1.27 (2.63)    −0.17 (2.29)    1.22 (4.42)    0.23 (3.13)      −2.47 (4.52)     1.28 (2.94)    −1.57 (4.49)
                                                              1961–1990      − 3.11 ( 1.83 )    − 1.92   ( 1.95 )   − 2.98 ( 1.88 )   −0.24 (1.85)    0.04 (2.39)   −0.18 (1.97)       3.08 (3.22)     1.30 (2.06)     2.77 (3.12)
                                                              1976–2005      − 1.16 ( 1.39 )    − 0.56   ( 0.81 )   − 1.15 ( 1.38 )    3.61 (2.32)             X     3.61 (2.32)       4.15 (2.84)              X      4.15 (2.84)
                                                              1931–2005      − 0.66 ( 0.50 )                   X    − 0.66 ( 0.50 )    0.84 (0.78)             X     0.84 (0.78)       1.49 (1.12)              X      1.49 (1.12)
                                           Europe             1931–1960      − 0.10 ( 1.31 )    − 0.22 ( 0.64 )     − 0.10 ( 1.29 )   −2.31 (3.43)    3.52 (3.17)   −2.13 (3.56)      −2.24 (3.97)     3.38 (3.39)    −2.09 (4.06)
                                                              1946–1975         1.75 (1.31)        1.59 (1.06)         1.75 (1.31)    −0.78 (3.27)    0.34 (1.71)   −0.76 (3.25)      −2.28 (3.62)     1.08 (3.58)    −2.25 (3.64)
                                                              1961–1990      − 0.79 ( 1.25 )    − 2.17 ( 1.16 )     − 0.82 ( 1.25 )    0.34 (2.17)    0.18 (0.78)    0.33 (2.16)       1.81 (2.85)     1.99 (0.82)     1.81 (2.84)
                                                              1976–2005      − 3.77 ( 1.98 )    − 1.43 ( 1.31 )     − 3.70 ( 2.00 )    2.53 (3.06)    0.64 (1.36)    2.51 (3.05)       6.38 (4.20)     0.71 (0.24)     6.30 (4.22)
                                                              1931–2005      − 0.54 ( 0.40 )    − 0.23 ( 0.16 )     − 0.52 ( 0.40 )   −0.25 (0.95)    0.70 (0.70)   −0.20 (0.97)       0.35 (0.89)     1.62 (0.00)     0.39 (0.90)
                                           Russia             1931–1960         0.83 (0.79)                   X        0.83 (0.79)    −1.92 (2.10)             X    −1.92 (2.10)      −2.47 (3.16)               X    −2.47 (3.16)
                                                                                                                                                                                                                                          A. M. W. Newton and D. J. Mullan: Climate change and NH lake and river ice phenology

                                                              1946–1975      − 0.75 ( 2.15 )                  X     − 0.75 ( 2.15 )    0.69 (4.66)             X     0.69 (4.66)       1.63 (4.56)               X     1.63 (4.56)
                                                              1961–1990      − 0.83 ( 1.83 )                  X     − 0.83 ( 1.83 )   −0.03 (1.89)             X    −0.03 (1.89)       1.03 (3.16)               X     1.03 (3.16)
                                                              1976–2005      − 0.53 ( 0.00 )                  X     − 0.53 ( 0.00 )   −0.50 (0.00)             X    −0.50 (0.00)       0.56 (0.00)               X     0.56 (0.00)
                                                              1931–2005         0.00 (0.00)                   X        0.00 (0.00)     1.04 (0.00)             X     1.04 (0.00)       1.53 (0.00)               X     1.53 (0.00)

The Cryosphere, 15, 2211–2234, 2021
                                                                                                                                                                                                                                          2219
2220 A. M. W. Newton and D. J. Mullan: Climate change and NH lake and river ice phenology Figure 3. Summary charts showing generalised trends for all the sites contained within each of the 30-year time periods. The percentages are calculated as a proportion of the total number of sites for each time period (bold text – e.g. in the first panel, across all sites there are 273 sites with 1931–1960 breakup data). The trends are derived from the Mann–Kendall analysis for each site, where the direction and statistical significance (α < 0.1) are recorded as a warming, a cooling, or no trend. A warming trend for breakup or freeze-up dates is determined by a negative (earlier date) or positive (later date) trend, respectively. A cooling trend for breakup or freeze-up dates displays a positive (later date) or negative (earlier date) trend, respectively. For the number of annual open-water days a positive Mann–Kendall value indicates an increase. Sig. Warming/Cooling in the key indicates sites where that trend was statistically significant. came 1.27 d per decade (σ = 2.63) later during 1946–1975, tors, such as human modification of water courses (Déry et with the trend driven largely by lakes with later breakup dates al., 2005; Déry and Wood, 2005) or lake circulation patterns (Table 3), many of which are statistically significant (Fig. 3). (Bennington et al., 2010), might account for local-scale het- From 1961–1990, most sites display earlier breakup trends, erogeneity. From 1976–2005 sites are clustered around the with a mean change of 2.98 d per decade (σ = 1.88) (Ta- Great Lakes and demonstrate partial changes compared to ble 3). Nearly half of all sites display significant breakup the preceding time period (Fig. 4j). Whilst 72 % of sites trend trends (Figs. 3, 4g), many of which previously displayed towards earlier breakup (Fig. 3), in the east several sites now significant later breakup trends (Fig. 4d). Four sites show display low-magnitude earlier and later breakup trends. Ear- later breakup trends, of which one is geographically isolated lier breakup decadal change for lakes, at 1.16 (α = 1.39), and the others are surrounded by lakes with earlier breakup is double that for rivers, at 0.56 (α = 0.81) (Table 3). The trends, many of which are significant. This suggests local fac- The Cryosphere, 15, 2211–2234, 2021 https://doi.org/10.5194/tc-15-2211-2021
A. M. W. Newton and D. J. Mullan: Climate change and NH lake and river ice phenology                                          2221

standard deviation continues to show considerable variation          open-water days, with 26.3 % being significant (Fig. 3) and
around the mean.                                                     spread across North America (Fig. 4i). The mean magnitude
   Fewer sites with freeze-up data are available compared            of change shows the number of annual open-water days in-
to breakup (Table 2) and remain generally clustered around           creased by 2.77 d per decade (α = 3.12), with the changes
the Great Lakes (Fig. 4b). From 1931–1960 no clear geo-              for lakes being larger in magnitude than for rivers (Table 3).
graphical pattern exists, with 25 % of sites displaying sig-         Most sites with data for the number of annual open-water
nificant later freeze-up trends for rivers and lakes (Fig. 3).       days in the preceding time period show the trend direction
Mean decadal trends show freeze-up was 0.85 d per decade             changed or reduced in magnitude, even when the 1946–
later, but this is associated with a high standard deviation         1975 trend was a significant reduction in open-water days
(σ = 3.16) and a large difference in the mean trends for lakes       (Fig. 4f and i). Patterns from 1976–2005 reflect that most
and rivers (Table 3). During 1946–1975, spatial patterns re-         sites display earlier breakup and later freeze-up dates, ex-
main varied (Fig. 4e) and sites with significant later and           tending the length of the open-water season by 4.15 more
earlier freeze-up trends each account for 10.5 % of all sites        days per decade (α = 2.84) (Table 3, Fig. 4l). In total, 36.8 %
(Fig. 3). Significant sites are both rivers and lakes and unlike     of sites display significant trends towards more open-water
breakup do not appear to be clustered east of the Great Lakes.       days (Fig. 3), maintaining warming trends from the preced-
The mean trend for lakes remains low at 0.17 d per decade            ing time period but with less variability in the magnitude of
earlier (σ = 2.29), whilst rivers are comparably higher with         that change.
freeze-up occurring 1.22 d per decade (σ = 4.42) later (Ta-
ble 3). Freeze-up date changes during 1961–1990 show that            3.3   Europe
sites in the west more commonly trend towards earlier freeze-
up and in the east towards later breakup (Fig. 4h). Compared         In Europe, 1931–1960 breakup trends show a proclivity for
with the breakup trends for the same period and freeze-up            sites to display non-significant earlier breakup or no trend at
trends for the preceding period, the proportion of sites with        all (Fig. 3). Most sites trending towards earlier breakup dates
significant earlier (4.9 %) and later (3.3 %) freeze-up dates is     are at higher latitudes compared to those displaying later
smaller (Fig. 3). The mean decadal trend of 0.18 d per decade        breakup (Fig. 5a). The lack of observable trends is reflected
(α = 1.97) earlier freeze-up dates for lakes and rivers com-         by the low magnitude of the mean trend towards earlier
bined is weaker than observed for earlier breakup during the         breakup by 0.10 d per decade (α = 1.29) for lakes and rivers
same period (Table 3). From 1976–2005, freeze-up trends              (Table 3). In 1946–1975 most sites show later breakup dates
demonstrate a clear pattern, with no sites displaying earlier        by 1.75 d per decade (α = 1.31) (Table 3), with the only ob-
freeze-up trends (Fig. 4k) and 39 % of sites showing signifi-        servable spatial pattern being that of the 22.1 % of sites dis-
cant later freeze-up trends (Fig. 3). This is markedly different     playing significant later breakup trends (Fig. 3); most are lo-
to all other time periods where spatial patterns were much           cated in areas where earlier breakup was common in the pre-
more varied in the Great Lakes region (Fig. 4h). There are no        ceding time period (Fig. 5d). By 1961–1990 decadal breakup
river sites with freeze-up data for this time period (Table 2),      trends switched from predominantly later to earlier breakup.
and mean values for lake changes show that freeze-up was             Of the 261 sites, 53.6 % display earlier breakup, with a fur-
becoming later by 3.61 d per decade (α = 2.32) (Table 3).            ther 8.8 % being significant (Fig. 3), with a change towards
   Trends for annual open-water days during 1931–1960 are            earlier breakup dates by 0.82 d per decade (α = 1.25), but
broadly similar to those for freeze-up, with a comparable            the variability remains large enough that 1 standard deviation
number of sites showing more or fewer open-water days                of change is enough to switch the trend direction (Table 3).
(Fig. 4c). Of the 17 sites, 4 show significant trends (note that     Northern sites make up the majority with significant earlier
2 sites overlap in Fig. 4c), and this variability reflects the low   breakup trends for both lakes and rivers (Fig. 5g). There re-
mean value of 0.29 fewer annual open-water days per decade           mains spatial variability, with 12.6 % of sites showing later
(σ = 4.82) and is mostly associated with lakes (Table 3).            breakup trends. The magnitude of the trend towards earlier
From 1946–1975 the number of annual open-water days                  river breakup dates is almost 3 times that of lakes (Table 3).
closely matches breakup trends, with 20.7 % of sites display-        From 1976–2005 most sites display earlier breakup trends
ing significant trends towards a decrease (Fig. 3), all of which     (Fig. 5j), of which 72.3 % are significant (Fig. 3). During
are east of the Great Lakes (Fig. 4f). Reduced annual open-          this period the breakup date has become earlier by a mean of
water days are observed for lakes rather than for rivers, which      3.70 d per decade (α = 2.00), with the magnitude of change
display a mean increase (Table 3). Annual open-water days            experienced in lakes over double that for rivers (Table 3).
during 1961–1990 are similar to breakup patterns during the             During 1931–1960, a total of 45.2 % of sites display ear-
same period, including in western Canada where freeze-up             lier freeze-up, with a further 22.6 % being statistically sig-
dates were earlier (Fig. 4i). The low magnitude of freeze-           nificant (Figs. 3, 5b). Freeze-up decadal trends show lake
up trends compared to high-magnitude breakup trends in               freeze-up became earlier by 2.31 d per decade (α = 3.43)
the same area has a larger impact on the number of annual            (Table 3). The large standard deviation reflects highly vari-
open-water days. The majority of sites trend towards more            able trend magnitudes towards both later and earlier freeze-

https://doi.org/10.5194/tc-15-2211-2021                                                   The Cryosphere, 15, 2211–2234, 2021
2222                                A. M. W. Newton and D. J. Mullan: Climate change and NH lake and river ice phenology

Figure 4. Decadal trends for breakup (a, d, g, j), freeze-up (b, e, h, k), and the number of annual open-water days (c, f, i, l) in North America
for the four individual time periods. The trend directions and magnitudes were derived from the Mann–Kendall and Sen’s slope tests. The
triangles and circles indicate whether the trend was or was not statistically significant. Sites with a dot in the centre of the circle are river
sites. Thus, a red triangle symbol with a dot in the middle indicates a river site that has a statistically significant warming trend over that time
period. The blue and red tones on the scales are related to cooling and warming trends, respectively. Note that in some places the symbols
overlap.

up (Fig. 5b). The five river sites trend towards later freeze-up            trends. Compared to 1931–1960 there is a considerable drop
dates by 3.52 d per decade (α = 3.17). From 1946–1975, spa-                 in the number of sites displaying significant earlier freeze-
tial patterns in southern Finland (Fig. 5e), where many sites               up trends to 8.4 % (Fig. 3). Mean lake decadal trends show
previously displayed significant earlier freeze-up dates, there             earlier freeze-up reduced to 0.78 d per decade (α = 3.27) but
is now considerable variability, more so than for breakup                   with considerable variation (Table 3). Rivers continue to have
(Fig. 5d), with both earlier and later significant freeze-up                opposing trends but also experienced a reduction in trend

The Cryosphere, 15, 2211–2234, 2021                                                                https://doi.org/10.5194/tc-15-2211-2021
A. M. W. Newton and D. J. Mullan: Climate change and NH lake and river ice phenology                                           2223

magnitude. During 1961–1990 there is a clear increase in              3.4   Russia
sites displaying later freeze-up trends and a reduction in trend
magnitude for sites showing earlier freeze-up (Fig. 5h). Both
freeze-up and breakup trends in Sweden display a warm-                In Russia there are only a few sites across the four 30-
ing pattern, whilst in Finland they are generally opposed             year time periods with breakup, freeze-up, or open-water-day
(Fig. 5g, h). The decline in earlier freeze-up lake trends is         data, with the 1976–2005 time period only having one site at
now characterised by a later freeze-up of 0.34 d per decade           Lake Baikal (Table 2). The majority of the data are clustered
(α = 2.17) (Table 3). In the final time period the region is          in northwest Russia, with a number of individual sites spread
characterised by later freeze-up trends (Fig. 5k), which are          out across the Kazakhstan border region and around Lake
similar to breakup trends (Fig. 5j). Later freeze-up trends           Baikal in the east (Fig. 6). The lack of spatiotemporal con-
account for 52.9 % of sites, with another 21.5 % displaying           sistency makes it difficult to determine any prevailing trends.
significant later freeze-up. A small number of sites display          Broadly there is a reduction in the number of sites display-
significant earlier freeze-up trends, but these are out of syn-       ing later breakup dates through time (Fig. 3), as is also re-
chrony with the wider area (Fig. 5k). This time period is the         flected by the changes in mean breakup date from 0.83 d per
culmination of a gradual reduction in earlier freeze-up trend         decade (α = 0.79) later in 1931–1960 to 0.83 d per decade
magnitude for lakes during 1931–1960, before a switch to              (α = 1.83) earlier from 1961–1990 (Table 3), albeit with the
later freeze-up dates and then a magnitude increase in later          latter associated with more variability. For breakup trends, in
freeze-up dates to 2.51 d per decade (α = 3.05) (Table 3).            the northwest there are two sites with continuous data across
Through all four time periods rivers have displayed trends            the first three time periods (Fig. 6a, d, g), and these show a
towards later freeze-up dates (Table 3).                              gradual change from later to earlier breakup through time.
   Spatial patterns in the number of annual open-water days           The adjacent sites in this area also show a tendency towards
from 1931–1960 (Fig. 5c) are similar to those observed                earlier breakup dates during these time periods. The border
for freeze-up, with most sites displaying decreases (Fig. 3).         region sites generally display earlier breakup dates, many of
Across all sites a mean reduction of 2.09 d per decade (α =           which are statistically significant during the 1946–1975 time
4.06) is associated with considerable variation, whilst lakes         period. Around Lake Baikal there is considerable variation
and rivers show opposing trends (Table 3). During 1946–               between different sites, with no dominant trends, even for
1975 open-water days (Fig. 5f) remain broadly similar to              the one continuous site through all four 30-year time periods
freeze-up trend patterns for the same period (Fig. 5e), albeit        (Fig. 6j).
with local-scale changes that appear to be associated with               Between the four 30-year time periods, sites with freeze-
significant later breakup trends in southern Finland (Fig. 5d).       up data covering at least two time periods demonstrate
The proportion of sites showing fewer open-water days re-             considerably more variation than those with breakup data
mains broadly the same, as do mean trend values (Fig. 3,              (Fig. 6b, e, h). Between different time periods the freeze-
Table 3). The increased trend magnitude for river open-water          up dates for the same sites can move in opposing directions,
days is halved compared to the previous time period, but this         and in some cases, such as in the Kazakhstan border region,
reflects the fact that only two river sites have data. Spatial pat-   these freeze-up date changes have been significant. Long-
terns for open-water days during 1961–1990 (Fig. 5i) closely          term there is an apparent reduction in the number of sites dis-
resemble breakup (Fig. 5g), except for in southern Finland            playing earlier freeze-up trends (Fig. 3), but this is caveated
where earlier freeze-up trends (Fig. 5h) cause several sites to       by the low number of sites with data and the much larger
display fewer open-water days. Most sites show an increase            standard deviations associated with decadal trends (Table 3).
in open-water days (Fig. 3), with a mean increase of 1.81 d           Changes in the number of annual open-water days across
per decade (α = 2.84) (Table 3). From 1976–2005, trends in            Russia capture a slightly more consistent pattern compared
the number of annual open-water days are similar to breakup           to changes in breakup and freeze-up dates, but it remains
trends (Fig. 5l, j), with a near-uniform increase and 50.7 % of       spatially chaotic, with no dominant spatial patterns observ-
sites significant (Fig. 3). A minority of sites showing fewer         able (Fig. 6c, g, i). In all three regions, northwest Russia,
open-water days have breakup and freeze-up dates becoming             the Kazakhstan border region, and around Lake Baikal, there
earlier during the time period – i.e. earlier freeze-up trends        is a shift through time for most sites with continuous data
are strong enough to reduce the open-water season. Earlier            to display more annual open-water days per decade, a num-
breakup and later freeze-up trends lead to a mean increase in         ber of which are statistically significant (Fig. 3). However,
open-water days of 6.30 d per decade (α = 4.22) (Table 3),            these values are again associated with considerable variation
with the trend being considerably stronger for lakes than for         around what is generally a low-magnitude decadal mean (Ta-
rivers.                                                               ble 3). The one site with continuous data through all four time
                                                                      periods, Lake Baikal, shows a gradual switch from fewer an-
                                                                      nual water days during the first time period to no observable
                                                                      trend, before demonstrating more open-water days in the fi-
                                                                      nal two time periods, suggesting a gradual warming signal.

https://doi.org/10.5194/tc-15-2211-2021                                                    The Cryosphere, 15, 2211–2234, 2021
2224 A. M. W. Newton and D. J. Mullan: Climate change and NH lake and river ice phenology
Figure 5. Decadal trends for breakup (a, d, g, j), freeze-up (b, e, h, k), and the number of annual open-water days (c, f, i, l) in Europe for the
four individual time periods. The trend directions and magnitudes were derived from the Mann–Kendall and Sen’s slope tests. The triangles
and circles indicate whether the trend was or was not statistically significant. Sites with a dot in the centre of the circle are river sites. Thus, a
red triangle symbol with a dot in the middle indicates a river site that has a statistically significant warming trend over that time period. The
blue and red tones on the scales are related to cooling and warming trends, respectively. Note that in some places the symbols overlap.
3.5 Sites with continuous data – 1931–2005 earlier breakup dates. No dominant spatial patterns are ob-
served, with earlier breakup dates observed across the en-
Data covering the full 1931–2005 time period in North tire Great Lakes region, except for two sites displaying no
America are clustered around the Great Lakes region. Over trend (Fig. 7a). The extent of sites with freeze-up data lim-
this period mean breakup dates became earlier by 0.66 d its spatial analysis, but of the nine sites with data, 55.6 %
per decade (α = 0.50) (Table 3), with 66 % of sites display- show statistically significant later freeze-up dates (Fig. 7d),
ing earlier breakup trends and 29.5 % showing significant with freeze-up, on average, occurring 0.84 d per decade (α =
The Cryosphere, 15, 2211–2234, 2021 https://doi.org/10.5194/tc-15-2211-2021A. M. W. Newton and D. J. Mullan: Climate change and NH lake and river ice phenology 2225 Figure 6. Decadal trends for breakup (a, d, g, j), freeze-up (b, e, h, k), and the number of annual open-water days (c, f, i, l) in Russia for the four individual time periods. The trend directions and magnitudes were derived from the Mann–Kendall and Sen’s slope tests. The triangles and circles indicate whether the trend was or was not statistically significant. Sites with a dot in the centre of the circle are river sites. Thus, a red triangle symbol with a dot in the middle indicates a river site that has a statistically significant warming trend over that time period. The blue and red tones on the scales are related to cooling and warming trends, respectively. Note that in some places the symbols overlap. 0.78) later through time (Table 3). Of sites with both breakup posed onto a longer-term warming pattern, particularly the and freeze-up data (Fig. 7g), 42.9 % have a significant trend cooling trend towards later breakup dates from 1946–1975 towards more open-water days, with the mean being an extra (Fig. 4d, Table 3). Breakup dates, when viewed as a running 1.49 d per decade (α = 1.12) (Table 2). Residuals calculated 11-year annual mean (Fig. 7a), show a weak (R 2 = 0.25) from mean breakup and freeze-up dates, as well as annual trend towards earlier breakup, whilst freeze-up trends dis- open-water days, across all North American sites show how play a moderate trend (R 2 = 0.48) towards later freeze-up the 30-year time period trends (Fig. 4) appear to be superim- (Fig. 7a, d). Breakup and freeze-up trends combined show https://doi.org/10.5194/tc-15-2211-2021 The Cryosphere, 15, 2211–2234, 2021
2226                                A. M. W. Newton and D. J. Mullan: Climate change and NH lake and river ice phenology

Figure 7. The graphs show the annual residuals (grey) with an 11-year running mean (blue) for ice breakup (a–c), freeze-up (d–f), and
number of annual open-water days (g–i) across the three regions of study. The dashed red line shows the linear trend for the 11-year running
mean and is associated with the labelled R 2 values. The associated maps show the decadal trends for breakup (a–c), freeze-up (d–f), and the
number of annual open-water days (g–i). The trend directions and magnitudes were derived from the Mann–Kendall and Sen’s slope tests
for the full 1931–2005 time period. The triangles and circles indicate whether the trend was or was not statistically significant. Sites with a
dot in the centre of the circle are river sites. Thus, a red triangle symbol with a dot in the middle indicates a river site that has a statistically
significant warming trend from 1931–2005. The blue and red tones on the scales are related to cooling and warming trends, respectively.
Note that in some places the symbols overlap.

The Cryosphere, 15, 2211–2234, 2021                                                                https://doi.org/10.5194/tc-15-2211-2021
You can also read