CMS SPREADSHEET USER GUIDE (CMSUG) - UNITED STATES DEPARTMENT OF DEFENSE (DOD) ACQUISITION WORKFORCE DEMONSTRATION PROJECT (ACQDEMO) ...
←
→
Page content transcription
If your browser does not render page correctly, please read the page content below
United States Department of Defense (DoD)

             Acquisition Workforce Demonstration Project (AcqDemo)

       Contribution-based Compensation and Appraisal System Software
                               (CAS2Net)

                            Subcontract Number HQ003415A0020
                    Task Order HQ003420F0792 – AcqDemo Analytics

               CMS SPREADSHEET USER GUIDE (CMSUG)
                                             Version V1.0
                                          Updated August 2021

                                              Prepared for:

                                   United States Department of Defense (DoD)
                         Acquisition Workforce Demonstration Project (AcqDemo)

                                              Prepared by:
                                         Red Gate Group/GDIT

 The views, opinions, and findings contained in this document are those of the authors and should not be
construed as an official Department of Defense position, policy, or decision unless so designated by other
                                        official documentation.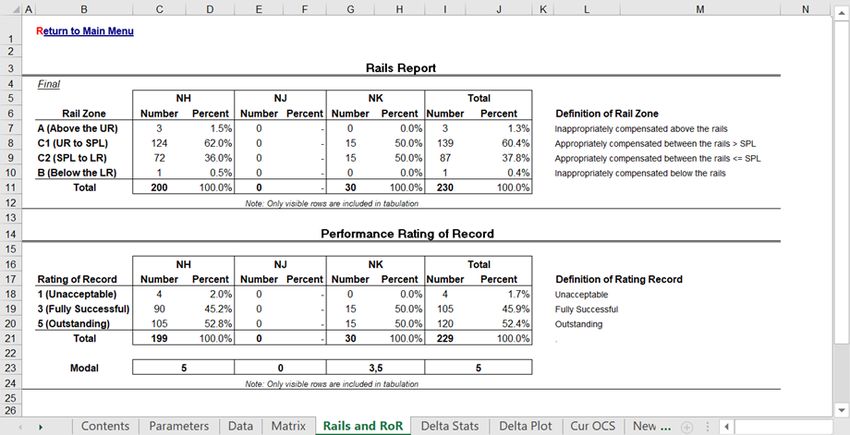
AcqDemo Contribution Management System (CMS)
                           Spreadsheet (2021) Description

                                                             August 2021
The Contribution Management System (CMS) spreadsheet is a Microsoft Excel macro-enabled
workbook called CMS 2021 v1.0.xlsm consisting of 10 tabbed worksheets. The spreadsheet is
updated each year, available 1 October and, if necessary, additional versions are released due to
administrative revisions.

The workbook may be downloaded from the Pay Pool Notices section of CAS2Net located at
https://cas2net.army.mil. The workbook is initially blank and must be populated with data by
importing a file. CAS2Net creates the import files. Any time a file is imported into the
workbook, all existing data are cleared and replaced with data from the imported file. The 10
tabbed worksheets are described in this document in the order in which they appear along the
bottom of the workbook.

Contents
Changes for 2021 ........................................................................................................................ 2
Contents .................................................................................................................................... 3
   Pay Pool Data.......................................................................................................................... 3
   Parameters ............................................................................................................................. 4
   Summary Reports .................................................................................................................... 4
   Scatter Plots of OCS Score by Salary ............................................................................................ 4
   Part I of Appraisal Forms ........................................................................................................... 4
Parameters................................................................................................................................. 6
Data ........................................................................................................................................ 10
Data Sheet Column Descriptions .................................................................................................. 14
Matrix...................................................................................................................................... 26
Rails and RoR Report.................................................................................................................. 27
Delta Statistics .......................................................................................................................... 28
Delta Plots................................................................................................................................ 30
Current OCS Scatter Plot............................................................................................................. 31
New OCS Scatter Plot ................................................................................................................. 33
Summary ................................................................................................................................. 34
   Part I of the Appraisal Form ..................................................................................................... 34
Procedure for Using the Workbook .............................................................................................. 36

                                                                        1
Changes for 2021

Date of
            Sheet                     Topic                              Remarks
Change
                     Added capability to hide/show
Fall 2021            sections for ACDP, Supervisor
          Parameters
                     Differential and Time off Award via
                     check boxes
                     Added capability for Pay Pool             Values are 0%, 50% and
Fall 2021    Data    Manager to change/approve TOA             100%
                     requested by employee.
                     Added three rows to the blue open         All views and view names are
Fall 2021    Data    rows to allow three new views.            editable

                       Removed the Copy to Opt Sig button. Also remove the Part 1:
Fall 2021     Data                                         Optional Signature column.
                       Added a column that allows the pay      Valid values are in the 0-99%
                       pool to split the CRI money received    range and represents the
Fall 2021     Data     between salary increase and award.      proportion of CRI that should
                       The remainder will flow to the award    be allowed towards the
                       provided rollover flag is set to 1.     salary increase.
                       Added a column in the Locality Pay
Fall 2021     Data     section that shows the New Salary
                       plus the Supervisor Differential.
Fall 2021     Data     Removed the CIP trigger column.
                       Hide career path sections for the
Fall 2021    Matrix    career paths that do not exist in the
                       CMS.
                       Added ability to generate part one’s
Fall 2021   Part One   by supervisor and contain those files
                       in a zip file

                                         2
Contents
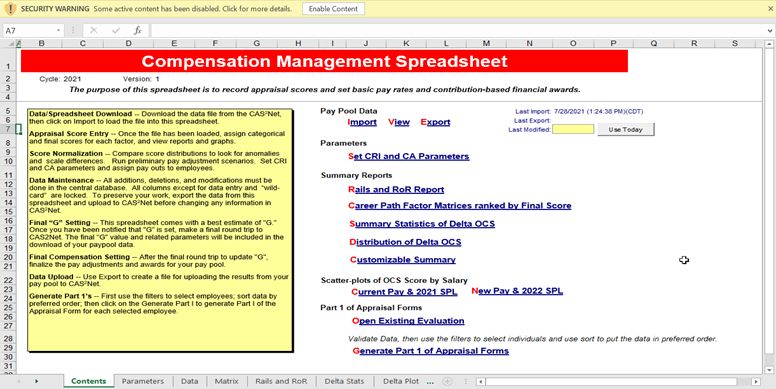
The “Contents” worksheet, shown below, is the first sheet you will see after you open the
workbook and activate the macros. It might be necessary to click the white Enable Content button
to enable the macros. It provides a brief description of the workbook, its purpose, and contents.
The right side of the sheet helps you import and export files, navigate around the workbook, and
generate Part I of the Appraisal Forms. The cycle year is displayed in the upper left corner just
below the red title bar. The date and time of the last import and export of files into and out of the
workbook are shown in the upper right corner.
Pay Pool Data
Clicking on the “Import” link, or on the “Import” button on the custom toolbar (Add-Ins) located
just below the normal Excel toolbar, will allow you to import a data file into the workbook.
You will be prompted to select the data file you want to import from the same file folder as the
CMS. Once you have selected the file, it will take the workbook up to several minutes (depending
on the size of your file) to import the data and run the many macros required to format it properly.
You can only import files that have been specifically formatted for import into the workbook by
CAS2Net. These files will automatically have been named ppXXXX_to_CMS.csv, where XXXX
is your pay pool number. See the CAS2Net User Guide for more information on creating an import
file.
Clicking on the “View” link will take you to the tabbed worksheet called “Data” that is described
later in this document. This is where you will do all appraisal score entry and compensation
adjustments.
At the end of the pay pool process, clicking on the “Export” link (or the “Export” button on the
Add-Ins toolbar) will allow you to export a data file from the workbook. You will be prompted to
3
confirm the export and to select the location where you want the exported file saved. The
 workbook will automatically assign the file name ppXXXX_to_master.csv. This file is specifically
formatted to upload CMS data to CAS2Net. It is also formatted for import into the Pay Pool
Analysis Tool (PAT).

Parameters

Clicking on the “Set CRI and CA Parameters” link takes you to the tabbed worksheet called
“Parameters”, which is described later in this document.

Summary Reports

Clicking on the “Rails and RoR Report” link takes you to the tabbed worksheet called “Rails and
RoR” that is described later in this document.

Clicking on the “Career Path Factor Matrices ranked by Final Score” link takes you to the tabbed
worksheet called “Matrix” that is described later in this document.

Clicking on the “Summary Statistics of Delta OCS” link takes you to the tabbed worksheet called
“Delta Stats” that is described later in this document.

Clicking on the “Distribution of Delta OCS” link takes you to the tabbed worksheet called “Delta
Plot” that is described later in this document.

Clicking on the “Customizable Summary” link takes you to the tabbed worksheet called
“Summary” that is described later in this document.

Scatter Plots of OCS Score by Salary

Clicking on the “Current Pay & 2021 SPL” link takes you to the tabbed worksheet called “Cur
OCS” that is described later in this document.

Clicking on the “New Pay & 2022 SPL” link takes you to the tabbed worksheet called “New OCS”
that is described later in this document.

Part I of Appraisal Forms

Clicking on the “Open Existing Evaluation” link allows you to open a file of appraisal forms that
you previously created and saved. You will be prompted to specify the file you wish to open. You
can switch back and forth between the forms and the main workbook by using the “Windows”
drop-down menu at the top of the Excel tool bar.

Clicking on the “Generate Part I of Appraisal Forms” link will allow you to create a file of appraisal
forms, which are described later in this document. Before generating the forms, you can use the
filters on the “Data” worksheet to select the set of employees for whom you want forms. You can
also use the sort button on the “Data” worksheet to place the employees in the order you want the

                                                 4
forms generated. You will be asked to specify where you want the file saved. A generic file name
is assigned, but you can change it prior to saving.
Forms are generated in batches of up to 200. The first batch is named Form_1.xls, the second
batch is named Form_201.xls, etc. Depending on how many employees you have selected, it may
take several minutes for Excel to generate the forms. If you receive an “Out of Memory” error
during the generation of the forms, close any other applications that are open on your computer
and try again. Once the forms are generated, you will be asked if you want to print them
immediately. If you say “NO” you will be able to view the forms and print them individually or
as a group. The first worksheet in the forms workbook is a list of the employees and the tab number
at which their form is located. You can switch back and forth between the forms and the main
workbook by using the “Windows” drop-down menu at the top of the Excel tool bar.
There is a new option to group the forms by supervisor. If this option is selected the visible rows
on the Data sheet will be grouped into individual .xlsx files, each file representing a supervisor.
Those .xlsx files will be contained in a zip file that is saved in the same folder as the CMS.
5Parameters
This worksheet is where the pay pool manager sets the parameters that define the pay adjustment
scenario for the pay pool. The first three and the last seven lines in the table (in white) are for
information only and are not adjustable by the pay pool manager.
CRI Funding % - The pay pool’s overall CRI budget, expressed as a percent of total annual base
pay in the pay pool as of 30 September 2021. This value must be at least 2.0 percent, which is also
the default value. The two cells to the right of the percent show the dollar amount of the resulting
CRI budget, and the enhanced CRI budget including unspent GPI money. For retained pay
employees, the pay band maximum is used in the sum of the base pay.
Check box if this is your organization first year in AcqDemo – If this box is checked the
maximum CRI% can be changed from 2.26% to 2.4% (and the minimum CA award percentage
the first year can be changed from 1.0% to 1.3%). The CMS lets you enter the values you choose,
within the approved ranges.
CRI Set-Aside - The percent of the pay pool’s overall CRI budget that is set aside for discretionary
allocation by the pay pool manager. The default is 0.0 percent. You have the option of entering
this value as a percent or dollar amount. The default algorithm built into the spreadsheet allocates
the remaining budget.
6Award Funding % - The pay pool’s overall CA budget, expressed as a percent of total annual adjusted base pay in the pay pool as of 30 September 2021. The minimum value is 1% an d the maximum is awaiting DoD guidance , which is expected later this fall, The value specified here is automatically multiplied by Award Spent in CMS input value (see next paragraph) The remaining percent of the award funding is reserved for non-CCAS awards throughout the year. The cell to the right of the percent shows the dollar amount of the resulting CMS CA budget. For retained pay employees, the adjusted base pay band maximum is used in the sum of the base pay. Award Spent in CMS (
2. Put into CA Remainder - Puts funds into the CA remainder for discretionary spending
      3. Don’t spend in CMS - Saves the funds for spending outside the CMS later in the year

TOA Remainder - Employees may be given the option to elect to have some portion (0%, 50%
or 100%) of their contribution award converted to a Time-Off Award. At the pay pool level there
is a choice on what to do with the remaining funds resulting from this conversion.

      1. Spend in the CMS - Puts funds into the CA remainder for discretionary spending
      2. Don’t spend in the CMS - Saves the funds for spending outside the CMS later in the
         year

Use Control Points – This checkbox is checked by default. Unchecking it will clear any control
points and hide the related columns on the Data worksheet. Checking it back will make the
columns visible again, but the original values will not be recovered.

Show ACDP – This checkbox is checked by default. Unchecking it will hide the ACDP columns
on the Data worksheet.

Show Supervisor Differential – This checkbox is checked by default. Unchecking it will hide the
Supervisor Differential columns on the Data worksheet.

Use TOA– This checkbox is checked by default. Unchecking it will clear any TOA data and hide
the related columns on the Data worksheet. Checking it back will make the columns visible again
but the original TOA values will not be recovered.

Award Spending Summary Per the requirements of the 2017 Federal Register, a maximum of
90% of an organization's award money may be spent on CA. In 2021, the CMS allows the pay
pool to change the default 90% value for a lower percentage (as discussed above). This allows
the pay pool to reserve a larger amount of funding to be spent outside the CCAS process for spot
awards and special act awards.

In order to know how much is available to the pay pool to spend later, a summary is provided similar
to the figure below:

This pay pool started with $40,813 Full Award Funds. They chose to spend $30,610 in the CMS
and reserve $10,203 for later spending. Within the CMS, they actually only spent $28,034, so this
left them an additional $2,576 that could be added to their future spending reserve. So, now for
2022, they have a total of $12,779 (or 31.1% of the original total funding) to use outside the CMS.
                                                 8
Note that the parameter settings on this worksheet are included in the export file and uploaded
to CAS2Net. The parameters are stored in CAS2Net and are downloaded and imported back
to the spreadsheet. Therefore, even if you import the file into an “empty” workbook, it will start
off with the parameters you last uploaded to CAS2Net.
9Data
This is the main worksheet in the workbook. It contains all of the data and is where individua l
contribution factor scores and compensation adjustments are recorded. The worksheet contains
several visible columns that are each described in the table at the end of this section.
The upper left corner of the worksheet contains links to the Contents (“Return to Main Menu”)
and Parameters (“Edit Parameters”) tabs, and to the various sections of this worksheet used to
enter scores, set GPI, set CRI, and set awards (CA) if applicable. The link “Set View” presents
a form that allows setting the views listed in column B of the blue rows below the employee data
rows. You can quickly return to the upper left corner of this or any other worksheet by holding
down the key and pressing . From the “Add-Ins” tab, fifteen buttons on the custom
toolbar at the top of this worksheet perform the following functions:
Import – Use import to load a data file into the workbook.
Export – Use export to create a data file for uploading the results to CAS2Net.
Hide Column – The user may hide columns from view by selecting any cell in the columns to be
hidden and then clicking on this button. Single columns are selected by clicking on any cell in the
10column. Multiple columns are selected by holding down the key while clicking on any cells
in the columns. A range of columns is selected by clicking and dragging across any row of cells
in the range of columns.
Unhide Column – Clicking this button will unhide columns you have just hidden as long as you
have not moved the cursor. You can also unhide a specific column or range of columns by
highlighting cells in the columns on either side of the hidden column or range of columns, and
then clicking this button.
Unhide All Columns – This button restores to view hidden columns.
Hide Row – The user may hide rows from view by selecting any cell in the row or rows to be
hidden and then clicking on this button. A single row is selected by clicking on any cell in the
row. Multiple rows are selected by holding down the key while clicking on any cells in the
rows. A range of rows is selected by clicking and dragging up or down any column of cells.
Unhide Row – Clicking this button will unhide rows you have just hidden as long as you have not
moved the cursor. You can also unhide a specific row or range of rows by highlighting cells in
the rows on either side of the hidden rows or range of rows, and then clicking this button.
Unhide All Rows – This button restores to view all hidden rows.
Each column heading contains a filter arrow for the column. Clicking on the filter arrow brings
up a list of all of the values in the column, plus the following other choices: All, Top 10, Custom,
Blanks, and Non-Blanks. The user can limit which rows are displayed by filtering on specific
values in one or more columns. For example, the display could be limited to only NH-4 employees
by filtering on “NH” in column K and “4” in column L. signifies a filter is active. A filter
may be de-activated by selecting “All” under the filter choices. Blanks and Non-Blanks may also
be used for filtering. For example, to identify employees who do not yet have numerical scores
on a particular factor, select “Blanks” in the filter for the factor score column. The “Top 10”
choice displays the ten highest values in a column – it can only be used with numerical data.
The “Custom” choice allows the user to design more complex filter criteria.
Clear All Filters – This button clears all filters you have set, including filters on worksheets other
than the one you are currently on. You cannot import data into the workbook with filters set,
so any time you click the “Import” link on the Contents sheet all filters are automatically
cleared.
Sort – Allows the user to sort the rows in the worksheet by any combination of up to three columns.
Sorts may be in either ascending or descending order. The sorts are specified using the standard
Excel sort function.
Output Charts – Brings up a user form that allows output of any/all charts in the CMS spreadsheet
either into Excel or PowerPoint format. This is the safest way to output charts from the CMS
spreadsheet, as employee’s data is not included with the chart. Charts are copied/pasted as images
not as Excel objects.
11Validate (next row) – Checks the internal consistency of data entered in the worksheet and circles
inconsistent entries in red. For example, a numerical factor score that is outside the allowable
range for the corresponding categorical score would be circled. Also, a discretionary GPI value
that exceeds the maximum allowable amount would be circled. A red flag appears at the top of
each column that contains a red circle to help you quickly locate the circles. You cannot run
validation while rows or columns are hidden or filters are set – if you do, you will get a warning
message reminding you to unhide all columns and rows and clear all filters before running the
validation macro.
Clear Circles – After clicking on the “Validate” button and correcting any highlighted
inconsistencies, this button removes all red circles. You can also click on the Validate button again
to clear the circles and keep any you have missed fixing.
Highlight – This button allows you to change the background color of any selected cell or range
of cells. To remove the highlighting, select the cell or range of cells again, click the highlig ht
button, and choose the white background.
Column Widths – Clicking this button will bring up a form that allows changing the column width
of the eight Wildcard column.
Across the top of the spreadsheet are various totals to assist users in understanding how the
worksheet is allocating the GPI, CRI, and CA budgets. Each total is clearly labeled.
Also, until all employees in the workbook have valid OCS scores, the following warning appears
twice above the pay adjustment section of the Data worksheet.
Warning: Pay adjustments are incorrect because some scores are missing!
Once all employees have valid scores, the warning disappears. This is to prevent pay pool
managers from thinking their pay adjustments are final while scores are still missing. Even one
missing factor score invalidates the pay adjustments for ALL employees in the pay pool.
There are rows, which are below all of the data records, provide cells in which the user can enter
formulas to compute column statistics (sums, means, counts, etc.). If you want the formulas to
be re-applied each time you import data into the spreadsheet, you must include in the formula’s
range the row immediately above and below the data range. In other words, if you have 15 records
in your spreadsheet, the first record is in row 11 and the last record is in row 25. If you want to
compute the average CY 2021 base pay, you would enter the following formula in cell N28:
=AVERAGE(N10:N26). Now, each time you import a file into the workbook, this formula will be
applied to the data in column N, no matter how many records are included in the import. If you only
include the data rows in the formula range (N11:N25 in the example), the formula will return a
reference error after each import. The formulas in the open rows are not included in the import
and export routines.
12The eight light blue rows can be used to hide columns to establish “Views” of the columns on the
Data sheet. There are seven preset views starting on the second row. Clicking the “Set
View” link at the top left of the Data sheet will bring up a form that has a list box
allowing selection of the available views. Entering an ‘X’ in the first row (View One) will
hide columns when the “Hide Columns” button is clicked on the add-ins tool bar.
13Data Sheet Column Descriptions
Sources: 1 = Import file (locked in spreadsheet, can be changed in CAS2Net)
2 = Computed by spreadsheet (locked)
3 = User entry (shaded below)
Col Source Description
A 1 Employee's last name
B 1 Employee's first name
C 1 Employee's middle initial
D 1 Employee's suffix (e.g., Jr, II)
E 1 Employee's CAS2Net ID number
F 1 Employee's Pay pool number
G 1 Employee's office symbol
H 3 First open (wildcard) column for pay pool use. Values entered or computed in
this column will be saved in any export back to CAS2Net, and will be
returned to this worksheet in subsequent imports. However, formulas entered
in this column will not be preserved through subsequent export-import cycles
unless the formula is also entered in the yellow cell immediately below
the wide gray line after the last person's record. These cells will be
uploaded to CAS2Net and included in subsequent imports into the CMS. You
can change the column heading by clicking in the cell immediately above the
heading, using the down arrow to enter the cell, and changing the heading in
the formula bar.
I 1 Employee's presumptive status (0 = none, 1 = due to time, compute OCS
from SPL and current pay, 2 = due to circumstances, compute OCS from
SPL and current pay and RoR of 3, 3 = due to circumstances, recertify
previous OCS) and RoR, 4 = due to prolonged absence, compute OCS from
SPL) and RoR of 3
J 1 Retained pay (0 = no, 1 = yes, no CRI, eligible for CA, GPI = half the
dollar increase in maximum pay for the employee's broadband and career
K 1 Career path (NH = Business Management and Technical Management
Professional, NJ = Technical Management Support, NK =
Administrative Support)
L 1 Broadband level (1, 2, 3, or 4)
M 1 Occupational series
N 1 CY 2021 annual basic pay rate
O 1 “Yes” if employee is on a Ratable Temporary Promotion
P 1 Locality pay area code
Q 2 Locality rate
R 2 Base pay equal to column O, except for retained pay employees it will equal
the pay band maximum. Used to calculate the CRI funding pot.
S 2 Adjusted base pay that is used to calculate Award Funding Limit on
the Parameters sheet.
T 1 OCS from the previous cycle
U 1 Rating of Record from the previous cycle
14Col Source Description
V 1 Start date – the date the employee first entered AcqDemo. This date does
NOT change when employees move from one AcqDemo pay pool to
W 1 CA Proration. If present, this value prorates the Contribution Award (CA)
calculated from the algorithm for the individual employee.
X 3 Override the default CRI algorithm (0 = no, 1 = yes). Used to identify
employees leaving the demonstration or being promoted after closeout of the
appraisal period so they do not receive default CRI. They still receive GPI and
are eligible for discretionary CRI.
Y 3 Override the default CA algorithm (0 = no, 1 = yes). Used to identify
employees leaving the demonstration or being promoted after closeout of the
appraisal period so they do not receive default CA. They still receive GPI and
are eligible for discretionary CA.
Z 3 For employees who hit a pay cap, a value of 0 will not carryover any money
to an award, a value of 1 will carryover CRI to an award. A value of 2 will
rollover any CRI money to an award regardless of pay caps
AA 3 Name of the employee's first level supervisor
AB 1 Sub-Panel meeting identifier. This can be the name of the manager who will
chair the managers meeting at which the employee's contribution scores will
be assigned, or it could be an organization code or other identifier for a
group of employees. CAS2Net can export separate files for each unique
identifier in this column.
AC 1 Name of the employee's pay pool manager. This name will appear on Part I of
the CMS Salary Appraisal Form given to the employee.
AD 3 Text that will appear in the "Remarks" block on Part I of the CMS Salary
Appraisal Form given to the employee. Limited to approximately 950
characters.
AE 1 Marks the start of the appraisal score section of the spreadsheet
AF 3 Categorical score for contribution factor "Job Achievement and/or
Innovation". Categories are selected from a drop down list by first
clicking in the cell and then clicking on the down arrow. Only
categories appropriate to the employee's career path are displayed. If
the import file contains this score, it will appear in the spreadsheet.
Once categorical scores are selected, do not use the delete key to
remove them because this disables the corresponding numerical score
drop down list. If you want to remove a categorical score, select the
first (blank) entry on the drop down list.
15Col Source Description
AG 3 Categorical score for contribution factor "Communication and/or Teamwork".
Categories are selected from a drop down list by first clicking in the cell and
then clicking on the down arrow. Only categories appropriate to the
employee's career path are displayed. If the import file contains this score, it
will appear in the spreadsheet. Once categorical scores are selected, do not use
the delete key to remove them because this disables the corresponding
numerical score drop down list. If you want to remove a categorical score,
select the first (blank) entry on the drop down list.
AH 3 Categorical score for contribution factor "Mission Support". Categories are
selected from a drop down list by first clicking in the cell and then clicking on
the down arrow. Only categories appropriate to the employee's career path are
displayed. If the import file contains this score, it will appear in the
spreadsheet. Once categorical scores are selected, do not use the delete key to
remove them because this disables the corresponding numerical score drop
down list. If you want to remove a categorical score, select the first (blank)
entry on the drop down list.
AI 3 Final numerical score for contribution factor "Job Achievement and/or
Innovation". The numerical score is selected from a drop down list by first
clicking in the cell and then clicking on the down arrow; only numbers
appropriate to the category are displayed. If no categorical score was entered,
the numerical drop down list will be blank. A categorical score is required
first. If the import file contains this score, it will appear in the spreadsheet.
AJ 3 Final numerical score for contribution factor "Communication and/or
Teamwork". If a categorical score for this factor was entered, the numerical
score is selected from a drop down list by first clicking in the cell and then
clicking on the down arrow; only numbers appropriate to the category are
displayed. If no categorical score was entered, the numerical drop down list
will be blank. A categorical score is required first. If the import file contains
this score, it will appear in the spreadsheet.
AK 3 Final numerical score for contribution factor "Mission Support". If a
categorical score for this factor was entered, the numerical score is selected
from a drop down list by first clicking in the cell and then clicking on the
down arrow; only numbers appropriate to the category are displayed. If no
categorical score was entered, the numerical drop down list will be blank. A
categorical score is required first. If the import file contains this score, it will
appear in the spreadsheet.
AL 3 Performance Appraisal Quality Levels score for contribution factor "Job
Achievement and/or Innovation ". PAQL scores are selected from a drop-
down list with values of 1, 3 and 5. Cells for employees with a presumptive
status other than zero are locked.
AM 3 Performance Appraisal Quality Levels score for contribution factor
"Communication and/or Teamwork ". PAQL scores are selected from a drop-
down list with values of 1, 3 and 5. Cells for employees with a presumptive
status other than zero are locked.
AN 3 Performance Appraisal Quality Levels score for contribution factor Mission
16Col Source Description
Support ". PAQL scores are selected from a drop-down list with values of 1, 3
and 5. Cells for employees with a presumptive status other than zero are
locked.
AR 3 Second open (wildcard) column for pay pool use. Values entered or computed
in this column will be saved in any export back to the Oracle application, and
will be returned to this worksheet in subsequent imports. However, formulas
entered in this column will not be preserved through subsequent export-import
cycles unless the formula is also entered in the yellow cell immediately
below the wide gray line after the last person's record. These cells will be
uploaded to CAS2Net and included in imports into the CMS. You can change
the column heading by clicking in the cell immediately above the heading,
using the down arrow to enter the cell, and changing the heading in the
formula bar.
AS 3 Third open (wildcard) column for pay pool use. Values entered or computed
in this column will be saved in any export back to the Oracle application, and
will be returned to this worksheet in subsequent imports. However, formulas
entered in this column will not be preserved through subsequent export-
import cycles unless the formula is also entered in the yellow cell
immediately below the wide gray line after the last person's record.
These cells will be uploaded to CAS2Net and included in subsequent imports
into the CMS. You can change the column heading by clicking in the cell
immediately above the heading, using the down arrow to enter the cell, and
changing the heading in the formula bar.
AT 2 Expected OCS, computed from CY2021 basic pay and the formula for the
Standard Pay Line (SPL).
AU 2 2021 Expected OCS Range, computed from CY2021 basic pay and the formula
for the upper and lower rails.
AV 2 2021 OCS, computed as the weighted average of the 3 numerical factor scores
for non-presumptive employees. If any of the final numerical factor scores are
blank, this field will be blank. For presumptive status = 1, 2, or 4, 2021 OCS
is
LN(Base Pay / GS - 1step 1p ay 2020)
Calculated as Expected OCS =
LN(1.0200429)*
Presumptive status = 3, last year's score is recertified.
* This number can vary in the last decimal place depending on the GS pay tables.
AW 2 Delta OCS, computed as the difference between Expected OCS (column AT
and 2021 OCS (column AV).
AX 2 Raw average rating, computed as the average of the PAQL ratings
(column AL through AN).
AY 2 Rating of record, values are, 1 – Unacceptable, 3 – Fully Successful and
5 – Outstanding and are derived from the raw average rating (column
AZ 2 A ) upper rail pay, computed from the employee's OCS and the formula for
Actual
the upper rail. If OCS is blank, this field will be blank.
17Col Source Description
BA 2 Actual lower rail pay, computed from the employee's OCS and the formula for
the lower rail. If OCS is blank, this field will be blank.
BB 2 CRI target pay computed from OCS and the formula for the SPL (if Beta 1 =
0), the upper rail (if Beta 1 = 1), or the lower rail (if Beta 1 = -1).
BC 2 CA target pay computed from OCS and the formula for the upper rail (if Beta 2
= 1), 2% above the SPL (if Beta 2=2%), 1% above the SPL (if Beta 2=1%),
SPL (if Beta 2 = 0), the, or the lower rail (if Beta 2 = -1).
BD 2 Rail position based on final numerical OCS and current basic pay (A =
above the upper rail, B = below the lower rail, C1 = above the SPL but
below the upper rail, C2 = on or below the SPL and on or above the lower
rail)
BF 2 CRI Delta Y = CRI target pay (col BB minus current base pay (col N)). This
is the dollar amount by which the employee is under or over compensated
for use in adjusting base pay increase.
BG 2 CA Delta Y = CA target pay (col BC minus current base pay (col N)). This is
the dollar amount by which the employee is under or over compensated for
use in assigning awards.
BH 2 CRI Positive Delta Y = Maximum of CRI DeltaY (col BF) and zero. Sets all
negative CRI Delta Y values to zero for later computations.
BI 2 CA Positive Delta Y = Maximum of CA DeltaY (col BG) and zero. Sets all
negative CA Delta Y values to zero for later computations.
BJ 2 CY2022 maximum base pay for the employee's broadband and career path.
Based on Table 4 in the AcqDemo Federal Register, updated to reflect the GS
pay table for CY2022.
BK 2 Marks the start of the GPI section of the spreadsheet
BL 2 GPI Pot = employee's current base pay (col N) times the GPI % from the
parameter worksheet capped at band max. For employees who are on retained
pay, this value is one-half or 50% of the dollar increase in maximum
adjusted base pay for the employee's broadband and career path and locality
pay area.
BM 2 Mandatory GPI = GPI % from the parameter panel for all employees in zones
B and C who are not on retained pay, = blank for all employees in zone A
who are not on retained pay. For employees who are on retained pay,
regardless of rail position, Mandatory GPI = (one half the dollar increase in
maximum pay for the employee's broadband and career path and locality pay
area) divided by the employee's current basic pay.
For those on retained pay, column BM shows “Ret Rule”
BN 2 Max discretionary GPI Amount = GPI pot (col BL) for all employees with a
blank in column BM, = $0 for everyone else. This is the maximum amount
pay pool managers may give employees who are above the upper rail. An
employee that is retained rate and falls in Zone A will automatically receive
their 50% GPl, but this discretionary amount will be negative thereby
signaling the GPl may be reduced all the way to $0.
BO 2 Max discretionary GPI Percent = Max discretionary GPI Amount divided by
current base pay (col N), except for retained pay employees.
18Col Source Description
BP 2 Discretionary GPI Amount = for cells highlighted in yellow only, the pay
pool manager may enter amounts up to the value in column BM. Amounts
must be entered as whole dollars only – if the amounts are computed in a
wildcard column and then copied and pasted into this column, they must be
rounded to whole dollars before being copied. This column is orange when
a negative discretionary amount is allowed to reduce the retained employees
receipt of GPI when in the A Zone.
BQ 3 Discretionary GPI Percent = Discretionary GPI Amount divided by current
base pay (col N).
BR 2 G$ = Current base pay (col N) times (Mandatory GPI% (col BM) plus
Discretionary GPI% (col BO)). This is the total GPI each employee will receive
starting in January 2022.
BS 3 Fourth open (wildcard) column for pay pool use. Values entered or computed
in this column will be saved in any export back to the Oracle application, and
will be returned to this worksheet in subsequent imports. However, formulas
entered in this column will not be preserved through subsequent export-import
cycles unless the formula is also entered in the yellow cell immediately
below the wide gray line after the last person's record. These cells will be
uploaded to CAS2Net and included in subsequent imports into the CMS. You
can change the column heading by clicking in the cell immediately above the
heading, using the down arrow to enter the cell, and changing the heading in
the formula bar.
BT 2 Calculated sum of the 2021 Base Pay (col N) and the Final GPI amount (col
BR)
BU 2 Marks the start of the CRI section of the spreadsheet.
BV 2 Default CRI computed by the Alpha1*Delta Y algorithm and
parameters specified on the parameter worksheet. See the end of this
table for an explanation of the algorithm.
BW 3 Discretionary CRI input by the pay pool manager. Only yellow cells are
eligible for input. The cell at the top of the column shows the available balance
- it is shaded green as long as the balance is positive, but turns red when the
balance becomes negative. Amounts must be entered as whole dollars only – if
the amounts are computed in a wildcard column and then copied and pasted
into this column, they must be rounded to whole dollars before being copied.
Note that even if you specify zero discretionary set-aside on the parameter
worksheet you might have a small positive discretionary CRI balance due to the
truncation of cents when computing CRI amounts. The balance could be even
larger if you set a CRI dollar minimum because any CRI amounts truncated to
zero because they fall below the minimum will be added to the discretionary
CRI balance.
BX 2 Computed CRI = sum of Default and Discretionary CRI.
BY 3 Split % to Salary allows a portion of column BX to be spent as salary increase
and the remainder to be passed to CRI carryover. This is entered as an integer
between 0 and 99. A blank value here presumes all CRI funds should be applied
to the salary increase
19Col Source Description
BZ 2 Computed CRI % = Computed CRI (col BX) divided by current base pay
(col N).
CA 2 Computed Base Pay 2022 = Current base pay (col N) plus G $ (col BR) plus
computed CRI (col BX). This will be the employee's new base pay unless
one of many pay caps is reached.
CB 2 Max allowable CRI % = 0.0% if employee is in zone A, 6.0% if in zone C,
20.0% if in zone B. A possible pay cap. (Note: CRI above 20% requires a
waiver that must be processed through service channels outside of the CMS
CC 2 ft to Exceed
Allow d d t 20%
fl Limitt = )a value of 0 does not allow the employee’s Max
Allowable CRI to exceed 20%. A value of 1 allows the employee’s base pay to
exceed 20%.
CD 2 CY2022 Upper Rail Pay = computed from the formula for the CY2022
upper rail and the employee's OCS. A possible pay cap.
CE 2 CY2022 Lower Rail Pay = computed from the formula for the CY2022
lower rail and the employee's OCS. Six percent above this number is a
possible pay cap for employees in zone B.
CF 1 On ACDP? = “Yes” indicates employee is assigned to an Accelerated
Compensation for Developmental Position.
CG 1 Last ACDP Date = Date the employee last received an ACDP increase to salary.
CH 1 Last ACDP % = Value of the last ACDP increase.
CI 3 OCS Control Point, used if pay pool establishes control points by OCS. Gets
translated to the equivalent dollar value in column CK. Column is only visible
if the CMS if the pay pool has elected to use OCS Control Points.
CJ 3 Control Point $. Column is only visible if the CMS if the pay pool has
elected to use dollar-based Control Points. Can be a pay cap.
CK 2 Control Point Used in Calculations, If the pay pool has selected to use
OCS Control Points, the dollar value is calculated based on the OCS
Control Point (col CI) for employee and the rail target chosen by the Pay
Pool.
CL 3 Allow Over Control Point = a value of 0 does not allow the employee’s
maximum pay to exceed the amount in col CK (Control Point Used in
Calculations). A value of 1 allows the employee’s base pay to exceed the
calculated amount in col CK.
CM 2 Max Base Pay in 2022 = considering all of the possible pay caps, this is the
most the employee can earn (base pay) in 2022.
CN 2 F R t i CRI
Approved d P $ = New
0 th Base Pay
i 2022 b minus Gll increase
d l th 2021
minus i i base f
pay. Final CRI dollar amount after all pay caps are applied.
CO 2 New Base Pay in 2022 = smaller of computed base pay 2022 and max base pay
2022. This will be the employee's new base pay rate for 2022.
CP 1 Supv/Team Lead = Indicates employee’s supervisor or team lead status. This
flag is used to determine max rate in New Supervisory Differential rate (col
C ) 20Col Source Description
CQ 1 Supervisory Differential Start Date = Date employee started receiving
Supervisory Differential.
CR 1 Supervisory Differential Rate = Rate employee is getting as Supervisory
Differential.
CS 2 Supervisory Differential Amount = Calculated amount employee is getting
as Supervisory Differential.
CT 3 New Supervisory Differential Rate = New rate employee should get as a
Supervisor/Team Lead. Maximum value is 10% for Supervisor and 5% for
Team Lead.
CU 2 New Supervisory Differential Amount = New calculated amount employee
is getting as Supervisor/Team Lead differential.
CV 3 Fifth open (wildcard) column for pay pool use. Values entered or computed in
this column will be saved in any export back to the Oracle application, and will
be returned to this worksheet in subsequent imports. However, formulas entered
in this column will not be preserved through subsequent export-import cycles
unless the formula is also entered in the yellow cell immediately below the
wide gray line after the last person's record. These cells will be uploaded to
CAS2Net and included in subsequent imports into the CMS. You can change
the column heading by clicking in the cell immediately above the heading, using
the down arrow to enter the cell, and changing the heading in the formula bar.
CW 2 Marks the start of the Locality Pay section
CX 1 Locality Code = Code from DCPDS that indicates employee’s Locality Code
CY 2 Locality Rate = Percentage employee receives in Locality Pay
CZ 2 Initial Locality Pay Amount = Employee’s New Base Pay * Locality Rate
DA 2 New Base Pay + Locality = New Adjusted Pay before EXIV cap is applied
DB 2 Hit EXIV Cap = Flag that indicates New Base Pay + Locality exceeds EXIV
DC 2 Final Base Pay + Locality = Employee’s Adjusted Pay for 2022
DD 2 New Salary + Supv Differential. Sum of all three components (2022 base
salary + 2022 locality pay + 2022 supervisory differential)
DE 2 Indicated an employee will no longer have a status of being on retained pay in
2022.
DF Marks the start of the CA section of the spreadsheet
21Col Source Description
DG 2 Carryover award = if Col Z is set to 1, this column contains automatic awards
equal to the difference between Computed CRI (col BX) and Approved CRI
(col CN). If Col Z is set to zero, carryover award is zero. If Col Z is set to 2 all
CRI is carried over to an award. Carryover must exceed the pay pool minimum
CRI Carryover Amt specified on the parameters tab. Otherwise it will be zero.
DH 2 CA Positive DeltaY = a repeat of column BI
DI 2 CA computed by the Alpha2*DeltaY algorithm and parameters specified in the
parameter panel. See the end of this table for an explanation of the algorithm.
DJ 3 Discretionary CA input by the pay pool manager. Only yellow cells are eligible
for input. The cell at the top of the column shows the available balance - it is
shaded green as long as the balance is positive, but turns red when the balance
becomes negative. Amounts must be entered as whole dollars only – if the
amounts are computed in a wildcard column and then copied and pasted into
this column, they must be rounded to whole dollars before being copied.
DL 1 Requested % Award to Convert to Time off Award = Percentage of employee’s
Contribution Award that they request to be converted to Time off Hours.
DM 3 Approved % Award to Convert to Time off Award – based on the requested
amount, the this is the approved % that should be converted to Time off Hours.
DN 2 Time off Hours = The number of hours that is a result of the % Award
Converted to Time off Award (col DM) and the employee’s computed hourly
rate.
DO 2 Dollar Value Remain is the remaining number of award dollars after Time off
value has reduced computed award.
DP 3 Second Discretionary = Only yellow cells are eligible for input. The cell at the
top of the column shows the available balance - it is shaded green as long as the
balance is positive, but turns red when the balance becomes negative. Amounts
must be entered as whole dollars only – if the amounts are computed in a
wildcard column and then copied and pasted into this column, they must be
rounded to whole dollars before being copied.
DQ 2 Final CA Award = Dollar amount representing the computed award amount
taking into account the Time Off Value and the Second Discretionary (col DP)
amount.
22Col Source Description
DR 2 Total Award = sum of carryover award (col DG) and Final CA award
(col DQ). If the sum of computed and discretionary award is less than
the minimum specified on the parameter worksheet, then total award
will equal the carryover award.
DS 3 Sixth open (wildcard) column for pay pool use. Values entered or computed in
this column will be saved in any export back to the Oracle application, and will
be returned to this worksheet in subsequent imports. However, formulas
entered in this column will not be preserved through subsequent export-import
cycles unless the formula is also entered in the yellow cell immediately
below the wide gray line after the last person's record. These cells will be
uploaded to CAS2Net and included in subsequent imports into the CMS. You
can change the column heading by clicking in the cell immediately above the
heading, using the down arrow to enter the cell, and changing the heading in the
formula bar.
DT 2 Flag (= YES) identifying total awards in excess of $10,000. These awards
require local commander approval.
DU 2 Rating of record = the Rating of Record that will be transmitted to DCPDS
DV 2 Total New Compensation, computed as New Base Pay plus Total Award.
DW 3 Seventh open (wildcard) column for pay pool use. Values entered or
computed in this column will be saved in any export back to the Oracle
application, and will be returned to this worksheet in subsequent imports.
However, formulas entered in this column will not be preserved through
subsequent export-import cycles unless the formula is also entered in the
yellow cell immediately below the wide gray line after the last person's
record. These cells will be uploaded to CAS2Net and included in subsequent
imports into the CMS. You can change the column heading by clicking in
the cell immediately above the heading, using the down arrow to enter the
cell, and changing the heading in the formula bar.
DX 2 The employee's expected CY2022 OCS based on his or her base pay for 2022
and the formula for the 2022 SPL.
DY 2 If this value = 1, the employee must be placed on a CIP.
DZ 3 Eighth open (wildcard) column for pay pool use. Values entered or computed
in this column will be saved in any export back to the Oracle application, and
will be returned to this worksheet in subsequent imports. However, formulas
entered in this column will not be preserved through subsequent export-import
cycles unless the formula is also entered in the yellow cell immediately
below the wide gray line after the last person's record. These cells will be
uploaded to CAS2Net and included in subsequent imports into the CMS. You
can change the column heading by clicking in the cell immediately above the
heading, using the down arrow to enter the cell, and changing the heading in
the formula bar.
23Col Source Description
EA* 2 2021 Expected OCS (from column AT)
EB* 2 2021 OCS (from column AV)
EC* 2 Delta OCS (from column AW)
ED* 2 CY2021 Base Pay (from column N)
EE* 2 GPI $ (from column BR)
EF* 2 Approved CRI (from column CN)
EG* 2 New Base Pay 2022 (from column CO)
EH* 2 Total Award (from column DR)
EI* 2 Approved CRI + Total Award (column CN + column DR)
* The last nine columns are repeats of earlier columns. They are placed at the end of the
spreadsheet to summarize the key appraisal and compensation values.
Default CRI Algorithm (Alpha1*CRI DeltaY): The spreadsheet adds up all of the current base
pay rates (using top of the pay band for retained pay employees) in the pay pool and multiplies the
sum by the CRI% to establish the pay pool’s total CRI dollar budget. It then adds to the budget
any GPI carryover. It then multiplies the total budget by the CRI Set-Aside% to establish the
amount of money the pay pool manager will have for discretionary salary adjustments. The default
algorithm allocates the remaining money. To execute the default algorithm, the spreadsheet adds
up all of the positive CRI DeltaY values. This is the amount of money that would have to be in
the remaining CRI budget to bring everyone up to his or her CRI target pay. The spreadsheet then
computes Alpha1 by dividing the remaining CRI budget by the sum of the positive CRI DeltaY’s.
Alpha1 is thus the proportion of each employee’s “salary deficit” that can be paid off by the default
algorithm (Alpha1 is capped at 1.0). The spreadsheet then multiplies each employee’s positive CRI
DeltaY value by Alpha1 and rounds down to the nearest dollar to compute the employee’s default CRI
value.
Default CA Algorithm (Alpha2*CA DeltaY): The spreadsheet adds up all of the current adjusted
base pay rates (using top of the pay band for retained pay employees) in the pay pool and multiplies
the sum by the input Award Spent in CMS value times the CA% to establish the pay pool’s CMS
award budget1. It then multiplies the total budget by the CA Set-Aside % to establish the amount
of money the pay pool manager will have for discretionary awards. The default algorithm
allocates the remaining money. To execute the default algorithm, the spreadsheet adds up all of
the positive CA DeltaY values. This is the amount of award money that would have to be in the
remaining CA budget to bring everyone up to his or her CA target pay. The spreadsheet then
computes Alpha2 by dividing the remaining CA budget by the sum of the positive CA DeltaY’s.
Alpha2 is thus the proportion of each employee’s “salary deficit” that can be paid off by the default
algorithm (Alpha2 is capped at 1.0). The spreadsheet then multiplies each employee’s positive CA
DeltaY value by Alpha2 and rounds down to nearest dollar to compute the employee’s default CA
value.
Explanation of pay caps applied in the CMS
• Employees in Region C have a cap of 6% on their CRI increase.
• Employees in region B have two caps:
– Cap 1: 20%
– Cap 2: 1.06* Lower Rail Pay (LR)
• Without the second cap there would be a huge discontinuity
24– An employee who plots on the LR rail would be capped at a CRI increase of 6%
– An employee who plots $1 below the LR would be capped at a CRI increase of 20%
– This sudden change is not defendable, so the designers of AcqDemo constructed a
second cap
• With the second cap
– An employee who plots $1 below the LR has a CRI cap of 6% of the LR pay plus $1
– An employee who plots $2 below has a cap of 6% of the LR pay plus $2
– This is a nice smooth transition from Region C to Region B
– Eventually employees who plot further and further below the LR hit the 20% cap
1
The AcqDemo Federal Register announcement from 2017 says at least 10% of the pay pool’s award budget
should be available for non-CMS awards throughout the year.
25Matrix
This worksheet, part of which is shown below, rank orders employees by individual factor score
and by OCS. Employees are identified by career path, last name, first name, and broadband. The
sort order on scores (low to high or high to low) may be done by broadband or across all
broadbands. The order can be selected with the four buttons on the left (“All”, “NH”, “NJ”, and
“NK”). There are links in the upper left corner to return to the Main Menu (Contents) (“Return to
Main Menu”) worksheet or the Data worksheet (“Return to Data”).
The first matrix orders all employees in all career paths based on their OCS. The second matrix
orders all employees in the NH career path according to each of the 3 final numerical factor
scores, and by OCS. The second and third matrices (off the screen to the right in the figure above)
order all of the NJ and NK employees. The career path links in the upper left corner of the
worksheet are for quick navigation among the matrices – you can also browse through the
worksheet using the scroll bars at the bottom and right of the screen. The data can be printed by
clicking on the printer icon on the Excel toolbar. The all-career path matrix is printed on one page,
and each career path matrix is printed on a separate page.
New for 2021 is hiding career path sections for the career paths that do not exist in the CMS.
26Rails and RoR Report
This worksheet provides counts and percentages of employees by rail position and performance
rating of record. The table shows rail position by career path based on final, numerical OCS.
The modal rating of record by career path is shown towards the bottom of the sheet. Note that
modal rating can have more than one value if two or all three of the PAQL scores tie for the most
use. There is a link to the Main Menu (Contents) worksheet in the upper left corner, and the
report can by printed by clicking on the printer icon in the Excel toolbar.
Below the rails report there are some parameters and computations relating to the current year and
next year’s SPL and rails. These values are used internally by the workbook and are not intended
for pay pool use.
27Delta Statistics
This worksheet displays Delta OCS averages and standard deviations. Delta OCS is the difference
between an employee’s actual OCS and expected OCS, as computed from current salary and the
formula for the SPL. Standard deviation is a statistical measure of the range, or dispersion of Delta
OCS values. The addition of the rating of record counts broken out by the selected Delta Plot
Grouping is also displayed.
The top of the worksheet shows statistics by career path and overall. The middle of the worksheet
shows statistics for groups of employees within each career path. The bottom shows statistics for
the overall pay pool.
The groups can be defined by either first level supervisor (column Z on the main data sheet),
Office Symbol (column G on the Data tab), or any other grouping scheme entered into any of the
Wildcard columns on the main data sheet. The “Delta Plot Grouping” box at the top of this
worksheet contains radio buttons that allows you to switch groupings between first level
supervisor, office symbol, and any Wildcard column that contains data. Note that the example
shown above uses broadband level to define the groups. To make this happen, the data from
column L (Broadband Level) on the main data worksheet was first copied into Wildcard #1, and
then the Wildcard #1 radio button was selected in the Delta Plot Grouping box at the top of this
worksheet. If you change the groupings in Wildcard #1, be sure to click the “Refresh” button in
the Delta Plot Grouping box to re-compute the statistics.
Since standard deviations cannot be computed for distributions with only one data point, groups
with only one employee show N/A for standard deviation. If you wish to filter out these cases,
click on the button labeled “Hide with only 1 employee” at the top of the worksheet. To restore
the display of these groups, click on the “Show all” button.
28You can also read