Combinatorial Testing Metrics for Machine Learning
←
→
Page content transcription
If your browser does not render page correctly, please read the page content below
Combinatorial Testing Metrics for Machine
                            Learning
                          Erin Lanus∗ , Laura J. Freeman∗ , D. Richard Kuhn† , Raghu N. Kacker†
                    ∗ Hume   Center for National Security and Technology, Virginia Tech, Arlington, VA, USA
                                                     {lanus, laura.freeman}@vt.edu
                             † National Institute of Standards and Technology, Gaithersburg, MD, USA

                                                     {kuhn, raghu.kacker}@nist.gov

   Abstract—This short paper defines a combinatorial coverage            comparison of datasets. Consider the following questions.
metric for comparing machine learning (ML) data sets and                 How can differences between members of two classes lead to
proposes the differences between data sets as a function of              classification decisions? How can differences between datasets
combinatorial coverage. The paper illustrates its utility for
evaluating and predicting performance of ML models. Identifying          be used to predict whether a model trained on one dataset
and measuring differences between data sets can be of significant        will perform as expected on another? Comparing datasets via
value for ML problems, where the accuracy of the model is                combinations is possible at three levels of granularity: 1) the
heavily dependent on the degree to which training data are               count of combinations that are present or absent; 2) which
sufficiently representative of data that will be encountered in          specific combinations are present or absent; 3) the distribution
application. The utility of the method is illustrated for transfer
learning, the problem of predicting performance of a model               of combinations.
trained on one data set when applied to another.                            In this work, we define a new combinatorial coverage metric
   Index Terms—combinatorial testing, machine learning, oper-            for comparing ML datasets in § II focusing on the first level
ating envelopes, transfer learning, test-set selection                   of granularity (presence/absence of combinations). In § III,
                       I. I NTRODUCTION                                  we highlight two distinct applications of the metric. The fault
                                                                         localization and explainable classification sections show how
   In software and hardware, component systems are often                 the metric is useful based on interpretable features in the data.
well designed and tested, but failures occur when compo-                 The second application use the metrics to describe the oper-
nents are integrated due to unexpected interactions between              ating envelope of a model. The concept of a model operating
components. A survey [1] of empirical data found that nearly             envelope has applications in transfer learning, selection of
all failures in software were caused by a limited number of              training and test datasets, and directing data collection and
interacting components and concluded that testing interactions           labeling efforts. We discuss problems for future work in § IV.
of between four and six components was sufficient to detect
all failures in the software systems considered. The pair of
facts – that interactions between components called factors in                                    II. M ETRICS
a complex system can drive unexpected behavior if tests do not
adequately account for interactions, yet impactful interactions             We treat machine learning features as factors, so each
typically have limited size – has led to the adoption of                 factor is assigned a particular value for a given data point.
combinatorial testing (CT) for pseudo-exhaustive testing of              Continuous-valued factors must be discretized prior to apply-
software and hardware systems [2].                                       ing CT so that each factor has a corresponding set of values.
   Testing systems with embedded machine learning using                  A t-way interaction is an assignment of specific values to t
conventional software approaches poses challenges due to                 of the factors, or a t-tuple of (factor, value) pairs. If there
characteristics such as the large input space, effort required           are k identified features, each data point then contains kt
for white box testing, and emergent behaviors apparent only              interactions.
at integration or system levels [3], [4]. CT is a black box ap-             Combinatorial coverage, also called total t-way coverage, is
proach to testing an integrated system with pseudo-exhaustive            a metric from the CT literature [9] to describe the proportion
strategy for large input spaces. Thus far, CT has been applied           of possible t-way interactions appearing in a set (Figure 1).
to test case generation for autonomous vehicle systems with              Interactions that appear in the set are covered by the set.
embedded ML components [5], testing the internal state space             Define a universe with k factors and their respective levels
of a neural network [6], feature selection [7], and explainable          so that U is the set of all possible datapoints, and let Ut be
ML [8].                                                                  the set of possible t-way interactions. If some interaction is not
   In ML the data is fundamental to algorithm performance.               possible, it is a constraint and can be removed from Ut . Given
In this paper we leverage CT for testing ML systems through              a dataset D ⊆ U, define Dt as the set of t-way combinations
  Research of EL and LJF funded in part by MITRE University Innovation   appearing in D. (We acknowledge a slight abuse of notation
Exchange program.                                                        as D may be a multiset. This does not impact the metrics.)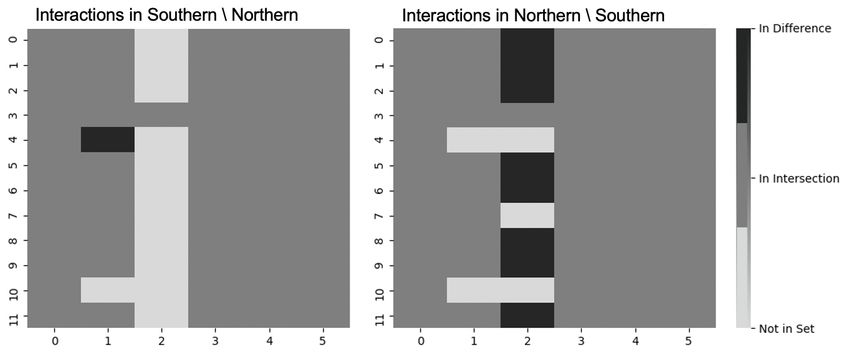
that are not in any passing tests, which for deterministic sys-
                                                                             tems must contain the fault-triggering combinations Ct . Basic
                                                                             set operations can also be used to further reduce the possible
Fig. 1. CCMt (Dt ) describes the proportion of possible t-way interactions   combinations involved in a failure. For example, an interaction
that appear in dataset D.                                                    continuity rule says that if a particular t-way combination in
                                                                             Ft is included in all higher strength combinations that contain
                                                                             the same t parameters, then the t-way combination is sufficient
                                                                             to detect the error.

Fig. 2. Relationships between datasets S and T and corresponding
                                                                             B. Explainable Classification
SDCCMt values. 1) (St ⊂ Tt ), 0 < SDCCMt (Tt \ St )
envelope of an ML model describes the contexts in which it is
expected to perform correctly; deploying to contexts outside
of the envelope can lead to unexpected outcomes. An ML
model learns about examples on which it trains, so to perform      Fig. 3. Metadata interactions expected in the target set can be used to select a
as expected in each of these contexts, it is anticipated that      source set from the model zoo with the closest match on metadata interactions
“enough” representative examples must be included in the
training dataset. The challenge is how to define contexts and
measure representativeness of the training examples.
   One dimension of the operating envelope of a computer
vision algorithm describes the contexts in which the model
trained as coverage of interactions among features present
in the dataset. These features can be derived directly from
the image data, but there are two benefits of using metadata
such as “Time of Day” or “Location” collected along with the       Fig. 4. Covered and uncovered 2-way label-centric interactions in the
image acting as a surrogate for contexts present in the image.     Southern and Northern datasets. The Y-axis indexes into combination while
                                                                   the X-axis indexes into interaction within a combination.
metadata is likely easier for human operators; “Time of Day”
as a surrogate for lighting effects in the image is more quickly
understood than presenting values for luminance and contrast.      Southern California. When a model is trained on the Southern
metadata may be available when image data is not, such as          subset of data S, a performance drop occurs when transferring
the case when an event is occurring in the near future in a        to the Northern subset of data T , indicating a transfer learning
new deployment environment for which no images have been           problem; the drop is not noted when the direction of transfer
collected. Expected parameters such as “Time of Day” and           is reversed. Twelve features are derived from the image data
“Location” can be extracted from the event profile.                – the mean and variance each for the red, green, blue, hue,
   When class labels are available, we describe a special way      saturation, and luminance – and each is discretized by forming
of calculating interactions. Label centrism forces all interac-    three bins encompassing equal-sized ranges. Interactions are
tions to include the label; that is, a label-centric interaction   label-centric and t = 2. The Southern set contains 21,151
includes the label and t−1 of the other features. Label centrism   images and the Northern set contains 10,849 images. The
describes the contexts in which classifiable objects appear.       CCM2 (S) = 72    60
                                                                                        = 0.83 and CCM2 (T ) = 67      72 = 0.93,
   In the current practice, claiming representativeness of a       meaning that the Northern set covers more of the universe
training dataset often relies on randomized selection or ensures   than the Southern set despite having half as many images.
that every object type appears in the training set, but may        Figure 4 plots the coverage in the sets side by side.
fail to be representative of larger contexts of the deployment        The utility of CCM for comparing a source and target pair
environment. CCMt applied to a training dataset provides a         is limited. Suppose S 0 contained all interactions in the left
measurement of the contexts on which the algorithm trained         half of the plot and none in the right half, while T 0 = U \ S 0 ,
given the tunable parameter t. In the case of transfer learning,   the complement. Both have CCM2 values of 0.5. Suppose
a model trained in one environment is deployed to a different      S 00 = T 00 and CCM2 (S 00 ) = 0.25. The relationship between
environment, possibly without retraining or fine tuning. Where     the respective sets is not apparent through use of CCM ,
CCMt is a measure of coverage by a dataset with respect to         which is the limitation for which SDCCM was designed.
some defined universe, the new metric, SDCCMt , describes          SDCCM2 (S \ T ) = 60     1
                                                                                               = 0.02. SDCCM2 (T \ S) = 67      8
                                                                                                                                  =
a directed difference between two datasets and is useful for       0.12. For this dataset, SDCCM is correlated with a drop in
measuring the distance between a source dataset where the          performance in transfer learning when no retraining is allowed.
model is trained and a target dataset T where the model            Figure 5 depicts the SDCCM2 plots side by side.
will be deployed. When multiple source models are available           Combinatorial coverage is well studied in testing for de-
in a model zoo, the source dataset S with the smallest             terministic failures in software systems where the appearance
SDCCMt (T \S) provides the best coverage of contexts in the        of an interaction among components in one test is sufficient
target by the source (Figure 3). Additionally, as interactions
in a set difference describe contexts unseen in the trained
model, the list of interactions in the set difference provides
a mechanism for directing data collection or labeling efforts
to include datapoints containing these interactions.
   A use case for the set difference application to operating
envelopes for transfer learning is demonstrated on the “Planes
in Satellite Imagery” Kaggle dataset [15]. The dataset is
intended for binary classification and is comprised of images
that either have a plane or do not have a plane along with         Fig. 5. Set differences of 2-way label-centric interactions. Interactions appear
metadata indicating the location as Northern California or         as cells colored depending set membership.
target environment, explore the impact of label centrism, and
how to choose a “good” interaction size t.
Additionally, the sensitivity of these metrics to fea-
ture/metadata selection is critical. In the classification exam-
ple, the features were directly explainable. In the computer
vision example the research had to first hypothesize reasonable
features. The process of hypothesizing features, conducting
initial screening experiments to select the meaningful features,
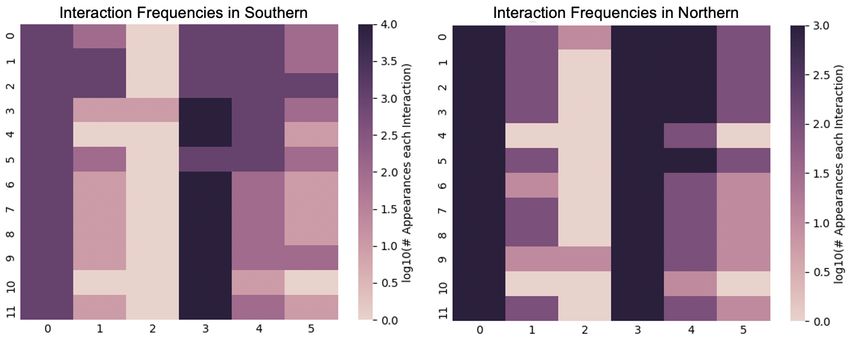
Fig. 6. The log scale count of each interaction in each set.
and confirming results should be codified to ensure that this
work is not subject to confirmation biases of the research team
to cause a failure; if the components will interact to cause or over interpretation of correlations as explanatory variables.
a failure, it is detected by a test suite that contains that Finally, additional work is needed to exploit the deeper
interaction at least once. Statistical learning does not have this levels of explainability, that is - which specific interactions are
nice property. We suspect that combinatorical coverage and present or absent and the distribution of those interactions. The
set difference combinatorial coverage metrics are useful tools specific interactions present or absent should be explored for
for constructing operating envelopes as they provide a way to potential explanation of how and why algorithms perform well
detect contexts in the target environment that are not likely to or poorly, potential biases introduced into the algorithms, and
be within the model’s operating envelope. However, as models predictive capabilities to new operating envelopes. Relative
are trained by updating weights each time these contexts are frequency metrics for the set difference should be developed
seen, we suspect that distribution of coverage would do more and their application to transferability evaluated.
to describe the operating envelope over metadata. That is, R EFERENCES
frequently appearing interactions indicate contexts on which
[1] D. R. Kuhn, D. R. Wallace, and A. M. Gallo, “Software fault interactions
the model was well trained; they could also indicate instances and implications for software testing,” IEEE Transactions on Software
of overfitting. Infrequently appearing interactions indicate con- Engineering, vol. 30, no. 6, pp. 418–421, 2004.
texts on which the model received less training; they could [2] C. Nie and H. Leung, “A survey of combinatorial testing,” ACM
Computing Surveys (CSUR), vol. 43, no. 2, pp. 1–29, 2011.
present contexts in which the model has difficulty making [3] D. Marijan, A. Gotlieb, and M. Kumar Ahuja, “Challenges of testing
classifications. Our work measures and plots this distribution. machine learning based systems,” in 2019 IEEE International Confer-
ence On Artificial Intelligence Testing (AITest), 2019, pp. 101–102.
D. Test Set Design [4] J. M. Zhang, M. Harman, L. Ma, and Y. Liu, “Machine learning test-
ing: Survey, landscapes and horizons,” IEEE Transactions on Software
Datasets are partitioned into training S, validation, and Engineering, pp. 1–1, 2020.
testing T sets. When datasets are large and random selection [5] C. E. Tuncali, G. Fainekos, H. Ito, and J. Kapinski, “Simulation-
is applied, the hope is that the test set is representative of based adversarial test generation for autonomous vehicles with machine
learning components,” in 2018 IEEE Intelligent Vehicles Symposium
the training set as they are drawn from the same population. (IV), 2018, pp. 1555–1562.
Computing SDCCMt (S \T ) and SDCCMt (T \S) provides [6] L. Ma, F. Juefei-Xu, M. Xue, B. Li, L. Li, Y. Liu, and J. Zhao, “Deepct:
assurance against a bad random draw. A simple randomized Tomographic combinatorial testing for deep learning systems,” in 2019
IEEE 26th International Conference on Software Analysis, Evolution
algorithm makes several random partitions and keeps the one and Reengineering (SANER), 2019, pp. 614–618.
with the lowest SDCCM values. This is equivalent to testing [7] S. Vilkomir, J. Wang, N. L. Thai, and J. Ding, “Combinatorial meth-
within the operating envelope of the model. ods of feature selection for cell image classification,” in 2017 IEEE
International Conference on Software Quality, Reliability and Security
Another testing strategy is identify where the model fails Companion (QRS-C), 2017, pp. 55–60.
to generalize to new contexts it has not trained by selecting [8] R. Kuhn and R. Kacker, “An application of combinatorial methods for
test-sets outside of the envelope. In this case, selecting T so explainability in artificial intelligence and machine learning (draft),”
National Institute of Standards and Technology, Tech. Rep., 2019.
that SDCCMt (T \ S) is as close to 1 as possible creates a [9] D. R. Kuhn, I. D. Mendoza, R. N. Kacker, and Y. Lei, “Combinatorial
test set that contains as many untrained contexts as possible. coverage measurement concepts and applications,” in 2013 IEEE Sixth
The importance of the reverse direction is not as clear. When International Conference on Software Testing, Verification and Valida-
tion Workshops, 2013, pp. 352–361.
SDCCMt (T \ S) = 1, the sets Tt and St are disjoint and [10] D. R. Kuhn, R. N. Kacker, and Y. Lei, “Practical combinatorial testing,”
SDCCMt (S \ T ) = 1 necessarily, but when it is only close NIST special Publication, vol. 800, no. 142, p. 142, 2010.
to 1, the score also depends on the size of St . [11] D. R. Kuhn, R. N. Kacker, Y. Lei, and D. E. Simos, “Combinatorial
methods for explainable ai.”
[12] M. T. Ribeiro, S. Singh, and C. Guestrin, “” why should i trust you?”
IV. C ONCLUSIONS AND FUTURE WORK explaining the predictions of any classifier,” in Proceedings of the 22nd
This work discussed metrics that provide tools for explain- ACM SIGKDD international conference on knowledge discovery and
data mining, 2016, pp. 1135–1144.
ing classification outcomes and defining the domain (operating [13] F. Shakerin and G. Gupta, “Induction of non-monotonic logic programs
envelope) over which ML algorithms can be expected to to explain boosted tree models using lime,” in Proceedings of the AAAI
operate successfully. Future work is needed to explore the Conference on Artificial Intelligence, vol. 33, 2019, pp. 3052–3059.
[14] D. Gunning, “Explainable artificial intelligence (xai),” Defense Ad-
usefulness of these metrics across multiple ML domains, test vanced Research Projects Agency (DARPA), nd Web, vol. 2, no. 2, 2017.
the hypothesis that models trained on source sets with smaller [15] Rhammell, “Planes in satellite imagery,” Jan 2018. [Online]. Available:
SDCCMt distances to the target will perform better in the https://www.kaggle.com/rhammell/planesnetYou can also read