Comparison of loop extrusion and diffusion capture as mitotic chromosome formation pathways in fission yeast
←
→
Page content transcription
If your browser does not render page correctly, please read the page content below
1294–1312 Nucleic Acids Research, 2021, Vol. 49, No. 3                                                                       Published online 12 January 2021
doi: 10.1093/nar/gkaa1270

Comparison of loop extrusion and diffusion capture
as mitotic chromosome formation pathways in fission
yeast
Tereza Gerguri1,† , Xiao Fu1,† , Yasutaka Kakui2,3,† , Bhavin S. Khatri2,4 ,
Christopher Barrington5 , Paul A. Bates 1,* and Frank Uhlmann 2,*
1
 Biomolecular Modelling Laboratory, The Francis Crick Institute, London NW1 1AT, UK, 2 Chromosome Segregation
Laboratory, The Francis Crick Institute, London NW1 1AT, UK, 3 Waseda Institute for Advanced Study, Waseda

                                                                                                                                                                Downloaded from https://academic.oup.com/nar/article/49/3/1294/6090303 by guest on 08 September 2021
University, 1-21-1 Nishiwaseda, Shinjuku-ku, Tokyo 169-0051, Japan, 4 Department of Life Sciences, Imperial College
London, Silwood Park Campus, Ascot SL5 7PY, UK and 5 Bioinformatics and Biostatistics Science Technology
Platform, The Francis Crick Institute, London NW1 1AT, UK

Received October 15, 2020; Revised December 01, 2020; Editorial Decision December 18, 2020; Accepted December 21, 2020

ABSTRACT                                                                                 ation of current models of mitotic chromosome
                                                                                         formation.
Underlying higher order chromatin organization are
Structural Maintenance of Chromosomes (SMC)
complexes, large protein rings that entrap DNA.                                          INTRODUCTION
The molecular mechanism by which SMC com-                                                Dynamic chromatin organization during interphase is cru-
plexes organize chromatin is as yet incompletely                                         cial for gene regulation and other nuclear processes. In mi-
understood. Two prominent models posit that SMC                                          tosis, chromatin compacts to give rise to well-defined X-
complexes actively extrude DNA loops (loop extru-                                        shaped chromosomes, a prerequisite for their faithful segre-
sion), or that they sequentially entrap two DNAs                                         gation. At the basis of higher order chromatin organization
                                                                                         lie Structural Maintenance of Chromosomes (SMC) com-
that come into proximity by Brownian motion (diffu-
                                                                                         plexes, large protein rings that have the ability to topolog-
sion capture). To explore the implications of these                                      ically entrap DNA (1–3). SMC rings include an ATPase,
two mechanisms, we perform biophysical simula-                                           suggesting that energy is expended to organize chromatin
tions of a 3.76 Mb-long chromatin chain, the size                                        or to regulate the process. During interphase, the major
of the long Schizosaccharomyces pombe chromo-                                            chromosomal SMC complex is the cohesin complex that es-
some I left arm. On it, the SMC complex condensin                                        tablishes cohesion between the newly replicated sister chro-
is modeled to perform loop extrusion or diffusion                                        matids. It does so by topologically entrapping the two sister
capture. We then compare computational to experi-                                        DNAs. Cohesin also participates in organizing interphase
mental observations of mitotic chromosome forma-                                         chromatin into topologically associating domains (TADs).
tion. Both loop extrusion and diffusion capture can                                      As cells progress towards mitosis, a second SMC complex,
result in native-like contact probability distributions.                                 condensin, rises in importance. Condensin is enriched, or
                                                                                         activated, on mitotic chromosomes to promote chromo-
In addition, the diffusion capture model more read-
                                                                                         some compaction. Without condensin, chromosomes fail to
ily recapitulates mitotic chromosome axis shorten-                                       reach their mitotic shape and are unable to segregate, leav-
ing and chromatin compaction. Diffusion capture                                          ing behind anaphase bridges. The molecular mechanism by
can also explain why mitotic chromatin shows re-                                         which SMC complexes organize chromatin has remained
duced, as well as more anisotropic, movements, fea-                                      a matter of debate. Two prominent models postulate that
tures that lack support from loop extrusion. The                                         SMC complexes actively extrude DNA loops (loop extru-
condensin distribution within mitotic chromosomes,                                       sion), or that they sequentially entrap two DNAs that come
visualized by stochastic optical reconstruction mi-                                      into proximity by Brownian motion (diffusion capture).
croscopy (STORM), shows clustering predicted from                                           Both condensin and cohesin have, under certain condi-
diffusion capture. Our results inform the evalu-                                         tions, been observed to extrude DNA loops in vitro (4–7).
                                                                                         Once bound to DNA, these SMC complexes asymmetri-

* To
   whom correspondence should be addressed. Tel: +44 203 796 2059; Email: frank.uhlmann@crick.ac.uk
Correspondence may also be addressed to Paul A. Bates. Email: paul.bates@crick.ac.uk
†
    The authors wish it to be known that, in their opinion, the first three authors should be regarded as joint First Authors.


C The Author(s) 2021. Published by Oxford University Press on behalf of Nucleic Acids Research.
This is an Open Access article distributed under the terms of the Creative Commons Attribution License (http://creativecommons.org/licenses/by/4.0/), which
permits unrestricted reuse, distribution, and reproduction in any medium, provided the original work is properly cited.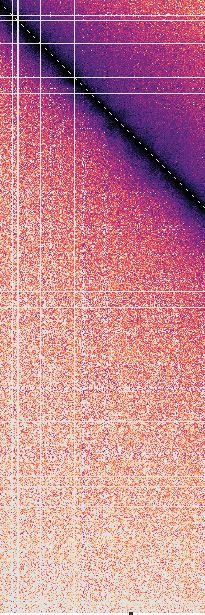
Nucleic Acids Research, 2021, Vol. 49, No. 3 1295
cally or symmetrically reel in DNA, thereby forming a DNA MATERIALS AND METHODS
loop. However, the same experiments suggest that little ATP
S. pombe strains and culture
is hydrolyzed to rapidly move these molecules over long dis-
tances. Applied to chromatin, condensin has been proposed All the S. pombe strains used in this study are listed in
to similarly reel in chromatin until it reaches a neighbor- Supplementary Table S1. To construct the Cut14-SNAP
ing condensin complex that is itself engaged in loop extru- strain, the SNAP coding sequence (New England Biolabs)
sion. This would lead to formation of a central protein scaf- was cloned into a pFA-based fission yeast C-terminal tag-
fold from which DNA loops emerge, reflecting chromosome ging vector, then the C-terminus of the endogenous cut14+
models based on cytological and early biochemical analyses locus was fused to SNAP by PCR-based gene targeting
(8–10). Simulations of this process taking place on human (22). Strains were cultured in Edinburgh minimal medium
chromosomes have shown agreement with experimentally (EMM) supplemented with 2% glucose and 3.75 g/l of L-
observed chromosome formation, chromosome axis estab- glutamic acid as a nitrogen source. To arrest cells in mito-
lishment and sister chromatid resolution (11). A feature of sis, 5 g/ml of thiamine was added to the EMM culture
Downloaded from https://academic.oup.com/nar/article/49/3/1294/6090303 by guest on 08 September 2021
the loop extrusion model is that condensin-mediated DNA to repress Slp1 expression and incubated for 3 h at 25 ◦ C.
contacts will always lie within the same chromatin chain. For Cut14 depletion, cells were incubated for 90 min after
Whether condensin can indeed extrude loops on a chro- the addition of 5 g/ml thiamine at 25◦ C to repress both
matin substrate densely decorated by histones and other Slp1 and Cut14 expression, and then 0.5 mM of the auxin 3-
DNA binding proteins, as well as overcome the barriers indoleacetic acid (IAA) was added to the culture to degrade
that higher level chromatin organization is likely to impose Cut14 and incubated for another 90 min at 25◦ C before cells
(12,13), remains unclear. were collected.
An alternative mechanism by which condensin can con-
tribute to chromosome formation is by stabilizing stochastic
pairwise interactions between condensin binding sites (14). Measurement of DNA volume and chromatin loci distance
We refer to this mechanism as ‘diffusion capture’. A con- Cells were fixed with 70% ethanol and then stained with
densin complex that has topologically loaded onto DNA 4 ,6-diamidino-2-phenylindole (DAPI). Images were ac-
might be able to embrace a second DNA that comes into quired as serial sections along the z axis on a DeltaVi-
proximity by Brownian motion. This mechanism could be sion microscope system (Applied Precision). To measure
akin to cohesin’s ability to capture a second DNA, follow- the DNA volume, all the images were deconvolved in Soft-
ing its loading onto a first DNA (15). Alternatively, two WoRx and then the voxels over an arbitrary DAPI signal in-
condensin complexes that each embrace one DNA might tensity threshold were counted using the 3D objects counter
engage with each other. A tendency of SMC complexes to in Fiji (23,24). Distance distribution data between chro-
form clusters on DNA in vitro (16–18) is consistent with matin loci was adopted from (25).
the latter possibility. In the diffusion capture scenario, con-
densin establishes contacts both within chromosomes and
between chromosomes, consistent with experimental obser- Chromatin mobility tracking and mean square displacement
vations in yeasts (19–21). Computational simulation of dif- (MSD) calculation
fusion capture taking place on a small budding yeast chro-
mosome has generated chromosome properties with a good For chromatin mobility tracking, a single focal plane
fit to experimentally observed chromosome behavior (14). of live cells was imaged at 20 ms intervals using a
Whether diffusion capture suffices to govern the formation custom-built spinning-disc confocal microscope system
of larger chromosomes is not known. (Intelligent Imaging Innovations) (25,26). The movement
In this study, we developed a coarse-grained Brownian of a fluorescent dot was automatically traced using
dynamics simulation of a chromatin chain, the size of the Virus Tracker (https://github.com/djpbarry/CALM/wiki/
long left arm of fission yeast chromosome I. We use these Virus-Tracker). The weighted mean of the MSD was cal-
simulations to explore the consequences of loop extrusion culated using the @msdanalyzer Matlab class (27). Further
and diffusion capture on chromosome formation. We com- details are described in (24).
pare predictions from both models to experimental obser-
vations in fission yeast. Both loop extrusion and diffusion
capture result in chromosome formation and chromosome Anisotropy of motion determination from trajectories at short
contact distributions similar to those observed in vivo. In times
addition, diffusion capture provides an efficient means to From a trajectory in 2D, we determined anisotropic motion
recapitulate condensin-dependent chromosome axis short- where the diffusion constant is not the same in all directions
ening and volume compaction, as well as experimentally ob- and/or there are different constraints in one direction or an-
served chromatin mobility changes inside mitotic chromo- other. In both cases, the MSD along each direction will be
somes. Finally, the localization of condensin within mitotic different. In the case of a polymer like chromatin, there is
chromosomes using STORM imaging reveals condensin in general no good frame of reference, since the local envi-
clusters that are predicted to arise from diffusion capture. ronment rearranges over time. Over long times the MSDs
We conclude that diffusion capture represents an appeal- along two axes will therefore be the same. However, over
ing mechanism that we propose contributes to chromosome short times the local environment will be relatively constant,
formation in fission yeast. and the MSDs along two axes will show a difference if there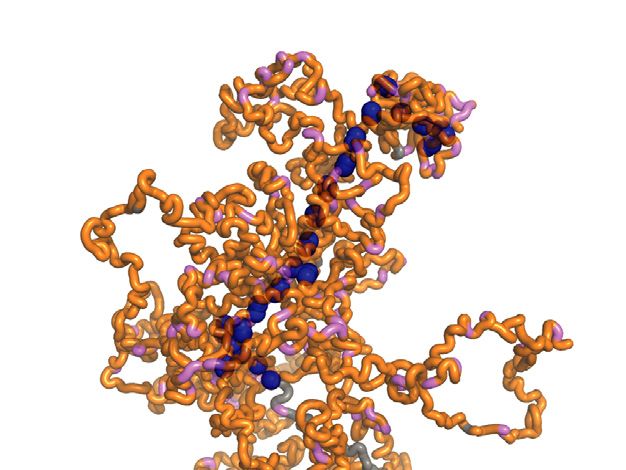
1296 Nucleic Acids Research, 2021, Vol. 49, No. 3
are anisotropic constraints. For this reason, we define time- tions with a lower axial precision (>100 nm). Filtering was
dependent anisotropy η in the following way: performed using Bruker’s SRX software.
2
η (t) ∼ (size of jumps)x − (size of jumps) y
Simulation of a coarse-grained chromatin chain
(x2 (t)−y2 (t))
2
= , A virtual chromatin chain was constructed to study the ex-
r 2 (t)2
pected behavior of the long left arm of Schizosaccharomyces
where x2 (t) is the MSD in the x-direction, y2 (t) is pombe chromosome I. The chain comprises 1880 consecu-
the MSD in the y-direction and r 2 (t) = x2 (t) + tively connected beads with a radius of 25 nm, each reflect-
y2 (t) the total MSD in 2D. Note that η is an average ing a string of ∼10 nucleosomes covering a genomic size of
over a number of trajectories, where for each trajectory the ∼2 kb. This chain thus corresponds to a genomic length of
MSD is calculated by an average over all displacements with ∼3.76 Mb, equivalent to the long S. pombe chromosome I
delays t. η is roughly the squared normalized average dif- left arm. Any two connected beads elastically interact and
Downloaded from https://academic.oup.com/nar/article/49/3/1294/6090303 by guest on 08 September 2021
ference between the diffusion constants in x and y direc- any two beads that overlap mutually repel. In the absence of
tions, Dx and Dy , and so we can roughly relate the ratio of introduced condensation mechanisms, each chromatin bead
these diffusion constants to η in the following way undergoes Brownian motion, constrained by attractive and
√ volume exclusion forces. Effectively, the relaxed chain be-
Dx 1− η haves as a self-avoiding Rouse polymer (Figure 1A).
∼ √
Dy 1+ η
Chromatin bead unit. A linear array of 10 nucleosomes
where without loss of generality we assume that Dx ≤ Dy , with 10 nm diameter including linker DNA reaches just over
by assuming the x direction is that corresponding to the 100 nm (radius 50 nm). Tight hexagonal packing of 10 nu-
smaller diffusion constant. cleosomes in turn results in an assembly with radius 15 nm.
This gives us upper and lower bounds for the size of a 10
nucleosome unit. Based on fine-grained simulations of a hi-
STORM microscopy
stone chain (14), we observe that 10 nucleosomes in a chro-
Cells were fixed with 3.7% formaldehyde in PEM buffer (0.1 matin chain typically occupy a volume with a radius of ∼25
M PIPES, 1 mM ethylene glycol-bis (ß-aminoethyl ether)- nm. This volume is only partially filled with nucleosomes
N,N,N ,N -tetraacetic acid (EGTA), 1 mM MgSO4 ) for 10 and is accordingly modeled as a soft sphere without a rigid
min at room temperature. Fixed cells were washed with boundary.
PEM buffer containing 1.2 M sorbitol three times. To per-
meabilize cell membranes, cells were treated with 0.1% Tri- Special sites on the chromatin chain. While the virtual
ton X-100 in PEM buffer for 5 min at room temperature. chromatin chain is a homopolymer in a physical sense, a few
Cut14-SNAP was stained with 0.2 M of SNAP-Surface beads are marked as special sites corresponding to their bi-
Alexa Flour 647 (New England BioLabs) in PEM buffer ological roles. The first and last beads of the chain represent
for 15 min at 25◦ C. After washing cells with PEM buffer the telomere and centromere, respectively. A group of beads
three times, SNAP-stained cells were mounted on Nunc™ with 0.1, 0.7, 1.2, 1.8 and 2.2 Mb genomic distance from
Lab-Tek™ II Chambered Coverglass eight wells (Sigma) a locus close to the centromere are labeled to correspond
coated with Lectin. STORM imaging was performed in to fluorophore-tagged sites, allowing inter-fluorophore dis-
imaging buffer (20 mM Cysteamine (MEA, Sigma), 1% tances to be monitored akin to experimental observations
2-mercaptoethanol (Sigma), 50 mM Tris–HCl (pH 8.0), (25,29). 158 beads are selected to be ‘condensin binding
10 mM NaCl, 10% glucose, 205.4 U/ml glucose oxidase sites’. Their distribution is based on a condensin ChIP ex-
(Sigma), 5472 U/ml catalase (Sigma). periment in fission yeast (25). The mean distance between
STORM images were collected on a Bruker Vutara 352 neighboring condensin binding sites is 11.7 beads (23.4 kb),
commercial 3D biplane single molecule localization micro- the median distance is six beads (12 kb) (Figure 1B). These
scope using a 60× silicone objective (Olympus) with a nu- beads are either the ‘host’ sites of condensin to mediate dif-
merical aperture of 1.2 (28). We used a 640 nm laser with fusion capture or the starting positions of condensin to ini-
50% laser power for illuminating Alexa Fluor 647 and a 405 tiate loop extrusion.
nm laser with 0.5% laser power for photo-activation. Fluo-
rescent signals were captured on an ORCA-Flash4.0 CMOS Boundary condition and initial configuration. To resemble
camera (Hamamatsu) using 20 ms exposure. We collected conditions in the interphase S. pombe nucleus, the chro-
30 000 frames and eliminated the first 10 000 frames for data matin chain was placed in a spherical volume of 14.14 m3
processing. (1.5 m radius) with a rigid boundary to represent the S.
To determine precise particle localization, we followed pombe nucleus. S. pombe interphase chromatin contains few
a previously described data processing method (28) with defined structural domains, such as TADs (25,30). For this
slight modifications. Briefly, we removed localizations with reason, a set of ‘random’ conformations was created within
lower quality score (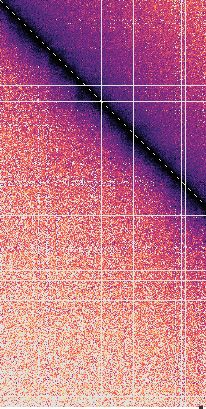
Nucleic Acids Research, 2021, Vol. 49, No. 3 1297

tialized chromatin chain was then subject to the rules and     where K ten is the spring constant of the linker, di, i +1 is the
physics-based forces introduced below.                         distance between the centers of two consecutively connected
                                                               beads i and i +1; c2 is a constant describing the equilib-
Forces employed. In the absence of active processes gov-       rium (non-stretched or non-compressed) length of the bead
erning condensation, a bead i in the chromatin chain is sub-   linker; û i, i +1 are unit vectors determining the direction of
ject to a stochastic force Fisto sourced from collision with   the force.
molecules in the nucleoplasm, a tension force Fiten imposed
                                                               Repulsion force. In order to limit overlaps between any
by connected beads, and a volume-exclusion repulsive force
  r ep                                                         two beads, a constant volume exclusion force between two
Fi exerted by spatially overlapping beads. Additionally,       beads within dr ep0 < 50 nm of each other is applied. Unless
a damping force Fidam = − λvi acts on the moving bead,         stated otherwise, û a, b denotes a unit vector from object a to
representing the viscous effect of the nucleoplasm, the mag-   object b.
nitude of which is assumed to be proportional to instanta-

                                                                                                                                       Downloaded from https://academic.oup.com/nar/article/49/3/1294/6090303 by guest on 08 September 2021
                                                                                      N
neous speed.                                                               r ep
                                                                         Fi       =          c3 û j, i ,   if di, j < 50 nm
                                                                                      j =i
Stochastic force. A stochastic force is applied to each
bead, both chromatin beads and condensins (see below), at      where c3 is a constant equal to 0.5; j is a bead different from
each simulation step as:                                       i.
                        Fisto = ξ (t) ,
                                                               Diffusion capture simulations
  Any component of the stochastic force ξ (t) has a time-
                                                               The diffusion capture model describes the crosslinking of
average of zero and is uncorrelated in space and time.
                                                               distal genomic sites mediated by condensin. To implement
Namely,
                                                            this model an additional pair of beads, representing a con-
            ξx (t) = 0, ξx (t) ξx t                        densin molecule, is bound to condensin binding sites. When
                                                           two condensins bound to different binding sites stochasti-
                     = c1 δ x − x δ t − t  ,                 cally become spatially adjacent, they have a probabilistic
   In practice, at each step, the instantaneous value of any   propensity of association (Figure 1C). In some simulations,
                                             √                 we titrated the condensin concentrations such that we re-
component of the force ξ (t) is calculated as c1 multiplied    moved randomly 85, 75, 50 or 25% of condensin molecules
by a random number drawn from a Gaussian distribution          from their binding sites.
with a zero mean and a standard deviation of 1. The con-
stant c1 is set as:                                            Forces employed. Three additional forces are employed in
                   c1 = 2Dλ2 = 2 λkB T                         order to implement the diffusion capture model. A con-
                                                               densin structure force describes the interaction between the
with Stokes–Einstein relation:                                 two condensin ‘feet’ that reflects the structural integrity
                         kB T    kB T                          of a condensin molecule; a condensin attachment force de-
                 D =           ∼      ,                        scribes the interaction between both condensin feet and a
                        6π ηr     λ
                                                               chromatin bead that maintains condensin attachment to the
where D represents the diffusion coefficient, η dynamic vis-   chromatin chain; a condensin capture force describes the in-
cosity and r is the bead radius. Since the coarse-grained      teraction between condensins on different beads that medi-
bead does not represent a rigid sphere but rather a flexi-     ates diffusion capture.
ble chain of ∼10 nucleosomes, the relation λ = 6π ηr does
not apply. For simplicity, we introduced a plausible damp-     Condensin structure force. While condensin is modelled as
ing constant λ. The value of c1 allows the bead to have        two beads, a front and a rear ‘foot’, only the front foot par-
an average movement on a scale consistent with experi-         ticipates in diffusion capture. A linear elastic force is ap-
mental observations (24,31). Coarse-grained bead move-         plied between the two feet to maintain their spatial prox-
ment is principally regulated by the entropic force and        imity, which becomes important later in the loop extrusion
the spring constant of the chromatin bead linker. This         model.
parameter pair was chosen such that the bead displace-
                                                                     F str uctur e
                                                                       f oot1      = K ten d f oot1, f oot2 − c4 û f oot1, f oot2 ,
ment distribution over short (20 ms) time intervals was
compatible with that observed in the S. pombe interphase       where c4 , representing the equilibrium distance between the
nucleus (25).                                                  two feet, equals 0 nm. The radius of both feet is 25 nm.

Tension force. A linear elastic force (e.g. Hookean spring)    Condensin attachment force. The interaction between each
is applied to describe the interaction between two consecu-    condensin foot and its binding site is described as:
tively connected coarse-grained beads:
                                                                          f oot = K
                                                                        F attach          d f oot, j − c4 û f oot, j ,
                                                                                     ten

              Fiten = K ten (di, i −1 − c2 ) û i, i −1
                                                               where c4 is equal to 0 nm; j refers to the chromatin bead
                       +K ten (di, i +1 − c2 ) û i, i +1      that condensin is attached to.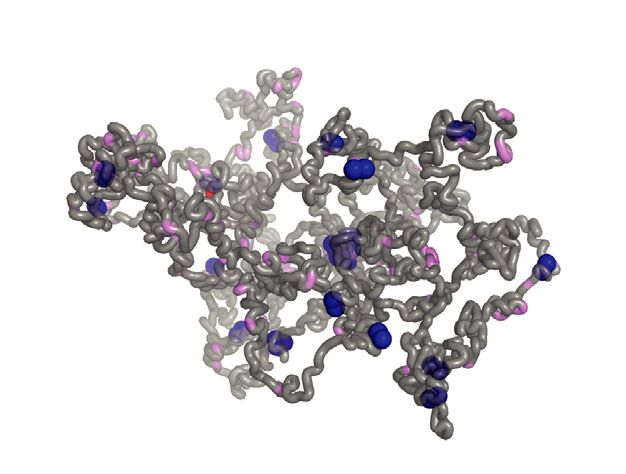
1298 Nucleic Acids Research, 2021, Vol. 49, No. 3
Condensin capture force. The condensin capture force, Forces employed
Ficondensin , is applied between condensin front feet on dif- The loop extrusion model differs from diffusion capture
ferent binding sites as an elastic spring following Hooke’s in that the condensin attachment force is repurposed as an
law:
extrusion force F extr usi on
, acting to elastically connect the
f oot, j
Ficondensin dii,jj , p translocating condensin foot with the associated chromatin
N bead.
=
K condensin dii, jj − c5 û ii, j j , i f dii, j j < 77nm ∧ r p < p
,
0, otherwise F extr usi on
f oot, j = K ten d f oot, j − c4 û f oot, j ,
jj
This force is exerted when the center of front foot ii and where F extr usi on
f oot, j is a tension force allowing a condensin foot
the center of another front foot j j are within a cut-off dis- to interact with bead j on the chromatin chain. Bead j is
tance dii, j j = 77 nm. This equates to a distance of 27 nm iteratively being updated to the following chromatin bead
j + 1 (in the case of forward-moving condensing foot) or
Downloaded from https://academic.oup.com/nar/article/49/3/1294/6090303 by guest on 08 September 2021
between the bead surfaces, a conservative estimate for a dis-
tance that might be bridged by a condensin molecule. p is j − 1 (in the case of backward-moving condensing foot),
the dissociation probability which represents turnover of therefore allowing translocation of condensin along the
diffusion capture pairs. Algorithmically, it is implemented chromatin chain and re-assignment of their F extr usi on
f oot, j from
through a random number generated at each time step the current chromatin bead to the adjacent one. A condensin
for each F → (dii, j j , p)icondensin : if a random number r p is capture force is not operational in the loop extrusion model.
less than a threshold p then F → (dii, j j , p)icondensin becomes
zero. c5 is the equilibrium distance between two interact- Dynamics and model implementation
ing condensins. Here, we define c5 as 52 nm, meaning that
two condensins lie adjacent. The valence of diffusion cap- The overdamped Langevin equation is employed to de-
ture sites, F → (di, j , p)icondensin , representing the number of scribe the time evolution of the coarse-grained chromatin
..
interacting partners, is naturally regulated by the forces in configuration. This assumes that the inertial part mu is
i
the system and steric constraints. .
much smaller than the damping part λ u, on the longer
timescales of interest in this study. Under this assumption,
Loop extrusion simulations the dynamical equation to describe a free chromatin chain
is as follows:
In contrast to diffusion capture, where condensins attach .
r ep
to their binding sites and remain in position, in the loop ex- 0 = − λ u +ξ (t) + Fiten + Fi
trusion model condensins load at empty binding sites from
where they translocate. The two condensin feet symmetri- or
.
cally move in opposite directions along the chromatin chain 0 = − λ u + Fisto + Fiten + Fi
r ep
by repeatedly associating with the next chromatin bead,
thereby bridging distant genomic sites to form a chromo- In the diffusion capture model, additional forces are in-
some loop (Figure 1D). When two condensin complexes en- cluded to describe the movement of a specific bad i:
counter each other, movement of colliding feet is stopped. .
r ep
Condensin feet that are not in collision continue translo- 0 = − λu + Fisto + Fiten + Fi + Ficondensi n + Fistr uctur e + Fiattach ,
cation, resulting in further asymmetric loop extrusion. The
In the loop extrusion model, movement of a specific bead
rate of translocation is given by:
i during simulation is controlled by a summation of forces:
psliding ∗ 2n ∗ n bp .
r ep
υLE = 0 = −λ u + Fisto + Fiten + Fi + Fistr uctur e + Fiextr usi on ,
tstep
At each simulation step, the Euler integration has been
where psli di ng is a probability of translocation, n is the num-
applied to the dynamics equation in order to describe time
ber of travelled beads, n bp represents the DNA length in
evolution of the system, therefore movement of each bead
bp per bead and tstep is the simulation timestep. In our
is described for velocity vi x (t) and tension u i x (t + t) as
simulation, υ LE ∼ 1.2 kb/s in line with experimentally ob-
follows:
served values (4,32). To introduce condensin turnover, each
f r ee
condensin can stochastically unbind from the chromatin vi x (t) = λ1 Finet
x = 1
λ
Fix , F DC
ix , F LE
ix ,
chain and relocate. A constant condensin concentration on u i x (t + t) = u i x (t) + vi x (t) t.
chromatin is achieved such that every time a condensin is
unloaded, a new condensin is loaded at an empty bind- where F f r ee , F DC , F LE , as given by the sum of terms in
ing site. Algorithmically, dynamical condensin exchange is the equations above, correspond to forces employed in free
implemented such that at Texchange time intervals a disso- chromatin chain, the diffusion capture model, and the loop
ciation probability pon/o f f is calculated (akin to the con- extrusion model, respectively.
densin dissociation probability p in the diffusion capture
model) for each condensin to decide whether it is unloaded
List of parameters regulating bead movement
from its current position and relocated to an empty binding
site. See Table 1.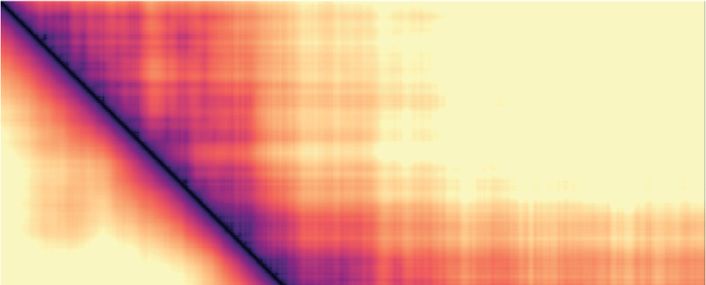
Nucleic Acids Research, 2021, Vol. 49, No. 3 1299

Table 1. List of parameters regulating bead movement                    centers of the two feet of individual condensins is selected
Parameters       Values     Dimension    Host function                  to reflect two condensin diameters in the model. A mini-
                                                                        mum number of condensins per cluster of 2 is chosen for the
λ               3 × 10⁻⁸      kg/s       Fisto                          comparison between STORM data and the computational
K ten           1 × 10⁻¹     pN/nm       Fisto                          diffusion capture and loop extrusion models.
                                                            r ep
di, i +1           ***        nm         Fisto , Fiten , Fi
c2              5.2 × 10²     nm         Fiten
                                                                        Simulation MSD measurements. In order to determine the
                                                            rep
û i, i +1         ***         –         Fisto , Fiten , Fi             MSD exponent of chromatin mobility in our simulations,
                5 × 10⁻¹
                                           r ep
c3                            pN         Fi
                                           r ep                         we used the same approach as for the experimental data.
dr ep0           5 × 101      nm         Fi
K bi nder       1 × 10⁻¹     pN/nm       Fibi nder
                                                                        Instead of the experimental fluorophore labelled chromatin
c4                  0         nm         Fibi nder                      locus, we tracked the position of the 158 condensin binding
K ten bi nder   1 × 10⁻¹     pN/nm       Fiattach                       sites. We analyzed the MSD exponent for each 2 s window,
c4                 0         nm         Fiattach                       collected every 30th second during the simulations. Since

                                                                                                                                           Downloaded from https://academic.oup.com/nar/article/49/3/1294/6090303 by guest on 08 September 2021
K condensi n    1 × 10⁻¹     pN/nm       Ficondensi n                   in the experiments we only observe a randomly oriented
c5              5.2 × 10²     nm         Ficondensi n                   2D projection of the full 3D fluorophore motion, we ap-
dcondensi n0    7.7 × 10²     nm         Ficondensi n                   plied a 3D to 2D projection of particles in our simulations.
po              1 × 10⁻²       –         Ficondensi n                   We found previously that this projection does not alter the
di, j              ***        nm         Fistr uctur e                  mean MSD exponent, but slightly broadens the distribution
û i, j            ***         –         Fistr uctur e                  (24).
dii, j j           ***        nm         Ficondensi n , Fiattach
û ii, j j         ***         –         Ficondensi n , Fiattach        Simulation anisotropy measurements. Anisotropy of chro-
Texchange           2          s         condensin turnover during LE
pon/o f f       1 × 10⁻²                 condensin turnover during LE
                                                                        matin bead motion in our simulations was determined as
                                                                        described for the experimental data during the same time
                                                                        windows as the MSD exponents.
Measurements and readouts
                                                                        RESULTS
All simulations were run for 1200 s with a simulation
timestep dt = 10−4 s. Each simulation condition for diffu-              A biophysical model of diffusion capture and loop extrusion
sion capture and loop extrusion was recapitulated with 10               along the fission yeast chromosome I left arm
simulation replicates. If not stated otherwise, readouts were           To study fission yeast chromosome condensation, we devel-
collected every 10 s, resulting in 1200 measurements from               oped a biophysical model of a chromatin chain represent-
the 10 replicates.                                                      ing the length of the long left arm of fission yeast chro-
                                                                        mosome I. Our coarse-grained chromatin chain consists of
Computational fluorophore distance measurements. We                     1,880 beads, each covering a ∼2 kb region corresponding
mapped experimental fluorophore arrays (25,29) onto the                 to ∼10 nucleosomes, representing 3.76 Mb of genomic dis-
computational chromatin chain and measured Euclidean                    tance (Figure 1A). A stochastic force (Fsto ) is applied to ev-
distances between selected fluorophore pairs.                           ery bead of the system, under the assumption that a chro-
                                                                        matin bead follows Brownian motion in isolation. Any two
Computational Hi-C and interaction frequency analysis.                  consecutive beads interact via a spring-associated tension
We generated Hi-C-like representations of chromosome                    force (Ften ) following Hooke’s law. This results in collec-
conformations during our simulations. Instead of contact                tive dynamic behavior of a joined chromatin chain. In ad-
frequency, we display Euclidean distance between any two                dition, a repulsion term is employed when beads overlap
chromatin beads, averaged over 12 000 conformations col-                (Frep ), taking into account the soft nature of the chromatin
lected at 1 s intervals from the 10 simulation replicates. To           chain within each bead. We consider the behavior based on
plot interaction frequency as a function of genomic dis-                Fsto , Ften and Frep to be that of a free chromatin chain (Fig-
tance, we considered two beads as interacting if their Eu-              ure 1A). To simulate diffusion capture and loop extrusion,
clidean distance was within 500 nm. The principle conclu-               we selected specific beads along this polymer chain as con-
sions from this analysis were insensitive to the chosen cutoff.         densin binding sites, recapitulating the experimentally ob-
All bead pairs were binned according to their genomic sepa-             served condensin distribution along fission yeast chromo-
ration to generate a frequency distribution. The frequencies            some I (Figure 1B) (25). These condensin binding sites are
are normalized to have a sum of one across all bins.                    the ‘host’ sites of condensin to mediate diffusion capture,
                                                                        or the starting positions for condensin to initiate loop ex-
Computational volume measurements. To facilitate vol-                   trusion.
ume measurements, we divided our system into 3D voxels                     Condensin is modeled to comprise two ‘feet’ that are ini-
(cubes). Each voxel has a dimension of 100 nm. We define                tially concentric with each other and the condensin binding
the volume of the chromatin chain as the total volume of                site. Only the ‘front’ foot takes part in diffusion capture, the
occupied voxels.                                                        ‘rear’ foot gains relevance during loop extrusion. To model
                                                                        diffusion capture, condensin is attached to the chromatin
Condensin clustering analysis. Clustering is performed us-              bead via a spring-based attachment force (Fattach ) and re-
ing a DBSCAN algorithm in the open-source python li-                    mains bound to the same bead throughout the simulation. If
brary sklearn.cluster. A cutoff distance of 100 nm between              two condensins on distinct chromatin beads encounter each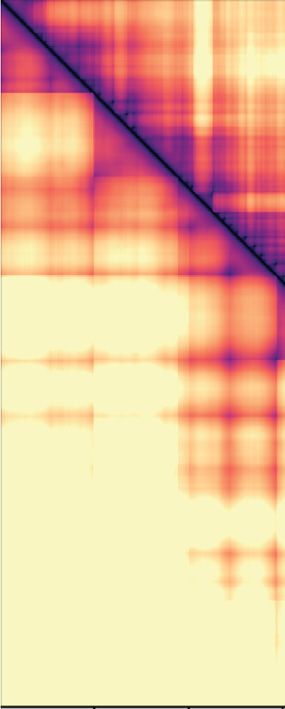
1300 Nucleic Acids Research, 2021, Vol. 49, No. 3

                   A                                                                    ten                    rep
                                                                                    F                      F
                                                          25 nm

                                                     10 nucleosomes

                                                                                                                        condensin
                                                                                                                        binding sites
                                                                                  sto
                                                                              F

                   B
                                                                                                           Distance between Condensin
                        Normalized counts

                                            20                                                             binding sites (kb)

                                                                                                                                                                     Downloaded from https://academic.oup.com/nar/article/49/3/1294/6090303 by guest on 08 September 2021
                                                                                                                                                  2
                                                                                                           1                10               10
                                            10

                                            0
                                            1720          1740       1760                     1780
                                                         chromosome I (kb)

                   C                               Diffusion capture                                  D                Loop extrusion

                       Binder-chain                                          p
                                                                                                                                     structure
                       interaction                                                                                               F
                                                                                                                extrusion
                                        attach                            condensin                         F
                        F                                             F
                                                                                                                                                      pon/off

                                                                                                                                        Binder collison
                                                                  d < dcutoff                                         Loop
                                                    d > dcutoff
                                                                                                                     nesting

Figure 1. A biophysical model of the fission yeast chromosome I left arm. (A) Schematic of the coarse-grained chromatin polymer model and the forces
exerted on the chromatin chain. Grey beads with a radius of 25 nm are equivalent of ∼10 nucleosomes and represent a ∼2.0 kb chromatin region. Condensin
binding sites are highlighted in magenta. A stochastic force (Fsto ) allows each bead to follow a Brownian dynamics trajectory. The tension force (Ften )
connects beads and constrains their movement, whereas a repulsion force (Frep ) limits bead overlap. (B) Example of condensin localization along a 60 kb
region in the middle of the chromosome I left arm (left; (25)). Condensin enriched sites are highlighted in magenta. The distance distribution between
neighboring condensin binding sites along the chromosome I left arm are plotted (right), the box shows the median, 25th and 75th percentile, the whiskers
indicate the range. (C) Schematic of the applied physical forces in the diffusion capture model. Condensin-chromatin association is secured by an attachment
force (Fattach ). Two condensins are allowed to be attracted by a condensin capture force (Fcondensin ) and form a diffusion capture pair if their Euclidean
distance d < dcutoff . Fcondensin is additionally regulated by an association probability p. (D) Schematic of the forces in the loop extrusion model. Each
condensin consists of two ‘feet’ that move in opposite directions. Movement is secured by the extrusion force (Fextrusion ) that replaces Fattach and targets
beads one removed from the bead of residence. The two feet are prevented from splitting by a structure force (Fstructure ). At certain time intervals, an
association probably pon/off allows condensin to detach and re-load onto a free condensin binding site to initiate a new loop or loop nesting. The resulting
looping patterns in (C) and (D) are schematically illustrated.

other by stochastic movements they form a pairwise interac-                                          nature is regulated by the condensin-condensin association
tion with a defined probability via a condensin capture force                                        probability. This probability not only controls formation of
(Fcondensin , Figure 1C). When multiple condensins spatially                                         new diffusion capture pairs, but also maintenance of these
meet at a common place, they are able to form larger clus-                                           bonds at every simulation step.
ters, limited in size only by the geometric constraints of the                                         In the loop extrusion model, the condensin attachment
system. In vivo, condensin shows dynamic turnover on chro-                                           force is repurposed as an extrusion force (Fextrusion ). Con-
mosomes (33,34). While condensin in our diffusion capture                                            densin initially binds to a condensin binding site, from
simulations remains stably chromatin bound, its dynamic                                              where its front and rear feet start translocating into op-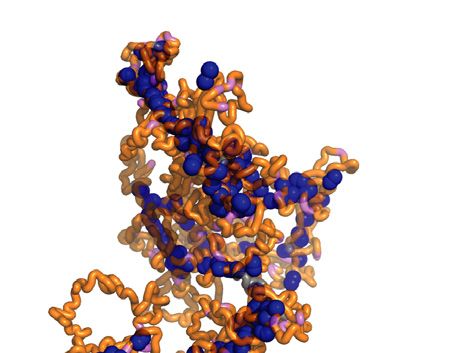
Nucleic Acids Research, 2021, Vol. 49, No. 3 1301
posite directions. Fextrusion sequentially targets chromatin distances and corresponding to a 26% mitotic chromosome
beads next to the current bead of residence, resulting in sym- axis shortening due to diffusion capture.
metric loop extrusion (Figure 1D). The two condensin feet We next turned to the loop extrusion model. Upon the
remain connected to each other by a condensin structure initiation of loop extrusion using either 15% or 100% of
force (Fstructure ). When two condensins encounter each other, condensin per loading site, loops rapidly form and an ax-
movement of the colliding feet is stopped, while feet that are ial condensin accumulation becomes discernable over time
not in collision continue translocation, resulting in asym- (Supplementary Figure S1B and Supplementary Movies S3,
metric loop extrusion until they also encounter another S4). At the interphase condensin concentration, a relatively
condensin (see our discussion for the case that condensins short axial structure forms with long chromatin loops (Fig-
can pass each other (32)). Loop extruding condensins peri- ure 2C). The in silico fluorophore distance is influenced by
odically have a chance to unload and load again at a free where the fluorophores find themselves relative to the axis,
condensin binding site, thus ensuring dynamic loop forma- with a median distance of 1.3 m in interphase. At the
tion and loop nesting. Parameters are chosen to match ex- higher mitotic condensin concentration a greater number
Downloaded from https://academic.oup.com/nar/article/49/3/1294/6090303 by guest on 08 September 2021
perimentally observed loop extrusion rates (4,32). of loops, including a greater fraction of nested loops, are
Fission yeast condensin accumulates in the nucleus in mi- formed. This results in shorter loops and correspondingly
tosis. During interphase, nucleo-cytoplasmic shuttling leads a longer chromosome backbone. The fluorophore distance
to condensin redistribution and equalization between the now depends on how the backbone arranges itself inside the
compartments (35,36). We have previously determined the chromosome, resulting in a simulated median Euclidean flu-
nucleus-to-cytoplasm ratio in fission yeast to be 0.14 ± orophore distance of 1.2 m. This corresponds to an 8%
0.05 (24). With therefore approximately 15% of nuclear con- chromosome arm shortening, less than what was achieved
densin, we use 15% occupied condensin binding sites to rep- by diffusion capture.
resent in silico interphase, while we refer to 100% condensin To further explore the relationship between genomic and
binding site occupancy as in silico mitosis. Further details Euclidean distances in the diffusion capture and loop extru-
on the computational implementation of the diffusion cap- sion models, we inspected chromatin beads at 0.1, 0.7, 1.2,
ture and loop extrusion models can be found in the Materi- 1.8 and 2.2 Mb distance, corresponding to previously ex-
als and methods. perimentally observed fluorophore pairs (29). In silico inter-
phase in either the diffusion capture or loop extrusion mod-
els recapitulated in vivo measured interphase distances rea-
sonably well (Supplementary Figure S2A). Diffusion cap-
Axial chromosome compaction by diffusion capture and loop
ture resulted in mitotic axial compaction in almost all ob-
extrusion
served cases, albeit not to the full extent that is observed in
Axial shortening is a hallmark of condensin-dependent mi- vivo (Supplementary Figure S2B). Thus diffusion capture
totic chromosome formation in yeasts (25,29,37–39). To in- makes a robust contribution to mitotic axial chromosome
spect axial chromosome compaction, we monitored the dis- compaction. In contrast, loop extrusion often exhibited the
tance of two fluorophore-marked loci at 1.8 Mb distance opposite trend, generating increased mitotic Euclidean dis-
from each other in vivo and of similarly spaced in silico- tances. In the loop extrusion model, additionally activated
marked loci in our model. The median in vivo interphase condensin in mitosis will shorten chromatin loops and add
distance, projected onto a 2D plane, was 1.1 m in inter- new loop anchors to the chromosomes backbone, thus re-
phase, which shortened by ∼ 39% to 0.65 m in mitosis sulting in the overall lengthening of the chromosome axis.
(Figure 2A) (25). The distance of the same fluorophore pair Additional mechanisms might be required to achieve repro-
was previously measured in 3D to around 1.8 m in inter- ducible chromosome axis compaction in the loop extrusion
phase contracting to around 1.0 m (i.e. by 44%), in mitosis model, for example additional condensin-condensin inter-
(29). Mitotic compaction in both studies depended on con- actions (40).
densin.
We started our computational simulations of diffusion
In silico contact probability distributions due to diffusion cap-
capture from a relaxed chromatin chain, with either 15%
ture or loop extrusion
(interphase) or 100% (mitosis) of occupied condensin bind-
ing sites. Diffusion capture pairs start to form and the sys- Chromatin contact probability distributions, obtained from
tem approaches a steady state when the number of cap- high throughput conformation capture (Hi-C) experiments,
ture pairs and the in silico fluorophore distance fluctuates contain important information on chromosome architec-
around a constant value (Supplementary Figure S1A). Fig- ture (41). Condensin is known to enhance longer-range
ure 2B shows representative conformations of our com- chromatin contacts during mitotic chromosome condensa-
putational chromosome in both conditions. The real time tion at the expense of local chromatin contacts (25,42,43).
movements of the chromatin chain can be observed in Sup- Figure 3A shows experimental Hi-C maps of the fission
plementary Movies S1 and S2, illustrating frequent ex- yeast chromosome I left arm in interphase and mitosis, as
change of diffusion capture pairs in the steady state. We well as the Hi-C interaction frequencies plotted as a func-
recorded 1200 3D fluorophore distance measurements at tion of their genomic distance. This illustrates enhanced mi-
regular time intervals from 10 independent simulation re- totic chromatin interactions in a distance range from ∼90
peats. These measurements show a well-defined distribution to 900 kb, which depend on condensin (25).
with a median of 1.2 m in interphase and 0.89 m in mi- To generate Hi-C-like depictions of our computational
tosis, roughly compatible with experimentally observed 3D chromosome conformations, we display Euclidean dis-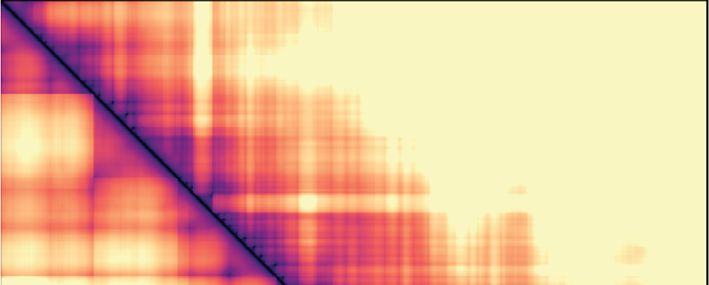
1302 Nucleic Acids Research, 2021, Vol. 49, No. 3

                     A                         Experiment
                              Interphase                           Mitosis                 25                     Experiment
                                                                                                                    interphase
                                                                                           20                       mitosis

                                                                                           15

                                                                                           10

                                                                                               5
                       TetO       LacO DAPI (DNA) TetO              LacO DAPI (DNA)
                              Chromosome I 1.8 Mb                                              0
                                                             Cen                                   0.0 0.5 1.0 1.5 2.0
                                                                                                          Distance (μm)
                                      ChrI-1.95Mb       Lys1

                                                                                                                                                            Downloaded from https://academic.oup.com/nar/article/49/3/1294/6090303 by guest on 08 September 2021
                                         TetO           LacO

                      B                   Simulation DC
                                 15% Condensin        100% Condensin                                                     DC
                                                                                         250
                                                                                                                         15%
                                                                                         200                             100%
                                                                                         150

                                                                                         100

                                                                                          50

                                                                                           0
                                                                                               0.0 0.5        1.0 1.5 2.0 2.5
                                                                                                             Distance (μm)
                      C                   Simulation LE
                                 15% Condensin         100% Condensin
                                                                                          250                            LE
                                                                                                                         15%
                                                                                          200                            100%
                                                                                          150

                                                                                          100

                                                                                           50

                                                                                           0
                                                                                                   0.0 0.5    1.0 1.5 2.0 2.5
                              Condensin                 Condensin binding site                               Distance (μm)
                              Chromatin chain           Extruded loops

Figure 2. Axial chromosome compaction by diffusion capture and loop extrusion. (A) Fluorescent microscopy images of interphase and mitotic cells,
showing two genomic loci marked by TetOs (red) and LacOs (green) together with DAPI staining of the DNA (blue). The schematic depicts the positions
of the two loci along the chromosome I left arm (29). Distance distributions and their medians from >162 cells in each condition are shown. (B, C)
Representative snapshots of in silico chromosome conformations by the diffusion capture (DC, B) and loop extrusion models (LE, C). Examples are
shown of in silico interphase (15% condensin) and mitosis (100% condensin). The legend identifies the elements that compose the structures. Red and
green stars represent in silico fluorophores, corresponding to those in (A). Their physical distance distribution and medians from 1200 snapshots from 10
simulation replicates is shown.

tance maps, averaged over time and between simulation                          fusion capture, the interaction frequency plot reveals in-
replicates (Figure 3B and C). These maps reveal that,                          creased mitotic interactions over a distance range of 120–
in both the diffusion capture and loop extrusion mod-                          1100 kb (Figure 3B), in approximate agreement with the
els, the increased mitotic condensin concentration results                     experimental observations. Loop extrusion also resulted in
in increased longer-range proximities, as seen by an ex-                       increased longer-range interactions, albeit at a somewhat
panded mitotic diagonal. To analyze interaction frequen-                       shorter distance range of 60–600 kb (Figure 3C). Thus,
cies as a function of genomic distance, we set an arbi-                        both in silico diffusion capture and loop extrusion reca-
trary Euclidean distance cutoff at 500 nm to convert prox-                     pitulate condensin-dependent mitotic chromatin contact
imity into ‘in silico Hi-C interactions’. In the case of dif-                  changes.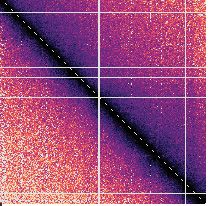
Nucleic Acids Research, 2021, Vol. 49, No. 3 1303
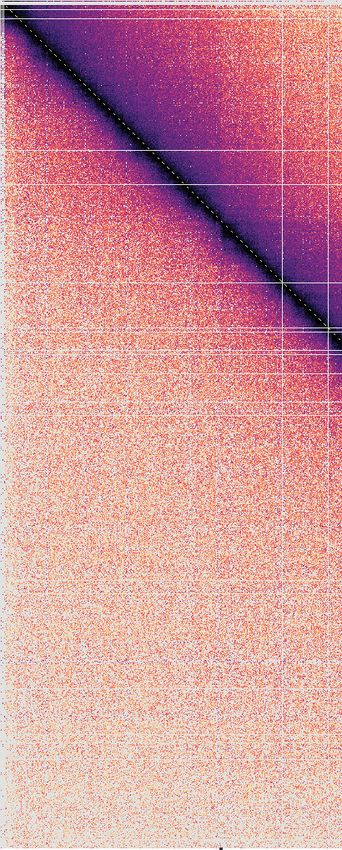
A Experiment
Mitosis 10-1
interphase
mitosis
Chromosome I (Mb)
1 P(s)
–3 10-2
>= 5x10
P(s)
2
–5
10-31304 Nucleic Acids Research, 2021, Vol. 49, No. 3
To better understand the distance range of enhanced mi- tween condensin binding sites along a chromatin chain can
totic chromatin interactions, we titrated the condensin con- contribute to chromatin volume compaction. In contrast,
centration in our simulations. In the case of diffusion cap- loop extrusion resulted in only marginal volume changes.
ture, the interaction frequency plot of a free chromatin Specifically, the median volume increased by 0.09% during
chain (0% condensin) showed only little difference from simulated mitosis (Figure 4B and Supplementary Figure 4).
our interphase conditions (15% condensin). As soon as While interactions between distant parts of the genome are
additional condensin binding sites were activated (25%), established by loop extrusion, the intervening chromatin is
chromatin interactions in the 120–1100 kb distance range extruded, which limits the potential for volume compaction.
were augmented. Interactions increased further as more Increased loop nesting, beyond that achieved based on sim-
condensin was added, while the interaction distance dis- ple probability, might be able to achieve increased levels of
tribution remained roughly constant (Supplementary Fig- compaction in this model.
ure S3A). Loop extrusion showed a different response pat-
tern. Compared to the free chromatin chain, 15% of con-
Downloaded from https://academic.oup.com/nar/article/49/3/1294/6090303 by guest on 08 September 2021
Diffusion capture reduces mitotic chromatin mobility
densin resulted in an increase in chromatin interactions
longer than 200 kb. This is likely explained by the forma- During mitotic chromosome formation, condensin imposes
tion of long chromatin loops in the presence of low con- constraint on the free movement of the chromatin chain
densin levels. As the condensin concentration increased, (25). To experimentally study chromatin movements, we
the distance range of chromatin interactions shortened, track a chromatin locus in the middle of the chromosome
as expected from shorter chromatin loops. A close match I left arm, marked by tandem lac operators bound by a
to the experimental interaction frequency distribution was LacI-GFP fusion protein. We then plot its mean squared
obtained at intermediate condensin levels (Supplementary displacement (MSD) over time. During interphase, we find
Figure S3B). Thus, both the diffusion capture and loop that the MSD exponent over short time intervals is 0.49
extrusion models reproduce experimental interaction fre- ± 0.02 (mean ± 95% confidence interval, n = 595), con-
quency distributions. The distance range of enhanced mi- sistent with a polymer chain whose diffusive behavior is
totic interactions is robust in the case of diffusion capture, only slightly constrained by a small amount of condensin
but sensitive to the condensin concentration in the case of (Figure 5A) (24). In mitosis, the exponent is markedly re-
loop extrusion. duced to 0.28 ± 0.02 (n = 271). Looking more carefully at
the distribution of MSD exponents from individual chro-
matin traces, the interphase distribution is well described by
Chromatin volume compaction in mitotic chromosomes
a single Gaussian fit. The mitotic sample, however, showed
A visually striking aspect of mitotic chromosome condensa- a bimodal distribution that likely arose from contamina-
tion is the volume reduction during the conversion of diffuse tion with a small number of interphase cells. A pure mitotic
interphase chromatin into distinct chromosome bodies (44). MSD exponent might be lower than 0.28, possibly as low
In human cells this entails a ∼2-fold volume compaction as 0.25 (Supplementary Figure S5A). Exemplar trajectories
(45). Indeed, chromosome compaction was one of the first of the GFP-marked locus over time illustrate the reduced
described roles of the fission yeast condensin complex (37). mitotic chromatin mobility (Figure 5A).
To quantify fission yeast chromosome compaction, we mea- We next explored the consequences of condensin-
sured the chromatin volume in interphase and mitosis by dependent in silico diffusion capture or loop extrusion on
3D reconstructing serial z-stacks of fluorescent microscopy chromatin mobility. Similar to experimental observations,
images of DNA stained with 4 ,6-diamidino-2-phenylindole we track chromatin beads in simulation replicates and plot
(DAPI). The median interphase chromosome volume was their MSD over time. In the diffusion capture model, the in-
2.06 m3 which decreased in mitosis to 1.64 m3 , a 20% vol- terphase MSD exponent was 0.52 ± 0.03 (mean ± 95% con-
ume reduction (Figure 4A). Mitotic compaction depended fidence interval, n = 1320), close to the experimentally ob-
on the condensin complex and was no longer observed fol- served value. The exponent was reduced to 0.38 ± 0.02 dur-
lowing condensin depletion using a combined transcrip- ing in silico mitosis. The mitotic mobility reduction is rem-
tional shut-off and auxin-inducible degron strategy (46). iniscent of our in vivo observations, although the extent of
To measure chromatin volume in our simulations, we di- the MSD exponent reduction did not fully reach the exper-
vided the nuclear volume into 100 nm-sized cubic voxels. imental observation. An example trajectory of a chromatin
We counted a voxel as occupied if it contained at least one bead exemplifies the constrained mitotic mobility due to
chromatin bead. The chromosome I left arm accounts for diffusion capture (Figure 5B). In the loop extrusion model,
∼20% of the fission yeast genome. Its in silico volumes were the interphase MSD exponent was 0.54 ± 0.03. The MSD
somewhat larger than the corresponding fraction of the ex- exponent remained almost unchanged under mitotic condi-
perimentally measured DNA volume. This is likely the case tions when it persisted at 0.51 ± 0.03. A representative bead
because chromosomes lie close together in the yeast nu- trajectory further illustrates the largely unchanged mobility
cleus, reducing their apparent occupied volume at our mi- (Figure 5C). This suggests that the structural flexibility and
croscopic resolution. Despite the different numerical values, dynamics of the chromatin chain is constrained by diffu-
the diffusion capture model resulted in a 16% volume reduc- sion capture but remains largely unaltered during loop ex-
tion when comparing interphase and mitosis (Figure 4B). trusion.
Volume reduction was condensin concentration-dependent To study the effects of diffusion capture and loop extru-
(Supplementary Figure S4). This observation demonstrates sion on chromatin mobility further, we again turned to con-
that establishment of stochastic pairwise interactions be- densin titration in our simulations. The mean MSD expo-Nucleic Acids Research, 2021, Vol. 49, No. 3 1305
A Bottom Top Max projection
Mitosis Interphase
2 µm
Experiment B Simulation
DC LE
4
1100
DNA volume (µm3)
Downloaded from https://academic.oup.com/nar/article/49/3/1294/6090303 by guest on 08 September 2021
Occupied voxels
3 1000
900
voxel
2
800
700
1
I M M 15% 100% 15% 100% Condensin
–Condensin
Figure 4. Chromatin volume compaction in mitotic chromosomes. (A) Examples of z-stacked images of DAPI-stained DNA in interphase and mitotic
nuclei. Pseudocolor images of maximum intensity projections of the DNA volume are shown on the right. The volume distribution of >155 cells in
interphase (I) and mitosis (M), as well as in mitosis following condensin shut-off (- Condensin) are shown. Boxes show the median and interquartile
ranges. (B) Volumes of 1200 simulated chromosome conformations, recorded every 10 s from 10 simulation replicates, as measured by occupied voxel
counts using interphase and mitotic conditions during diffusion capture (DC) and loop extrusion (LE) simulations. Boxes depict medians and interquartile
ranges. A schematic of chromatin beads, distributed across voxels, is included.
nent of the free chromatin chain was 0.53 ± 0.03 consis- apparent isotropic behavior. For this reason, we focus on
tent with that of an unconstrained Rouse polymer chain the average anisotropy η̄ over delays of up to 0.1 s.
with excluded volume (24). Condensin titration in the dif- As a benchmark of our expectations for an isotropic
fusion capture model sequentially led from an interphase polymer, we first analyzed the anisotropy of our simulated
MSD exponent to more and more constrained mobility free chromatin chain. We expect η(t) → 0 as t → 0,
at full condensin binding site occupancy (Supplementary though the finite time resolution of our experiment gives
Figure S5B). The effect of loop extrusion was also con- us a finite value for η̄. Under our sampling conditions, we
densin concentration-dependent, however did not result in a find η̄ = 0.019 ± 0.005 (Supplementary Figure S6), which
mean MSD exponent reduction1306 Nucleic Acids Research, 2021, Vol. 49, No. 3
A Experiment
10–1
Mean MSD (µm2) Mitosis – condensin Interphase Mitosis
α = 0.53 0.2 0.2
Interphase
α = 0.49 0.1 0.1
–2
y (µm)
y (µm)
10
0 0 2
time (s)
Mitosis −0.1 −0.1 1
α = 0.28
10–3 −0.2 −0.2 0
−0.2 −0.1 0 0.1 0.2
10–2 10–1 100 x (µm)
−0.2 −0.1 0 0.1 0.2
x (µm)
∆t (sec)
Downloaded from https://academic.oup.com/nar/article/49/3/1294/6090303 by guest on 08 September 2021
B Simulation DC
10–1 15 % Condensin 100 % Condensin
Mean MSD (µm2)
15% Condensin 0.2 0.2
α = 0.52
0.1 0.1
10–2
y (µm)
0 0 2
time (s)
−0.1 −0.1 1
100% Condensin
α = 0.38 −0.2 −0.2
10–3 −0.2 −0.1 0 0.1 0.2 −0.2 −0.1 0 0.1 0.2
0
10–2 10–1 100 x (µm) x (µm)
∆t (sec)
C Simulation LE
10–1
15 % Condensin 100 % Condensin
Mean MSD (µm2)
100% Condensin 0.2 0.2
α = 0.54
0.1 0.1
10–2
y (µm)
y (µm)
0 0 2
time (s)
−0.1 −0.1 1
15% Condensin
α = 0.51
10–3 −0.2
−0.2 −0.1 0 0.1 0.2
−0.2
−0.2 −0.1 0 0.1 0.2
0
10–2 10–1 100 x (µm) x (µm)
∆t (sec)
Figure 5. Analysis of mitotic chromatin mobility reduction. (A) Experimental MSD analysis of cells in interphase (blue), mitosis (red) and in mitosis
following condensin depletion (magenta). 595 interphase trajectories, 271 mitotic control and 149 mitotic without condensin (- condensin) trajectories
were analyzed. We calculate an average exponent of power law fits to the MSD of each trajectory up to 0.5 s, resulting in the histograms of exponents
shown in Supplementary Figure 5A, as well as confidence intervals reported in the text. The solid lines are guide power laws with the respective exponents
for comparison. Examples of pseudocolor trajectories in interphase and mitosis during a 2 s window are shown on the right. (B, C) in silico MSD plots
during interphase (blue) or mitotic (red) conditions during simulations of the diffusion capture (B) and loop extrusion models (C). Two-second traces
were analyzed every 30th second during 10 simulation repeats. The mean and confidence intervals are calculated from histograms of exponents to each 2-s
trajectory as above, with the mean shown as guide power laws in the plot. Examples of in silico bead trajectories are shown on the right.
sion models (Figure 6B and C). Increasing condensin to- tationally detect (Figure 6D). The effect might be more pro-
wards mitotic levels barely affected the anisotropy of move- nounced in vivo where additional chromosome-bound pro-
ments in the loop extrusion model. In contrast, it resulted teins might augment any constraints. The overall more dy-
in a dose-dependent η̄ increase in case of the diffusion cap- namic nature of the chromatin chain in the loop extrusion
ture model (Supplementary Figure S6). Qualitatively, there- model did not create a similar phenomenon.
fore, diffusion capture led to increased anisotropy of chro-
matin movement. Quantitatively the resultant anisotropy
remained below that experimentally observed. We imagine Condensin cluster formation within mitotic chromosomes
that condensin binding site clustering in the diffusion cap- Given the above contrasting observations of how diffusion
ture model results in a chromatin topology that constrains capture and loop extrusion impact on mitotic chromosome
chromatin chain movement in certain directions, thus creat- behavior, we wanted to directly visualize the emergent 3D
ing local anisotropy that we can experimentally and compu- organization of condensin inside mitotic chromosomes. ToYou can also read