Computer Vision-Based Patched and Unpatched Pothole Classification Using Machine Learning Approach Optimized by Forensic-Based Investigation ...
←
→
Page content transcription
If your browser does not render page correctly, please read the page content below
Hindawi
Complexity
Volume 2021, Article ID 3511375, 17 pages
https://doi.org/10.1155/2021/3511375

Research Article
Computer Vision-Based Patched and Unpatched Pothole
Classification Using Machine Learning Approach Optimized by
Forensic-Based Investigation Metaheuristic

 Nhat-Duc Hoang ,1,2 Thanh-Canh Huynh ,1,2 and Van-Duc Tran 2,3

 1
 Institute of Research and Development, Duy Tan University, Da Nang 550000, Vietnam
 2
 Faculty of Civil Engineering, Duy Tan University, Da Nang 550000, Vietnam
 3
 International School, Duy Tan University, Da Nang 550000, Vietnam

 Correspondence should be addressed to Nhat-Duc Hoang; hoangnhatduc@duytan.edu.vn

 Received 29 April 2021; Revised 21 July 2021; Accepted 25 August 2021; Published 6 September 2021

 Academic Editor: Gonzalo Farias

 Copyright © 2021 Nhat-Duc Hoang et al. This is an open access article distributed under the Creative Commons Attribution License,
 which permits unrestricted use, distribution, and reproduction in any medium, provided the original work is properly cited.

 During the phase of periodic asphalt pavement survey, patched and unpatched potholes need to be accurately detected. This study
 proposes and verifies a computer vision-based approach for automatically distinguishing patched and unpatched potholes. Using
 two-dimensional images, patched and unpatched potholes may have similar shapes. Therefore, this study relies on image texture
 descriptors to delineate these two objects of interest. The texture descriptors of statistical measurement of color channels, the gray-
 level cooccurrence matrix, and the local ternary pattern are used to extract texture information from image samples of asphalt
 pavement roads. To construct a classification model based on the extracted texture-based dataset, this study proposes and validates
 an integration of the Support Vector Machine Classification (SVC) and the Forensic-Based Investigation (FBI) metaheuristic. The
 SVC is used to generalize a classification boundary that separates the input data into two class labels of patched and unpatched
 potholes. To optimize the SVC performance, the FBI algorithm is utilized to fine-tune the SVC hyperparameters. To establish the
 hybrid FBI-SVC framework, an image dataset consisting of 600 samples has been collected. The experiment supported by the
 Wilcoxon signed-rank test demonstrates that the proposed computer vision is highly suitable for the task of interest with a
 classification accuracy rate � 94.833%.

1. Introduction Poorly maintained asphalt pavements lead to a vast
 number of traffic accidents. According to the record of
The network of asphalt pavement roads is a crucial element WHO [6], the number of people lives taken by traffic crashes
of infrastructure in modern societies [1–4]. As pointed out is roughly 1.35 million per year. Moreover, traffic accidents
by [5], asphalt pavement roads significantly support social cost most nations 3% of their gross domestic product.
interaction as well as economic development. In many re- Particularly in Vietnam, there were 14.510 traffic accident
gions in the world, economic growth is correlated with the cases in 2020 alone; these accidents caused the death of 6700
extension of asphalt pavement networks. Nevertheless, since people and injured 10840 ones [7]. Thus, the proper survey
these networks are constantly expanded in recent decades, on the road status and timely maintenance is crucial for
maintaining them becomes a costly and arduous task es- identifying and restoring pavement defects. These can help
pecially for developing countries like Vietnam. It is because to reduce the number of traffic accidents.
the financial resources of developing countries are often Among various types of asphalt pavement distress (e.g.,
restricted and central governments or provincial authorities cracks, potholes, patches, raveling, bleeding, depression,
are struggling to find a balance between the funding used to etc.), potholes are easily encountered and have been rec-
construct new road networks and the funding needed to ognized as a dangerous type of defect. Potholes are typically
recover deteriorated existing ones. observed as bowl-shaped holes in the pavement surface

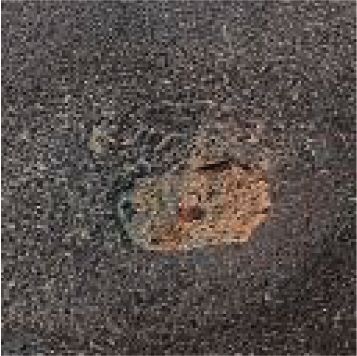
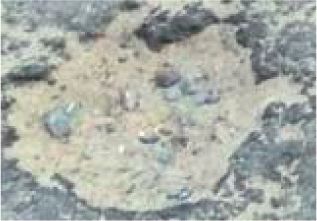
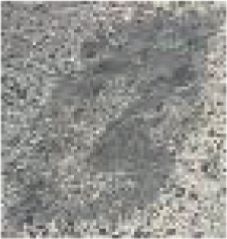
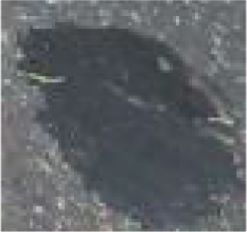
2 Complexity

caused by the removal of surfacing materials (refer to Fig- authors employ 70 image samples for testing and obtain a
ure 1). This type of defect causes a sudden change in road classification accuracy of 85%.
elevation and creates hazardous situations for drivers es- A pothole recognition and evaluation scheme based on
pecially in the cases of inclement weather conditions (e.g., 2D shape analysis, image coarseness comparison, and image
heavy rainfall). Therefore, pavement roads damaged by thresholding techniques has been proposed in [11]. Buza
potholes must be quickly identified and maintained to re- et al. [12] put forward an unsupervised learning method
cover smooth-running surfaces [5]. based on image processing techniques and spectral clus-
 Patching is the common technique employed to deal tering. Sundra Murthy and Varaprasad [13] employ histo-
with pavement potholes (refer to Figure 2). Pavement gram analysis, edge detection, and contour following to deal
patching involves the processes of filling potholes with with the task of interest. Ryu et al. [14] attempt to improve an
surfacing materials such as hot mix asphalt or asphalt existing intelligent transportation system service by the
emulsion mixes. To enhance the efficiency of the pavement utilization of a 2D image-based pothole detection with image
recovering task, patching should be performed timely when processing techniques of segmentation, region extraction,
potholes are early formed. If left unpatched, potholes can be and morphological filtering. A novel approach based on
the cause of serious traffic crashes and human casualties semantic texton forests used with 2D video frames has been
especially for motorcycle drivers. Moreover, it is beneficial to proposed in [15]. Kamaliardakani et al. [16] employ a
prevent water intrusion into the pavement structure as soon heuristic thresholding method for detecting sealed crack
as possible. Water intrusion has been seen as the main factor damages. Fuzzy c-means clustering algorithm and mor-
that deepens potholes or triggers other severe failures in the phological reconstruction have been utilized by [17] for
asphalt pavement surface. These facts emphasize the im- recognizing potholes on asphalt pavement based on 2D-
portance of periodic pavement surveys and timely as well as color images.
the correct identification of potholes. Encouraged by the successes of image processing
 In many developing countries, pavement surveys based techniques applied in pothole detection, more recent works
on human technicians and the manual process of pavements’ have explored the feasibility of advanced supervised machine
visual data processing are still required and performed by learning models in dealing with the task at hand. Yousaf et al.
local authorities or traffic management agencies. Although [5] construct a support vector machine (SVM) trained by a
these processes can attain high accuracy of pavement set of scale-invariant feature transform (SIFT) features for
evaluation, the manual process is painstakingly low in recognizing potholes in labeled images. A machine learning-
productivity. Moreover, a large and expanding network of based approach using least squares support vector machine
asphalt pavements slows down the pavement survey process and neural network with steerable filter-based feature ex-
and makes timely detection of pavement distresses an im- traction has been proposed in [18]. Maeda et al. [19] and Cao
possible mission. Another issue of the manual process is that et al. [20] recently put forward deep neural network-based
the survey outcome is considerably affected by subjective approaches for recognizing asphalt pavement defects in-
judgments of human inspectors. Therefore, scholars and cluding potholes.
practitioners are increasingly relied on automated ap- Overall, there is an increasing trend of applying image
proaches to improving the productivity and objectivity of processing and machine learning methods for pothole de-
periodic road pavement surveys. tection using 2D digital images. This trend in the academic
 In recent years, due to the availability of low-cost digital community has been recognized by previous reviewing
cameras and rapid advancement of 2-dimensional (2D) works of [21–23]. In line with this trend of study and
digital image processing techniques, computer vision has motivated by the fact that asphalt pavement roads in dif-
gained popularity and has been proven to be a feasible tool ferent regions may exhibit different surfacing features due to
for asphalt pavement surveys. Nevertheless, computer vi- various factors including the use of surfacing materials,
sion-based automatic pothole detection still presents a construction methods, traffic loads, and other weather/local
challenging task due to the complex nature of the asphalt conditions, it is necessary to investigate other advanced
pavement background. Pavement distresses often coexist image processing and machine learning solutions for dealing
with noisy signals caused by stains, irregular lighting con- with the task of automatic pothole detection. The reason is
ditions, traffic marks, etc. that because of discrepancies in characteristics of asphalt
 Accordingly, various computer vision-based methods pavement roads, a data-driven method can obtain good
have been proposed in the literature to deal with the problem detection accuracy for a certain study area but it may not
of pavement pothole recognition. Zhou et al. [8] propose a perform well on image data collected from other study
replacement of a low-speed human-based approach using an regions.
integrated image processing system; this system mainly More importantly, it is necessary for road surveying
relies on discrete wavelet transform for asphalt pavement systems to be able to distinguish between unpatched pot-
distress classification. A comparative study performed in [9] holes and patched potholes. The reason is that if patched
assesses several multiresolution texture analysis methods objects are correctly identified, the false positive rate of the
based on a wavelet, ridgelet, and curvelet-based texture pothole detection process can be reduced. In addition, as
extractors used for pothole detection. Koch and Brilakis [10] pointed out in previous studies [24–26], patched areas are
rely on histogram shape-based thresholding coupled with considered pavement defects and they should be detected
morphological operators to isolate pothole shape; the with high accuracy. As observed from Figures 1 and 2, it can

Complexity 3

 Figure 1: Appearances of potholes in the asphalt pavement surface.

 Figure 2: Appearances of patched potholes in the asphalt pavement surface.

be argued that using 2D image samples, potholes and image samples. The next section describes the structure of
patched potholes can have similar shapes. Therefore, image the proposed integration of FBI optimized SVM used for
texture analysis used for extracting the coarseness of image pothole-patched pothole detection. The fourth section re-
regions is helpful to recognize them. Texture descriptors ports experimental results. Concluding remarks of this study
[27–42] have been proved to be highly useful for image are stated in the final section.
classification in various fields. In this study, the highly
discriminative local ternary pattern is employed. 2. Research Methodology
 In addition, based on the current literature, it can be seen
that pothole detection methods have mainly relied on in- This section of the article reviews the employed research
dividual machine learning methods. Integrations of machine method including image texture used for feature extraction,
learning and metaheuristic approaches have rarely been the machine learning approach of SVM used for pattern
investigated for the task at hand. In various fields, the recognition, the FBI metaheuristic used for model optimi-
successful utilization of metaheuristics in optimizing ma- zation, and the collected pavement image dataset.
chine learning models has been demonstrated [43–46].
Nevertheless, the applications of such hybrid scheme for
 2.1. Image Texture Analysis. In the image processing field,
pothole recognition are still limited.
 the texture is a crucial tool used for visual perception and has
 Thus, the current study is an attempt to fill this gap in the
 been the core of many computer vision systems. Texture
literature by proposing a machine learning-metaheuristic
 analysis is used to represent the degree of coarseness or
integration for coping with the problem of interest. The
 fineness of objects within digital image samples. This type of
employed machine learning model is SVM [47] because this
 analysis has been widely used in various fields of study
machine learning method has been proven to be a highly
 including civil engineering [51], remote sensing [52], bio-
capable tool for pattern recognition especially for asphalt
 medical imaging [53], and industrial engineering [54, 55].
pavement image data [5, 48, 49]. To further optimize the
 Based on the collected image samples, meaningful features
performance of the SVM model used for the task of the
 that represent the texture properties of image regions can be
pothole and patched pothole detection, this study relies on a
 computed and used for object classification [34]. In this
newly proposed metaheuristic of Forensic-Based Investi-
 study, statistical measurement of image pixel intensity, gray-
gation (FBI) [50]. FBI is a novel metaheuristic motivated by
 level cooccurrence matrix’s properties, and local ternary
the suspect investigation-location-pursuit process that is
 pattern are the utilized texture descriptors used for dis-
used by police officers and its performance has been con-
 tinguishing between potholes and patched potholes.
firmed by various optimization tasks. Accordingly, the
current work proposes combining the two methods of SVM
and FBI to establish an integrated data-driven model utilized 2.1.1. Statistical Properties of Color Texture. Given an image
for computer vision-based pothole-patched pothole sample I within which there are 3 color channels of red (R),
recognition. green (G), and blue (B), a first-order histogram P(I) can be
 The subsequent parts of the study are organized as calculated for each channel to represent its statistical dis-
follows. The second section reviews the research method- tribution [56]. Based on the computed first-order histogram
ology including the techniques of image texture analysis, the of the three color channels (R, G, and B), the indices of mean
computational intelligence approaches, and a set of collected (μc ), standard deviation (σ c ), the skewness (δc ), kurtosis
4 Complexity

(ηc ), entropy (ρc ), and range (Δc ) are computed separately Ng Ng
for each channel. Since each channel yields 6 color texture- ET � − PN N
 (10)
 δ (i, j)log Pδ (i, j) ,
based indices, the total number of extracted features rep- i�1 j�1
resenting the statistical properties of color texture is
6 × 3 � 18. The equations used for computing the 6 color where Ng is the number of gray-level values. μX , μY , σ X , and
texture-based indices for each color channel c are presented σ Y are the means and standard deviations of the marginal
as follows [51]: distribution associated with PN
 δ (i, j) [51, 57].
 NL−1
 μc � Ii,c × Pc (I), (1) 2.1.3. Local Ternary Pattern (LTP). Putting forward in [61],
 i�0 LTP is an extension of the well-defined Local Binary Pattern
 ������������������� (LBP). LBP [62] is an effective tool for characterizing local

 NL−1
 2
 gray intensity patterns. This method considers a local
 σc � Ii,c − μc × Pc (I), (2) neighborhood around a certain pixel and thresholds the
 i�0 neighboring pixels based on the value of the central pixels.
 Accordingly, a local texture descriptor consisting of a 3 × 3
 3 binary matrix is used to describe the local gray intensity
 NL−1
 i�0 Ii,c − μc × Pc (I)
 δc � , (3) structure of a certain region within an image sample.
 σc3 Tan and Triggs [61] propose using an additional
 thresholding value to construct a ternary structure which
 4
 NL−1
 i�0 Ii,c − μc × Pc (I)
 can be more discriminative and less sensitive to noise in
 ηc � , (4) uniform regions. Therefore, the LTP texture descriptor is
 σc4 highly suitable for modeling gray intensity patterns of as-
 phalt pavement roads. Using the LTP method, the value of
 NL−1
 (5) each thresholded pixel within a local region is either −1, 0, or
 ρc � − Pc (I) × log2 Pc (I) ,
 i�0
 1. Therefore, the computation of LTP is split into two
 separated matrices called a lower pattern and an upper
 Δc � Max Ic − Min Ic , (6) pattern (refer to Figure 3). Similar to the standard LBP,
 histograms of the two aforementioned matrices can be
where NL � 256 denotes the number of discrete intensity calculated and concatenated to establish an integrated tex-
values with an 8-bit image sample. ture discriminator.
 Mathematically speaking, the LTP texture descriptor can
 be described as follows:
2.1.2. Gray-Level Cooccurrence Matrix (GLCM). GLCM 1 if u ≥ ic + t
[57, 58] is a useful image processing tool used for repre- ⎪
 ⎧
 ⎪
 ⎨
senting properties regarding the repeated occurrence of s′ u, ic , t � ⎪ 0 if u − ic < t , (11)
 ⎪
 ⎩
certain gray-level patterns. Herein, the first is the analysis to −1 if u ≤ ic − t
convert an RGB image to a grayscale one [59]. Subsequently,
the relationship between 2 pixels within this grayscale image where ic is the gray intensity of the central pixel. t � 5 denotes
sample is modeled using two parameters: r-the distance an additional threshold. u is the grayscale value of a
relationship and θ-the rotation relationship. Accordingly, a neighboring pixel.
matrix denoting Pδ is used to represent a probability of the
two gray levels of i and j with respect to the relationship
 2.2. Support Vector Machine Classification (SVC). SVC, in-
dictated by r and θ [60]. Based on the normalized Pδ denoted
 troduced by [47], is a powerful supervised learning method
as PNδ , the four indices of the angular second moment (AM), used for multivariate data analysis especially for pattern
contrast (CO), correlation (CR), and entropy (ET) can be
 classification. The model structure of this machine learning
calculated as follows [58]:
 method is trained via the framework of a structural risk
 Ng Ng minimization scheme [63]. This feature helps an SVC model
 AM � PN 2
 (7) to be resilient to noisy data samples and to better guard
 δ (i, j) ,
 i�1 j�1 against overfitting. Given a training dataset set
 D � (x, y)|x ∈ S and y � f(x) and a target function f:
 Ng −1 Ng Ng X ⟶ {−1, +1} (−1 � “patched pothole” and +1 � “pothole”),
 CO � k2 PN the SVM can be used to learn f(x) by constructing an ap-
 δ (i, j),
 k�0 i�1 j�1
 (8) proximated function f(x): X ⟶ {−1, +1}.
 |i−j|�k The overall learning phase of SVC is illustrated in Fig-
 ure 4. The first step of the learning process is to construct a
 N N function to map the data in the original input space into a
 i�1g j�1g i × j × PN
 δ (i, j) − μX μY high-dimensional feature space. It is noted that the original
 CR � , (9)
 σXσY input space consists of numerical data generated from the
Complexity 5

 Upper Pattern
 11000000
 1 1 0
 0 0
 Ternary Code 0 0 0
 110(-1)(-1)000
 1 1 0
 0 -1
 0 0 -1 Lower Pattern
 00011000
 0 0 0
 0 1
 0 0 1
 Figure 3: Demonstration of the LTP texture descriptor.

 The Original Input Space The High-Dimensional Feature space
 xd
 Pothole Kernel Mapping Φ (xl)
 Texture based Features

 Φ (x)
 Pothole

 Hyperplane
 Patched Pothole

 x1
 Φ (xu)
 Texture based Features
 Patched Pothole

 Φ (xv)

 Figure 4: Demonstration of the SVC learning phase.

aforementioned texture descriptors. In such high-dimen- 2.3. Forensic-Based Investigation (FBI). As described in the
sional feature space, a hyperplane can be learnt to act as a previous section, the training phase of an SVC model ne-
decision boundary to separate the input data into two re- cessitates a proper setting of the penalty coefficient C and the
gions of “pothole” and “patched pothole”. To identify this RBKF’s tuning parameter σ. These are two crucial hyper-
hyperplane, it is required to solve the following constrained parameters of SVC. The former expresses the amount of
optimization problem: penalty imposing on misclassified data samples. The latter
 1 1 N specifies the locality of the employed kernel function which
 Minimize Jp (w, e) � wT w + C e2k , (12) affects the generalization of a trained SVC model. Since the
 2 2 k�1
 task of hyperparameter setting can be formulated as an
subjected to yk (wT φ(xk ) + b) ≥ 1 − ek , k � 1, . . . , N, ek ≥ 0. optimization problem, this study relies on the FBI meta-
w ∈ Rn and b∈R denote the parameters of the hyperplane. e heuristic to assist the SVC model’s training phase.
represents the vector of slack variables. C is the penalty FBI [50] is a stochastic search engine motivated by the
coefficient. φ(x) is the aforementioned nonlinear data forensic investigation process. The searching process of this
mapping function. stochastic search engine mimics the real operation of fo-
 A notable advantage of the SVC machine learning rensic investigation which contains five steps: open a case,
method is that it does not require the explicit form of the interpretation of findings, the direction of inquiry, action,
mapping function φ(x). The quantity of interest is the dot and prosecution [64]. The searching process of the FBI can
product of φ(x) denoting a kernel function K(xk, xl). For be broken down into two phases: the investigation phase
nonlinear and multivariate data classification, the commonly (called phase A) and the pursuit phase (called phase B). The
used kernel function is the radial basis kernel function former is carried out by a team of investigators. The latter is
(RBKF) shown as follows: performed by a team of police agents. These two phases are
 �� � repeated until a stopping condition (i.e., a maximum
 �xk − xl ���2
 �
 ⎝−
 K xk , xl � exp⎛ ⎠,
 ⎞ (13) number of iterations) is met.
 2σ 2 In phase A, based on the trace recorded at the current
 location Xij, a new investigation location Xij,new is computed
where σ is a tuning parameter of the kernel function. as follows:
6 Complexity

 Xki + Xhj is SVC. Since SVC is a supervised machine learning method, a
 Xij,new � Xij + r × Xij − , (14) set of labeled image data must be prepared to train its model
 2
 structure. This study has collected 600 asphalt pavement image
where i, k, h ∈∈{1, 2, . . . , NS} denote three investigation samples within which the number of data samples in each class
locations. NS is the total number of search agents. j � 1,2,. . ., (“potholes” and “patched potholes”) is 300. This selection of
D where D is the number of decision variables. r represents a sample size is to guarantee a balanced classification. The label of
random number ∈∈[−1, 1]. each image sample has been assigned by human inspectors. The
 To determine where we should receive more investiga- collected image samples are demonstrated in Figure 5.
tion, the FBI relies on a probability featuring the quality of The image dataset has been collected during field trips of
traces collected at a location. This probability value is the asphalt pavement survey in Da Nang city (Vietnam). The
computed via employed digital cameras are the 18-megapixel resolution
 Canon EOS M10 and the Gopro Hero 9 with 23.6-megapixel
 pmax − pXi resolution. The images were manually taken by human
 P Xij � , (15)
 pmax − pmin inspectors. The camera is positioned at a distance of ap-
 proximately 1 meter above the road surface. The image
where pXi denotes the objective function value of the lo-
 samples have obtained in cloudy weather conditions to
cation Xi. pmax and pmin are the largest and smallest value of
 ensure relatively consistent lighting conditions.
the objective function in the current population,
respectively.
 Based on the computed probability associated with each 3. The Proposed Computer Vision-Based
available location, the updated suspected location is given by Forensic-Based Investigation Metaheuristic
 a2 Optimized Machine Learning for Patched and
 XA2,i � XBest + αb × XA,bj , (16) Unpatched Pothole Detection
 b�1
 This section describes the overall structure of the proposed
 XA2,ij � XBest + XA,dj + rn × XA,ej − XA,fi , (17) model used for automatic detection of the pothole and
 patched pothole. The model is an integration of image pro-
where XBest denotes the best-found location. a2 is the cessing techniques, supervised machine learning-based data
number of locations that influence XA2,i. αb denotes the classification, and metaheuristic optimization. In detail, the
effectiveness coefficient ranging from −1 to 1. rn is a random image texture descriptors including statistical measurements
number generated uniformly within [0, 1]. d, e, f, and i are of color channels, GLCM, and LTP are used to compute
the suspected locations and the first three indices are chosen numerical features of image samples. Based on such extracted
randomly. features, SVC incorporated with the FBI metaheuristic is used
 In phase B, after receiving the report from the investi- to generalize a decision boundary that separates the collected
gation team, each agent Bi moves close to the location that is dataset into two distinctive classes of “patched pothole” and
associated with the highest possibility. This movement is “pothole”. The FBI is utilized to assist the SVC training phase
presented as follows: by optimizing its tuning parameters (the penalty coefficient
 and the RBKF parameter). The overall structure of the pro-
 XB1,ij � rn0 XB,ij + XA,dj + rn1 × XBest − XB,ij , (18)
 posed hybrid model is presented in Figure 6.
where rn0 and rn1 are random numbers generated uniformly The operational flow of the model can be divided into
within [0, 1]. three main steps:
 Subsequently, each agent Bi exchanges information with (i) Feature extraction
other agents to enhance the searching reliability. Thus, the (ii) Model optimization
newly updated suspected location is given by
 (iii) Model prediction and evaluation
 XB2,ij � XB,rj + rn2 × XB,rj − XB,ij + rn3 × XBest − XB,rj ,
 The feature computation module has been programmed
 (19) by the authors in Visual C# .NET. Additionally, the FBI
 optimized SVC module is constructed in a MATLAB en-
 XB2,ij � XB,ij + rn4 × XB,ij − XB,rj + rn5 × XBest − XB,ij , vironment with the built-in functions provided in the Sta-
 (20) tistics and Machine Learning Toolbox [65]. The source code
 of the FBI is provided by [50,66]. The final prediction model
where rn2, rn3, rn4, and rn5 are random numbers generated based on image texture computation and the optimized SVC
uniformly within [0, 1]. model is constructed and compiled in Visual C# .NET with
 the assistance of the Accord.NET Framework [67].
2.4. The Collected Image Dataset. As mentioned earlier, the
main objective of this study is to process digital image samples 3.1. Feature Extraction. In this step, texture descriptors
of asphalt pavements for detecting patched potholes and including statistical measurements of color channels,
unpatched potholes. The employed pattern recognition method GLCM, and LTP are employed to calculate features of the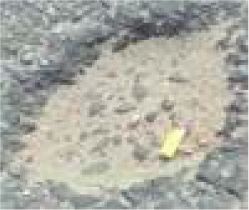
Complexity 7

 (a)

 (b)

Figure 5: Demonstration of the collected image samples: (a) Class label −1 (patched pothole) and (b) Class label +1 (unpatched pothole).

collected image samples. The statistical properties of image Moreover, the lower and the upper bounds of the parameters
color, including three channels (R, G, and B), yield 18 searched by the FBI metaheuristic are set to be 0.001 and
features which are the mean, standard deviation, skewness, 1000, respectively.
kurtosis, entropy, and range. To compute the GLCM-based In order to optimize the SVC model, this study employs
texture, four GLCM with r � 1 and θ � 0o, 45o, 90o, and 135o a 5-fold cross-validation-based objective function. This
are computed as suggested by [57]. Since each matrix yields objective function is mathematically described as follows
four properties of AM, CO, CR, and ET, the number of [69]:
features generated by the GLCM texture descriptor is
4 × 4 � 16. In addition, the LBP feature descriptor produces 5k�1 FNRk + FPRk (22)
 OF � ,
118 features that represent the local structure of grayscale 5
image samples [61]. According to the suggestion of previous where FNRk and FPRk are false negative rate (FNR) and false
works, the threshold t of the LBP is set to be 5 [61, 68]. positive rate (FPR) calculated in the kth run, respectively.
Accordingly, there are 152 texture-based features employed The FNR and FPR indices are calculated according to the
for categorizing patched potholes and potholes. Demon- following equations [69]:
strations of the feature extraction step are provided in
Figure 7. FN
 FNR � , (23)
 Subsequently, the extracted dataset has been randomly FN + TP
divided into a training set (70%) and a testing set (30%). The
 FP
first set is employed for the model construction phase, and FPR � , (24)
the second set is reserved for inspecting the model gener- FP + TN
alization capability. Moreover, to standardize the input data where FN, FP, TP, and TN denote the false negative, false
range, the Z-score equation is employed: positive, true positive, and true negative data samples,
 X D − MX respectively.
 XZ � , (21)
 STDX
 3.3. Model Prediction and Evaluation. In this step, the
where XZ and XD are the normalized and the original texture
 SVM model with the optimized hyperparameters (the
features, respectively. MX and STDX are to the mean value
 penalty coefficient and the RBFK parameter) is con-
and the standard deviation of the texture features,
 structed in Visual C# .NET framework 4.7.2 classify data
respectively.
 instances in the testing set into two categories of “patched
 pothole” and “pothole. Moreover, it is noted that the
3.2. Model Optimization. The FBI metaheuristic with the developed computer program has been implemented on
number of searching agents of 20 and the maximum number the ASUS FX705GE-EW165T (Core i7 8750H and 8 GB
of searching iterations of 100 is used to optimize the SVM Ram) platform.
model. FBI aims at finding an appropriate set of the SVC To evaluate the model prediction capability, a set of
hyperparameters including the penalty coefficient and the performance measurement metrics is used. The employed
RBKF parameter. These hyperparameters strongly affect the performance measurement metric consists of classification
learning and the predictive capability of the SVC model. The accuracy rate (CAR), precision, recall, negative predictive
inappropriate setting of the penalty coefficient and the RBKF value (NPV), F1 score, and area under the receiver operating
parameter may lead to either an overfitted or underfitted characteristic curve (AUC) [70, 71]. The construction of the
model. Hence, the objective of the FBI optimization process receiver operating characteristic curve is provided in [71].
is to identify a set of hyperparameters that demonstrates a The indices of CAR, precision, recall, NPV, and F1 score are
good training accuracy as well as generalization property. calculated according to the following formulas:
8 Complexity

 Asphalt pavement image samples

 Color Channel Statistics

 Gray Level Co-
 Texture Computation
 occurrence Matrix

 Local Ternary Pattern
 Forensic Based Investigation Image Texture Based Dataset
 Cost Function

 5

 0 Training set Random data sampling Testing set
 -5

 2
 1
 0 2 Model Training
 1
 x2 -1 0
 -1
 -2 -2 x1 Texture descriptor xv Φ (xk)
 Kernel Mapping
 Feature space
 Φ (x)

 Input Space
 Texture descriptor xu Φ (xj)
 Optimized SVM hyper-parameters

 Φ (xi)

 Model Prediction

 Texture descriptor xv
 Decision Boundary
 X1
 X2
 The SVC model
 prediction

 XD
 X (Texture data) Texture descriptor xu
 Model performance measurement

 Classification Results

 CAR Precision Recall NPV F1 Score AUC

 Final Prediction Model

Figure 6: The proposed image processing-based Forensic-Based Investigation optimized machine learning for patched and unpatched
pothole detection.
Complexity 9

 Asphalt pavement image sample

 Color Channel Statistics

 Texture Computation Gray Level Co-
 occurrence Matrix

 Local Ternary Pattern

 X1 X2 X3 X4 X5 ... X148 X149 X150 X151 X152
 134.639 132.731 127.946 17.173 15.718 ... 0.040 0.037 0.042 0.038 0.079
 (a)
 Asphalt pavement image sample

 Color Channel Statistics

 Gray Level Co-
 Texture Computation
 occurrence Matrix

 Local Ternary Pattern

 X1 X2 X3 X4 X5 ... X148 X149 X150 X151 X152
 136.287 133.262 130.029 44.936 42.554 ... 0.015 0.014 0.017 0.015 0.041
 (b)

Figure 7: Demonstration of the feature extraction process: (a) a sample of the “patched pothole” class and (b) a sample of the “pothole” class.

 CAR �
 NC
 100%,
 4. Experimental Results and Discussions
 (25)
 NA
 As aforementioned, the FBI is employed to optimize the
 TP SVM-based pothole-patched pothole detection model. Us-
 precision � , (26) ing 20 searching agents and after 100 iterations, the meta-
 TP + FP
 heuristic algorithm has found the best penalty
 TP coefficient � 118.941 and the RBKF parameter � 20.300. The
 recall � , (27) best-found cost function value which is described in
 TP + FN
 equation (22) is 1.047. The FBI algorithm is capable of lo-
 TN cating the most desired values of the searched variables after
 NPV � , (28) 41 iterations. The searching progress of the FIB meta-
 TN + FN
 heuristic is illustrated in Figure 8. It is noted that, in Figure 8,
 2TP the model performance is computed according to equation
 F1 score � , (29)
 2TP + FP + FN (22) which is stated in the previous section.
 As stated earlier, the collected dataset which includes 600
where NC and NA are the numbers of correctly predicted instances has been randomly divided into a training set
data and the total number of data, respectively. As (70%) and a testing set (30%). The former is employed for
mentioned earlier, FN, FP, TP, and TN are the false model construction and the latter is served as novel data
negative, false positive, true positive, and true negative instances for verifying the model’s predictive capability.
data samples, respectively. Additionally, to reliably assess the predictive performance,

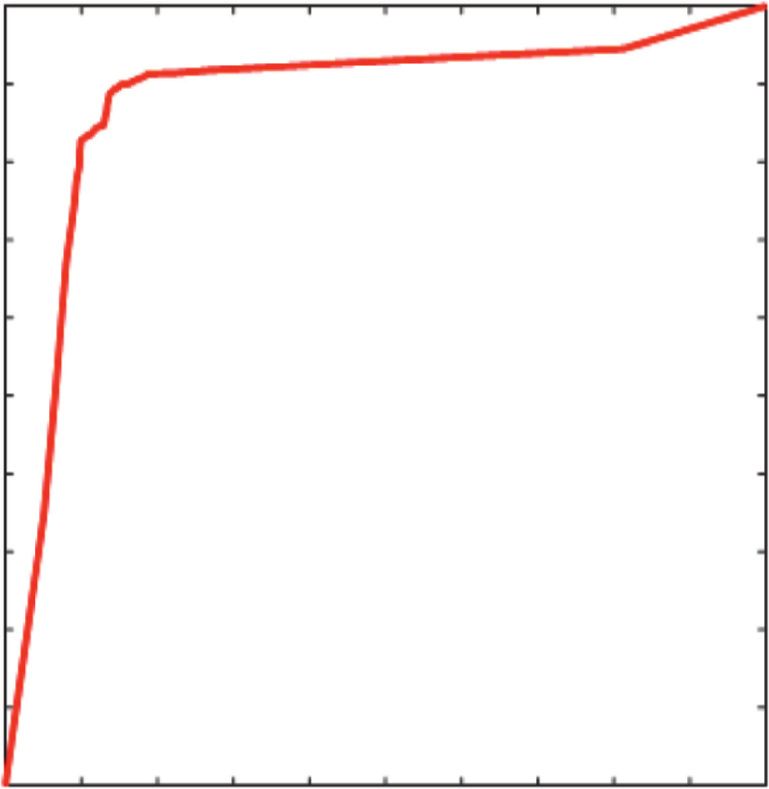
10 Complexity

 1.056

 1.054

 Model Performance
 1.052

 1.05

 1.048

 1.046
 0 20 40 60 80 100
 Generation

 The best found cost function value
 Figure 8: The FBI-based optimization progress.

 Table 1: Experimental result comparison.
 FBI-SVC RVM RFM CTM
Metrics
 Mean Std Mean Std Mean Std Mean Std
CAR (%) 94.833 1.917 90.833 2.152 89.889 2.020 85.889 2.196
Precision 0.935 0.027 0.904 0.026 0.881 0.023 0.869 0.033
Recall 0.964 0.019 0.914 0.028 0.923 0.033 0.847 0.027
NPV 0.963 0.017 0.914 0.026 0.920 0.031 0.851 0.022
F1 score 0.949 0.019 0.909 0.022 0.901 0.021 0.857 0.021
AUC 0.989 0.006 0.962 0.015 0.962 0.010 0.881 0.037

this study has repeated the model training and verification second-best model with the CAR � 90.833%, the pre-
processes 20 independent times. The statistical measure- cision � 0.904, the recall � 0.914, the NPV � 0.914, and the F1
ments attained from this multiple model training and score � and 0.909, followed by the RFM (with the
verification phases are utilized for model evaluation. This CAR � 89.889%, the precision � 0.881, the recall � 0.923, the
process can be helpful in diminishing the variation caused by NPV � 0.920, and the F1 score � 0.901) and CTM (with the
the randomness in data sampling. CAR � 85.889%, the precision � 0.869, the recall � 0.847, the
 In addition, to demonstrate the superiority of the newly NPV � 0.851, and the F1 score � 0.857). The model com-
constructed model, its performance is compared to those of parison in terms of the CAR is illustrated in Figure 9. The
other capable benchmark models including Relevance results of the proposed model and the benchmark approach
Vector Machine (RVM) [72, 73], Random Forest Model with respect to the precision, recall, NPV, and F1 score are
(RFM) [74], and Classification Tree Model (CTM) [75, 76]. provided in Figures 10 and 11 to ease the visual comparison.
RVM is constructed with the source code provided in [73]. Particularly for the AUC index, the FBI-SVC is the best
The RFM and CTM approaches are trained with MATLAB’s model (AUC � 0.989), followed by RVM (AUC � 0.962),
Statistics and Machine Learning Toolbox [65]. It is noted RFM (AUC � 0.962), and CTM (AUC � 0.881). The receiver
that grid search procedures with the fivefold cross-validation operating characteristic curves of the proposed model and
process [77] are employed to set the tuning parameters of the the benchmark model employed for patched pothole–pot-
benchmark models. The RVM’s parameter of basis width is hole classification are demonstrated in Figure 12. A receiver
selected to be 0.01. In addition, the number of individual operating characteristic curve (ROC) is a graphical plot
decision trees used in the RFM is 50 and the parameter of widely used for diagnosing the predictive capability of
minimum leaf size is 1. classification models. ROC and AUC are crucial metrics
 The model prediction results are reported in Table 1 that because they include important predictive outcomes in
shows the mean and standard deviation (Std) of each per- terms of FPR and TPR in one plot. As can be observed from
formance measurement index obtained from the testing Figure 12, the AUC of FBI-SVC is very close to 1 meaning
process. As seen from this table, the proposed integration of that it has achieved a highly accurate predictive result.
FBI and SVC (denoted as FBI-SVC) has achieved the most Furthermore, the box plots of CAR, F1 score, and AUC are
desired predictive performance in terms of the provided in Figures 13–15.
CAR � 94.833%, the precision � 0.935, the recall � 0.964, the Particularly, Figure 14 displays the models’ performance
NPV � 0.963, and the F1 score � 0.949. The RVM is the in terms of the F1-score. This index is an important and
Complexity 11

 CAR (%)
 96 94.833
 94
 92 90.833
 89.889
 90
 88
 85.889
 86
 84
 82
 80
 FBI-SVC RVM RFM CTM

 CAR (%)
 Figure 9: Performance comparison with respect to the CAR.

 0.98
 0.964 0.963
 0.96

 0.94 0.935
 0.923 0.920
 0.92 0.914 0.914
 0.904
 0.9
 0.881
 0.88 0.869
 0.86 0.851
 0.847
 0.84

 0.82

 0.8

 0.78
 FBI-SVC RVM RFM CTM
 Prec
 Recall
 NPV
 Figure 10: Performance comparison with respect to precision, recall, and NPV.

 1.000 0.989

 0.962 0.962
 0.949
 0.950

 0.909
 0.901
 0.900
 0.881
 0.857
 0.850

 0.800

 0.750
 FBI-SVC RVM RFM CTM

 F1 score
 AUC
 Figure 11: Performance comparison with respect to the F1 score and AUC.
12 Complexity

 1.00 1.00

 0.90 0.90

 0.80 0.80

 0.70 0.70
 True Positive Rate (TPR)

 True Positive Rate (TPR)
 0.60 0.60

 0.50 0.50

 0.40 0.40

 0.30 0.30

 0.20 0.20

 0.10 0.10

 0.00 0.00
 0.00 0.10 0.20 0.30 0.40 0.50 0.60 0.70 0.80 0.90 1.00 0.00 0.10 0.20 0.30 0.40 0.50 0.60 0.70 0.80 0.90 1.00
 False Positive Rate (FPR) False Positive Rate (FPR)
 (a) (b)
 1.00 1.00

 0.90 0.90

 0.80 0.80

 0.70 0.70
 True Positive Rate (TPR)

 True Positive Rate (TPR)

 0.60 0.60

 0.50 0.50

 0.40 0.40

 0.30 0.30

 0.20 0.20

 0.10 0.10

 0.00 0.00
 0.00 0.10 0.20 0.30 0.40 0.50 0.60 0.70 0.80 0.90 1.00 0.00 0.10 0.20 0.30 0.40 0.50 0.60 0.70 0.80 0.90 1.00
 False Positive Rate (FPR) False Positive Rate (FPR)
 (c) (d)

 Figure 12: ROCs of the prediction models: (a) FBI-SVC, (b) RVM, (c) RFM, and (d) CTM.

representative measurement of predictive accuracy. The F1- signed-rank test [78] with the significant level (p value) � 0.05.
score is a combination of the precision and recall indices. In The crucial indices of CAR, F1 score, and AUC are the
other words, this performance measurement metric is the subjects of the Wilcoxon signed-rank test. The test outcomes
harmonic mean of precision and recall. The possible value of of pairwise model comparison are reported in Tables 2–4,
the F1-score ranges from 0 and 1; 1 indicates a perfect respectively. Evidently, with p values
Complexity 13

 95

 CAR (%)
 90

 85

 FBI-SVC RVM RFM CTM
 Classification Models
 Figure 13: Box plot of CAR values obtained from the employed machine learning models.

 0.95
 F1 Score

 0.9

 0.85

 FBI-SVC RVM RFM CTM
 Classification Models
 Figure 14: Box plot of F1 score values obtained from the employed machine learning models.

 1

 0.95
 AUC

 0.9

 0.85

 0.8

 FBI-SVC RVM RFM CTM
 Classification Models
 Figure 15: Box plot of AUC values obtained from the employed machine learning models.

 Table 2: p values obtained from the Wilcoxon signed-rank test results with CAR index.
Models FBI-SVC RVM RFM CTM
FBI-SVC X 0.00011 0.00009 0.00009
RVM 0.00011 X 0.21156 0.00014
RFM 0.00009 0.21156 X 0.00023
CTM 0.00009 0.00014 0.00023 X
14 Complexity

 Table 3: p values obtained from Wilcoxon signed-rank test results with F1 score index.
Models FBI-SVC RVM RFM CTM
FBI-SVC X 0.00010 0.00009 0.00009
RVM 0.00010 X 0.29588 0.00014
RFM 0.00009 0.29588 X 0.00019
CTM 0.00009 0.00014 0.00019 X

 Table 4: p values obtained from Wilcoxon signed-rank test results with AUC index.
Models FBI-SVC RVM RFM CTM
FBI-SVC X 0.00009 0.00010 0.00009
RVM 0.00009 X 0.76520 0.00009
RFM 0.00010 0.76520 X 0.00013
CTM 0.00009 0.00009 0.00013 X

 Image Samples Actual Class Predicted Class

 Patched Pothole Pothole

 (a)

 Patched Pothole Pothole

 (b)

 Pothole Patched Pothole

 (c)

 Pothole Patched Pothole

 (d)

 Figure 16: Illustrations of misclassified cases.

cases of irregular lighting conditions and a pothole cover information attained by such surveys needs to be processed
by a layer of dirt have caused false predictions of patched in a timely manner. To expedite this visual information
potholes as shown in Figures 16(c) and 16(d). This in- processing, this study proposes an intelligent model for
dicates that more efforts should be needed to deal with automatically identifying patched potholes and unpatched
such irregular scenarios and improve the model predic- potholes. Potholes are widely encountered pavement distress
tion accuracy. and may cause serious damages to vehicles as well as human
 casualties. However, based on 2D digital images, potholes
5. Concluding Remarks and patched potholes can have similar shapes. Therefore,
 this study has proposed employing image texture infor-
Asphalt pavements play a very important role in the national mation to delineate these two objects.
and local transportation networks. Timely information re- With such research motivations, this study has relied on
garding the distresses appearing on pavement surface is image texture descriptors of statistical information of color
crucial for pavement management agencies to make a cost- channels, GLCM, and LTP. These three texture descriptors
effective decision on maintenance method and schedule. To are employed to extract useful information regarding the
obtain accurate and up-to-date information on the ser- coarseness/fineness of image regions containing patched and
viceability of asphalt pavement road sections, periodic unpatched potholes. An image set consisting of 600 asphalt
surveys need to be performed regularly and the visual pavement image samples has been collected and used to
Complexity 15

construct a texture-based dataset. Within this dataset, the [3] J. Li, G. Liu, T. Yang, J. Zhou, and Y. Zhao, “Research on
number of data samples in each category is 300. Using the relationships among different distress types of asphalt
established texture-based dataset, a novel machine learning pavements with semi-rigid bases in China using association
approach that hybridizes the SVC pattern classifier and the rule mining: a statistical point of view,” Advances in Civil
FBI metaheuristic has been proposed to construct a decision Engineering, vol. 2019, Article ID 5369532, 15 pages, 2019a.
 [4] W. Li, R. Deng, Y. Zhang, Z. Sun, X. Hao, and J. Huyan,
boundary that can deliver prediction of the class labels.
 “Three-dimensional asphalt pavement crack detection based
 The experimental outcomes supported by the Wilcoxon on fruit fly optimisation density peak clustering,” mathe-
signed-rank test show that the FBI-SVC model is superior to matical problems in engineering, vol. 2019, no. 5, 15 pages,
those of the benchmark approaches. Good classification Article ID 4302805, 2019b.
results with CAR � 94.833%, precision � 0.935, recall- [5] M. H. Yousaf, K. Azhar, F. Murtaza, and F. Hussain, “Visual
 � 0.964, NPV � 0.963, F1 score � 0.949, and AUC � 0.989 analysis of asphalt pavement for detection and localization of
show that the proposed FBI-SVC is well suited for the task of potholes,” Advanced Engineering Informatics, vol. 38,
patched-unpatched pothole classification. Further exten- pp. 527–537, 2018.
sions of the current research work may include the [6] WHO, Road Traffic Injuries, World Health Organization,
following: Geneva, Switzerland, 2020, https://wwweuroint.
 [7] VNN, Traffic Accidents Claim 6,700 Lives this Year, Viet Nam
 (i) The application of the FBI-SVC to detect other News Society, Hanoi, Vietnam, 2020, https://vietnamnewsvn/
 forms of pavement distresses (e.g., alligator crack, society/835944/traffic-accidents-claim-6700-lives-this-yearhtml.
 raveling, blurred traffic marks, etc.) [8] J. Zhou, P. Huang, and F.-P. Chiang, “Wavelet-based pave-
 (ii) The investigation of other advanced texture de- ment distress detection and evaluation,” Optical Engineering,
 vol. 45, no. 2, Article ID 027007, 2006.
 scriptors for characterizing local structure or pat-
 [9] F. Moghadas Nejad and H. Zakeri, “A comparison of multi-
 tern of image regions containing pavement resolution methods for detection and isolation of pavement
 distresses distress,” Expert Systems with Applications, vol. 38, no. 3,
 (iii) Collecting more image samples to enhance the pp. 2857–2872, 2011.
 generalization and applicability of the current [10] C. Koch and I. Brilakis, “Pothole detection in asphalt pave-
 computer vision method ment images,” Advanced Engineering Informatics, vol. 25,
 no. 3, pp. 507–515, 2011.
 [11] G. M. Jog, C. Koch, M. Golparvar-Fard, and I. Brilakis,
Data Availability “Pothole properties measurement through visual 2D recog-
 nition and 3D reconstruction,” in Computing in Civil Engi-
The dataset used to support the findings of this study has
 neeringAmerican Society of Civil Engineers, Reston, VA,
been deposited in the repository of GitHub at https://github. USA, 2012.
com/ndhoangdtu/patch_unpatchpothole_fbi_svc. The first [12] E. Buza, S. Omanovic, and A. Huseinovic, “Pothole detection
152 columns of the data are texture-based features extracted with image processing and spectral clustering,” in Proceedings
from image samples. The last column is the ground-truth of the 2nd International Conference on Information Technology
label of the data instances with −1 � “patched potholes” and and Computer Networks, 2013, Antalya, Turkey, 2013.
1 � “unpatched potholes.” [13] S. Bharadwaj Sundra Murthy and G. Varaprasad, “Detection
 of potholes in autonomous vehicle,” IET Intelligent Transport
 Systems, vol. 8, no. 6, pp. 543–549, 2014.
Conflicts of Interest [14] S.-K. Ryu, T. Kim, and Y.-R. Kim, “Image-based pothole
The authors confirm that there are no conflicts of interest detection system for ITS service and road management sys-
regarding the publication. tem,” Mathematical Problems in Engineering, vol. 2015, Ar-
 ticle ID 9683361, 10 pages, 2015.
 [15] S. C. Radopoulou, I. Brilakis, K. Doycheva, and C. Koch, “A
Acknowledgments framework for automated pavement condition monitoring,”
 Construction Research Congress 2016, vol. 2016, 2016.
This research was funded by Vietnam National Foundation [16] M. Kamaliardakani, L. Sun, and M. K. Ardakani, “Sealed-
for Science and Technology Development (NAFOSTED) crack detection algorithm using heuristic thresholding ap-
under grant number 107.01-2019.332. proach,” Journal of Computing in Civil Engineering, vol. 30,
 no. 1, Article ID 04014110, 2016.
References [17] Y. O. Ouma and M. Hahn, “Pothole detection on asphalt
 pavements from 2D-colour pothole images using fuzzy c-means
 [1] T. Dettenborn, A. Hartikainen, and L. Korkiala-Tanttu, clustering and morphological reconstruction,” Automation in
 “Pavement maintenance threshold detection and network- Construction, vol. 83, pp. 196–211, 2017.
 level rutting prediction model based on Finnish road data,” [18] N.-D. Hoang, “An artificial intelligence method for asphalt
 Journal of Infrastructure Systems, vol. 26, no. 2, Article ID pavement pothole detection using least squares support vector
 04020016, 2020. machine and neural network with steerable filter-based fea-
 [2] G. M. Hadjidemetriou, J. Masino, S. E. Christodoulou, ture extraction,” Advances in Civil Engineering, vol. 2018,
 F. Gauterin, and I. Brilakis, “Comprehensive decision support Article ID 7419058, 12 pages, 2018.
 system for managing asphalt pavements,” Journal of Trans- [19] H. Maeda, Y. Sekimoto, T. Seto, T. Kashiyama, and H. Omata,
 portation Engineering, Part B: Pavements, vol. 146, no. 3, “Road damage detection and classification using deep neural
 Article ID 06020001, 2020. networks with smartphone images,” Computer-Aided Civil
16 Complexity

 and Infrastructure Engineering, vol. 33, no. 12, pp. 1127–1141, [36] A. Ledoux, O. Losson, and L. Macaire, “Color local binary
 2018. patterns: compact descriptors for texture classification,”
[20] M.-T. Cao, Q.-V. Tran, N.-M. Nguyen, and K.-T. Chang, Journal of Electronic Imaging, vol. 25, no. 6, p. 12, Article ID
 “Survey on performance of deep learning models for detecting 061404, 2016.
 road damages using multiple dashcam image resources,” [37] L. Liu, J. Chen, P. Fieguth, G. Zhao, R. Chellappa, and
 Advanced Engineering Informatics, vol. 46, Article ID 101182, M. Pietikäinen, “From BoW to CNN: two decades of texture
 2020a. representation for texture classification,” International Jour-
[21] W. Cao, Q. Liu, and Z. He, “Review of pavement defect nal of Computer Vision, vol. 127, no. 1, pp. 74–109, 2019.
 detection methods,” IEEE Access, vol. 8, pp. 14531–14544, [38] M. M. P. Petrou and S.-I. Kamata, Image Processing Dealing
 2020b. with Texture, Wiley, Hoboken, NJ, USA, 2021.
[22] C. Koch, K. Georgieva, V. Kasireddy, B. Akinci, and [39] S. Ranjbar, F. M. Nejad, and H. Zakeri, “An image-based
 P. Fieguth, “A review on computer vision based defect de- system for asphalt pavement bleeding inspection,” Interna-
 tection and condition assessment of concrete and asphalt civil tional Journal of Pavement Engineering, pp. 1–17, 2021.
 infrastructure,” Advanced Engineering Informatics, vol. 29, [40] F. Tajeripour and S. Fekri-Ershad, “Developing a novel ap-
 no. 2, pp. 196–210, 2015. proach for stone porosity computing using modified local
[23] B. F. Spencer Jr., V. Hoskere, and Y. Narazaki, “Advances in binary patterns and single scale retinex,” Arabian Journal for
 computer vision-based civil infrastructure inspection and Science and Engineering, vol. 39, no. 2, pp. 875–889, 2014.
 monitoring,” Engineering, vol. 5, no. 2, pp. 199–222, 2019. [41] J.-H. Yuan, H.-D. Zhu, Y. Gan, and L. Shang, “Enhanced local
[24] G. M. Hadjidemetriou, P. A. Vela, and S. E. Christodoulou, ternary pattern for texture classification,” in Intelligent
 “Automated pavement patch detection and quantification Computing Theory, D.-S. Huang, V. Bevilacqua, and
 using support vector machines,” Journal of Computing in Civil P. Premaratne, Eds., Springer International Publishing,
 Engineering, vol. 32, no. 1, Article ID 04017073, 2018. Cham, Switzerland, pp. 443–448, 2014.
[25] N.-D. Hoang, “Image processing based automatic recognition [42] X. Zhao, L. Xue, and F. Xu, “Asphalt pavement paving seg-
 of asphalt pavement patch using a metaheuristic optimized regation detection method using more efficiency and quality
 machine learning approach,” Advanced Engineering Infor- texture features extract algorithm,” Construction and Building
 matics, vol. 40, pp. 110–120, 2019b. Materials, vol. 277, Article ID 122302, 2021.
[26] S. C. Radopoulou and I. Brilakis, “Patch detection for [43] M. E. A. Ben Seghier, H. Ouaer, M. A. Ghriga, N. A. Menad,
 pavement assessment,” Automation in Construction, vol. 53, and D.-K. Thai, “Hybrid soft computational approaches for
 pp. 95–104, 2015.
 modeling the maximum ultimate bond strength between the
[27] L. Armi and S. Fekri-Ershad, “Texture image analysis and
 corroded steel reinforcement and surrounding concrete,”
 texture classification methods - a review,” arXiv:190406554
 Neural Computing and Applications, vol. 33, no. 12,
 [csCV], 2019.
 pp. 6905–6920, 2021.
[28] I. El khadiri, A. Chahi, Y. El merabet, Y. Ruichek, and
 [44] J.-S. Chou and N.-M. Nguyen, “Metaheuristics-optimized
 R. Touahni, “Local directional ternary pattern: a new texture
 ensemble system for predicting mechanical strength of
 descriptor for texture classification,” Computer Vision and
 reinforced concrete materials,” Structural Control and Health
 Image Understanding, vol. 169, pp. 14–27, 2018.
[29] Y. El merabet, Y. Ruichek, and A. El idrissi, “Attractive-and- Monitoring, vol. 28, no. 5, Article ID e2706, 2021.
 [45] X. Li, Y. Li, Y. Zhang, F. Liu, and Y. Fang, “Fault diagnosis of
 repulsive center-symmetric local binary patterns for texture
 classification,” Engineering Applications of Artificial Intelli- belt conveyor based on support vector machine and grey wolf
 gence, vol. 78, pp. 158–172, 2019. optimization,” Mathematical Problems in Engineering,
[30] S. Fekri-Ershad, “Cell phenotype classification using multi vol. 2020, pp. 1–10, Article ID 1367078, 2020.
 threshold uniform local ternary patterns in fluorescence [46] Z. M. Yaseen, H. Faris, N. Al-Ansari, and J. Vega, “Hybridized
 microscope images,” Multimedia Tools and Applications, extreme learning machine model with salp swarm algorithm:
 vol. 80, no. 8, pp. 12103–12116, 2021. a novel predictive model for hydrological application,”
[31] S. Fekri-Ershad and F. Tajeripour, “Multi-resolution and Complexity, vol. 2020, Article ID 8206245, 14 pages, 2020.
 noise-resistant surface defect detection approach using new [47] V. N. Vapnik, Statistical Learning Theory, John Wiley & Sons,
 version of local binary patterns,” Applied Artificial Intelli- Inc., Hoboken, NJ, USA, 1998.
 gence, vol. 31, no. 5-6, pp. 395–410, 2017. [48] G. M. Hadjidemetriou, S. E. Christodoulou, and P. A. Vela,
[32] N.-D. Hoang, “Image processing-based spall object detection “Automated detection of pavement patches utilizing support
 using gabor filter, texture analysis, and adaptive moment vector machine classification,” in Proceedings of the 18th
 estimation (adam) optimized logistic regression models,” Mediterranean Electrotechnical Conf (MELECON), pp. 1–5,
 Advances in Civil Engineering, vol. 2020, Article ID 8829715, IEEE, Lemesos, Cyprus, April 2016.
 16 pages, 2020. [49] N.-D. Hoang, Q.-L. Nguyen, and D. Tien Bui, “Image pro-
[33] N.-D. Hoang and V.-D. Tran, “Image processing-based de- cessing-based classification of asphalt pavement cracks using
 tection of pipe corrosion using texture analysis and meta- support vector machine optimized by artificial bee colony,”
 heuristic-optimized machine learning approach,” Journal of Computing in Civil Engineering, vol. 32, no. 5,
 Computational Intelligence and Neuroscience, vol. 2019, Ar- Article ID 04018037, 2018.
 ticle ID 8097213, 13 pages, 2019. [50] J.-S. Chou and N.-M. Nguyen, “FBI inspired meta-optimi-
[34] A. Humeau-Heurtier, “Texture feature extraction methods: a zation,” Applied Soft Computing, vol. 93, Article ID 106339,
 survey,” IEEE Access, vol. 7, pp. 8975–9000, 2019. 2020.
[35] L. Ji, Y. Ren, X. Pu, and G. Liu, “Median local ternary patterns [51] N.-D. Hoang, “Automatic detection of asphalt pavement
 optimized with rotation-invariant uniform-three mapping for raveling using image texture based feature extraction and
 noisy texture classification,” Pattern Recognition, vol. 79, stochastic gradient descent logistic regression,” Automation in
 no. 6, pp. 387–401, 2018. Construction, vol. 105, Article ID 102843, 2019a.
Complexity 17

[52] Z. Zhang, F. Gao, B. Ma, and Z. Zhang, “Extraction of earth results and current trends on using data intrinsic charac-
 surface texture features from multispectral remote sensing teristics,” Information Sciences, vol. 250, pp. 113–141, 2013.
 data,” Journal of Electrical and Computer Engineering, [71] A. R. Van Erkel and P. M. T. Pattynama, “Receiver operating
 vol. 2018, Article ID 9684629, 9 pages, 2018. characteristic (ROC) analysis: basic principles and applica-
[53] B. Abraham and M. S. Nair, “Computer-aided classification of tions in radiology,” European Journal of Radiology, vol. 27,
 prostate cancer grade groups from MRI images using texture no. 2, pp. 88–94, 1998.
 features and stacked sparse autoencoder,” Computerized [72] M. E. Tipping, “Sparse Bayesian learning and the relevance
 Medical Imaging and Graphics, vol. 69, pp. 60–68, 2018. vector machine,” Journal of Machine Learning Research, vol. 1,
[54] F. F. Feliciano, F. R. Leta, and F. B. Mainier, “Texture digital pp. 211–244, 2001.
 analysis for corrosion monitoring,” Corrosion Science, vol. 93, [73] M. E. Tipping, “Sparse Bayes software release for MATLAB,”
 pp. 138–147, 2015. 2009, http://wwwmiketippingcom/downloadshtm.
[55] S. Mathavan, A. Kumar, K. Kamal, M. Nieminen, H. Shah, and [74] H. Ho, “The random subspace method for constructing de-
 M. Rahman, “Fast segmentation of industrial quality pave- cision forests,” IEEE Transactions on Pattern Analysis and
 ment images using laws texture energy measures and k-means Machine Intelligence, vol. 20, no. 8, pp. 832–844, 1998.
 clustering,” Journal of Electronic Imaging, vol. 25, no. 5, p. 11, [75] L. Breiman, J. H. Friedman, R. A. Olshen, and C. J. Stone,
 2016. Classification and Regression Trees, Wadsworth and Brooks,
[56] S. Theodoridis and K. Koutroumbas, Pattern Recog- Montery, CA, USA, 1984.
 [76] L. Rokach and O. Z. Maimon, “Data mining with decision
 nitionAcademic Press, USA, 2009.
 trees: theory and applications,” Series in Machine Perception
[57] R. M. Haralick, K. Shanmugam, and I. H. Dinstein, “Textural
 and Artificial Intelligence, World Scientific Publishing
 features for image classification,” IEEE Transactions on Sys-
 Company, Singapore, 2008.
 tems, Man, and Cybernetics, vol. 3, no. 6, pp. 610–621, 1973.
 [77] N.-D. Hoang and D. T. Bui, “Predicting earthquake-induced
[58] R. M. Haralick and L. G. Shapiro, Computer and Robot Vision,
 soil liquefaction based on a hybridization of kernel Fisher
 Addison-Wesley Longman Publishing Co., Inc., Boston, MA,
 discriminant analysis and a least squares support vector
 USA, 1992. machine: a multi-dataset study,” Bulletin of Engineering Ge-
[59] R. C. Gonzalez, R. E. Woods, and S. L. Eddins, Digital Image ology and the Environment, vol. 77, no. 1, pp. 191–204, 2018.
 Processing Using MATLABGatesmark Publishing, USA, 2009. [78] M. Hollander and D. A. Wolfe, Nonparametric Statistical
[60] F. Tomita and S. Tsuji, Computer Analysis of Visual Textures, Methods, John Wiley & Sons, Hoboken, NJ, USA, 1999.
 Springer Science+ Business Media, New York, NY, USA,
 1990.
[61] X. Tan and B. Triggs, “Enhanced local texture feature sets for
 face recognition under difficult lighting conditions,” IEEE
 Transactions on Image Processing, vol. 19, no. 6, pp. 1635–
 1650, 2010.
[62] T. Ojala, M. Pietikäinen, and D. Harwood, “A comparative
 study of texture measures with classification based on featured
 distributions,” Pattern Recognition, vol. 29, no. 1, pp. 51–59,
 1996.
[63] C. M. Bishop, Pattern Recognition and Machine Learning
 (Information Science and Statistics, Springer, NY, USA, 2011.
[64] R. Salet, “Framing in criminal investigation,” The Police
 Journal: Theory, Practice and Principles, vol. 90, no. 2,
 pp. 128–142, 2017.
[65] MathWorks, Statistics and Machine Learning Toolbox User’s
 Guide, MathWork Inc., Natick, MA, USA, 2017, https://www.
 mathworks.com/help/pdf_doc/stats/stats.pdf.
[66] N.-M. Nguyen, “Forensic-based investigation algorithm (FBI)
 MATLAB central,” 2020, https://wwwmathworkscom/
 matlabcentral/fileexchange/76299-forensic-based-
 investigation-algorithm-fbi.
[67] Accord, “Accord. NET framework,” 2019, http://accord-
 frameworknet/.
[68] M.-T. Cao, N.-M. Nguyen, K.-T. Chang, X.-L. Tran, and
 N.-D. Hoang, “Automatic recognition of concrete spall using
 image processing and metaheuristic optimized LogitBoost
 classification tree,” Advances in Engineering Software, vol. 159,
 Article ID 103031, 2021.
[69] N.-D. Hoang and Q.-L. Nguyen, “A novel approach for au-
 tomatic detection of concrete surface voids using image
 texture analysis and history-based adaptive differential evo-
 lution optimized support vector machine,” Advances in Civil
 Engineering, vol. 2020, Article ID 4190682, 15 pages, 2020.
[70] V. López, A. Fernández, S. Garcı́a, V. Palade, and F. Herrera,
 “An insight into classification with imbalanced data: empirical
You can also read