Conduit integrity is compromised during acute lymph node expansion - bioRxiv
←
→
Page content transcription
If your browser does not render page correctly, please read the page content below

bioRxiv preprint first posted online Jan. 23, 2019; doi: http://dx.doi.org/10.1101/527481. The copyright holder for this preprint
 (which was not peer-reviewed) is the author/funder, who has granted bioRxiv a license to display the preprint in perpetuity.
                                    All rights reserved. No reuse allowed without permission.

 Conduit integrity is compromised during acute
             lymph node expansion
    Victor G. Martinez1 , Valeriya Pankova1 , Lukas Krasny2 , Tanya Singh3 , Ian J. White4 , Agnesska C. Benjamin1 , Simone
 Dertschnig5 , Harry L. Horsnell1 , Janos Kriston-Vizi3 , Jemima J. Burden4 , Paul H. Huang2 , Christopher J. Tape6 , and Sophie
                                                            E. Acton1,
         1
             Stromal Immunology Group, MRC Laboratory for Molecular Cell Biology, University College London, Gower Street, London, WC1E 6BT, United Kingdom
                                     2
                                       Division of Molecular Pathology, Institute of Cancer Research; 237 Fulham Road London, SW3 6JB, UK
                          3
                            Bioinformatics Image Core, MRC Laboratory for Molecular Cell Biology, University College London; London, WC1E 6BT, UK
                          4
                            Electron microscopy facility, MRC Laboratory for Molecular Cell Biology, University College London, London, WC1E 6BT, UK
                                         5
                                           UCL Institute of Immunity and Transplantation, University College London, London, NW3 2PF, UK
                  6
                    Cell Communication Lab, Department of Oncology, University College London Cancer Institute, 72 Huntley Street, London, WC1E 6DD, UK

Lymph nodes (LNs) work as filtering organs, constantly sam-                           PDPN-CD31- double-negative cells (DN) (2). Among these,
pling peripheral cues. This is facilitated by the conduit net-                        the FRC population is the most abundant stromal subset. A
work, a parenchymal tubular-like structure formed of bundles                          recent scRNAseq analysis showed that FRCs may contain
of aligned extracellular matrix (ECM) fibrils ensheathed by fi-                       different subpopulations with specific locations and functions
broblastic reticular cells (FRCs). LNs undergo 5-fold expansion                       (3). FRCs form a connected 3D network that spans the T-cell
with every adaptive immune response and yet these ECM-rich
                                                                                      area and interfollicular regions of LNs. FRCs regulate lym-
structures are not permanently damaged. Whether conduit in-
tegrity and filtering functions are affected during cycles of LN
                                                                                      phocyte homeostasis (4, 5) and induction of peripheral toler-
expansion and resolution is not known. Here we show that the                          ance (6–8). Furthermore, contraction through the FRC net-
conduit structure is disrupted during acute LN expansion but                          work also regulates the immune response at a whole organ
FRC-FRC contacts remain intact. In homeostasis, polarised                             level by controlling LN size. Interactions between FRC and
FRCs adhere to the underlying substrate to deposit ECM ba-                            C-type lectin-like receptor 2 (CLEC-2)+ migratory dendritic
solaterally. ECM production by FRCs is regulated by the C-                            cells (DCs) transiently inhibit PDPN-dependent actomyosin
type lectin CLEC-2, expressed by dendritic cells (DCs), at tran-                      contractility during the acute phase of the immune response
scriptional and secretory levels. Inflamed LNs maintain con-                          (9, 10), allowing rapid LN expansion.
duit size-exclusion, but flow becomes leaky, which allows soluble
antigens to reach more antigen-presenting cells. We show how                          LNs also function as filters for lymph-born antigens (11, 12).
dynamic communication between peripheral tissues and LNs                              Soluble antigens reach the LN first in a wave of draining-type
changes during immune responses, and describe a mechanism                             diffusion ahead of a secondary wave of migratory antigen-
that enables LNs to prevent inflammation-induced fibrosis.                            presenting cells. Collected by lymphatic capillaries in the
Dendritic cell | Fibroblastic reticular network | Conduit | Extracellular matrix |
                                                                                      peripheral tissue, the lymph converges in afferent lymphatic
Lymph Node | Podoplanin | CLEC-2 | LL5—                                               vessels that merge with the LN capsule, and flows within the
Correspondence: s.acton@ucl.ac.uk                                                     subcapsular sinus (SCS). The lymph percolates through tra-
                                                                                      becular and cortical sinuses that flow into the LN medulla be-
                                                                                      fore leaving via efferent lymphatic vessels. Subcapsular and
Highlights
                                                                                      medullary sinuses are populated by macrophages that repre-
• FRCs use polarized microtubule networks to guide matrix                             sent a first line of defence in LNs against pathogens (13). A
deposition                                                                            sample of low molecular weight molecules (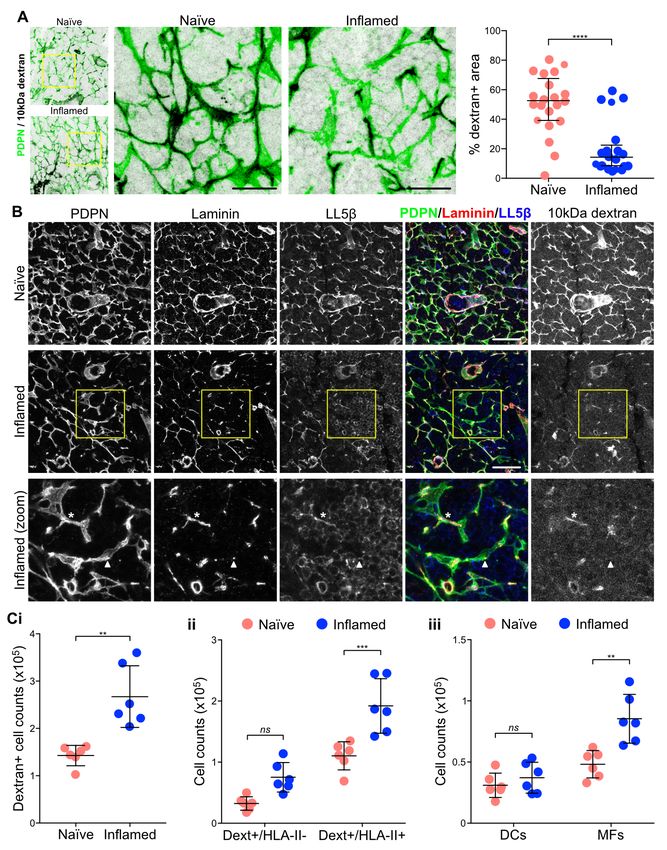
bioRxiv preprint first posted online Jan. 23, 2019; doi: http://dx.doi.org/10.1101/527481. The copyright holder for this preprint
 (which was not peer-reviewed) is the author/funder, who has granted bioRxiv a license to display the preprint in perpetuity.
                                    All rights reserved. No reuse allowed without permission.

LN fibrosis can occur in some cases of chronic viral-infection             ture in response to CLEC-2+ migratory DCs (9). We hypoth-
or tumour-draining LNs (22–25), however, more commonly,                    esised that the remodelling of the cellular network may also
LNs undergo a virtually unlimited number of inflammatory                   affect the remodelling of the associated ECM downstream
episodes throughout an individual’s lifetime and LN fibro-                 of the same DC/stromal contacts. We stimulated FRCs in
sis does not occur. In LNs, FRCs are the main producers of                 vitro with CLEC-2-Fc recombinant protein and compared
ECM (19). Therefore, we hypothesised that a specific mech-                 transcriptional profiles by RNAseq (Figure 2 and Figure S1).
anism must be in place in order to avoid the accumulation of               Bulk analysis of the transcriptomic data comparing 6hr and
aberrant ECM in lymphoid tissue.                                           24hr CLEC-2-Fc treatment revealed that CLEC-2-Fc induced
In this study we focussed our investigations on ECM remod-                 a transient and largely reversible gene regulation response
elling by FRCs during LN expansion, and the interconnec-                   in FRCs (Figure S1A), similar transient kinetics to the in-
tion between the cellular and ECM components of the con-                   hibition of PDPN-dependent contractility (9). Gene ontol-
duit network. We demonstrate a loss of ECM components                      ogy analysis (28, 29) showed that genes encoding proteins
of the conduit during acute LN expansion. We show that                     in the extracellular space/region were most enriched (Fig-
CLEC-2 binding to PDPN+ FRCs modulates ECM produc-                         ure 2A). Indeed, using the matrisome database (30–32) of all
tion at both mRNA and protein levels. Furthermore, the                     ECM proteins and associated factors, we found that FRCs ex-
CLEC-2/PDPN axis regulates polarised microtubule organi-                   pressed 570/743 matrisome genes in vitro, of which 75 (13%)
sation in FRCs to control ECM deposition. The resulting loss               were regulated >2-fold 6 hr after CLEC-2-Fc binding (Figure
of conduit integrity alters intranodal flow of small molecules             2B and Figure S1B).
in inflamed LNs, allowing enhanced capture by LN resident                  FRCs regulated 35 core matrisome genes (>2-fold) in re-
myeloid cells.                                                             sponse to CLEC-2-Fc, including one collagen (Col8a2), 23
                                                                           glycoproteins, and 6 proteoglycans (Figure 2C). The down-
Results                                                                    regulated glycoproteins were mostly associated with cell-
                                                                           matrix adhesion and migration, including Nov, Sparcl1,
Extracellular matrix components of the conduit are
                                                                           Ntn1, Igfbp5, Ndnf, Spon2, Efemp1, Fbln7 (33–40). Gly-
reduced during acute LN expansion. To ask how ECM
                                                                           coprotein genes induced had more pleiotropic roles, such us
structures were maintained and remodelled during acute LN                  growth factor signalling (Ctgf, Tsku, Wisp1 and Ltbp2) (41–
expansion, a period of rapid tissue growth, we first exam-                 44) or immunomodulation (Spp1, Tnc, Crispld2) (45–47).
ined LN ECM structures in the steady state. Using the                      Regulation of proteoglycan expression by CLEC-2-Fc was
passive clarity technique (PACT) (26), we imaged colla-                    more evident at 24 hours, suggesting that these may be indi-
gen IV in intact naïve inguinal LNs (Figure 1A, Supple-                    rectly regulated; eg. CTGF/CCN2 represses Ogn, Dcn and
mentary video 1). This abundant basement membrane pro-                     Omd (48). CLEC-2-Fc increased expression of Prg4, which
tein surrounded the LN vasculature and formed an intricate                 inhibits synoviocyte cell/matrix adhesion (49).
3D connected network spanning the whole LN parenchyma
(16, 18, 19), corresponding to the conduit network. Electron               Most of the 17 ECM affiliated genes regulated by CLEC-2-Fc
microscopy revealed the detail of condensed fibrillar bundles              were linked to cytoskeleton regulation (50–52) (Figure 2C),
consisting >200 collated fibres of ECM enwrapped by FRCs                   including members of the semaphorin-plexin system which
(Figure 1B). Co-staining of the basement membrane protein                  provide guidance cues for migration (52). Known to inhibit
laminin and the FRC marker PDPN confirmed that in LNs                      axonal growth (52), expression of Sema6c, Sema5a, Sema3f,
parenchyma, ECM structures are associated with the FRC                     Sema3e, Sema3a, Sema3d were reduced upon CLEC-2-Fc
network (27), and vasculature (Figure 1C).                                 treatment, hinting that FRCs may spread using similar mech-
We immunised PDGFR–H2B-GFP mice with ovalbumin                             anisms. Of note, CLEC-2-Fc induced expression of Sema7a,
emulsified in complete Freund’s adjuvant (CFA/OVA), in                     which represses ECM production in other fibroblasts (53).
which FRCs are identified with nuclear GFP (9), and com-                   CLEC-2-Fc regulation of 23 ECM regulators (Figure 2C)
pared to naïve LNs the structure and density of several col-               mainly affected protease inhibitors, including upregulation
lagen components after 5 days of LN expansion. Collagens                   of Serpine1, Timp1 and Timp3, key in negative regulation of
I, IV and VI, (16, 18, 19), were abundant in naïve LNs and                 MMP activity (54, 55). Also upregulated, Sulf1 and Tll1 are
almost completely filled the FRC network. However, despite                 involved in ECM biogenesis (56, 57). CLEC-2-Fc repressed
that the FRC network remained intact and connected, these                  the expression of several ECM regulator genes with promi-
structures were either less prominent or partially disrupted 5             nent roles in ECM degradation: Hyal1 (Hyaluronidase-1)
days post immunisation (Figure 1D). All three collagens were               (58), Agt (SERPINA8/angiotensinogen) (59), Htra3 (60, 61),
reduced within the PDPN+ cellular network (Figure 1E), in-                 Adamts1 (62), Adamts5 (63), Adamts7 (64), Adamts9 (65),
dicating that while the FRC cellular network remained con-                 Adamts15 (66), Adam9 (67) and Mmp16 (68).
nected and intact, the accompanying ECM forming the con-                   These data indicate that FRCs can substantially alter their
duit remained associated with the FRCs but were no longer                  transcription profile following CLEC-2 binding and that tran-
replete.                                                                   scriptional regulation may play an important role in ECM re-
                                                                           modelling and cell-matrix adhesion in FRCs. Furthermore,
CLEC-2 binding regulates ECM production by FRCs.                           induction of protease inhibitors plus repression of proteases
FRCs rapidly change their morphology and network architec-                 suggest that the observed loss of ECM within the conduit dur-

2   |   bioR‰iv                                                                                    Martinez et al.   |   ECM remodelling in Lymph Nodes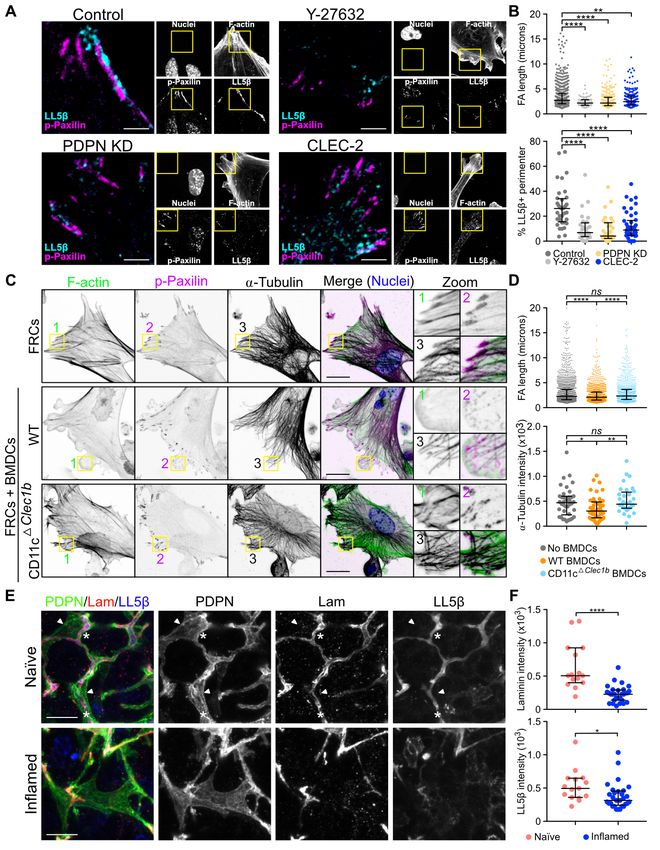
bioRxiv preprint first posted online Jan. 23, 2019; doi: http://dx.doi.org/10.1101/527481. The copyright holder for this preprint
 (which was not peer-reviewed) is the author/funder, who has granted bioRxiv a license to display the preprint in perpetuity.
                                    All rights reserved. No reuse allowed without permission.

                                                                                                   Fig. 1. Conduit composition changes during LN
                                                                                                   expansion A) Immunofluorescence of intact whole
                                                                                                   naïve lymph nodes stained for collagen IV using
                                                                                                   PACT. A maximum Z stack projection is shown. Scale
                                                                                                   bar represents 100 microns. B) Transmission elec-
                                                                                                   tron microscopy of naïve LNs. Two sections and the
                                                                                                   indicated zoomed areas (right panels) are shown.
                                                                                                   The scale bars represent 5 microns. C) Immunoflu-
                                                                                                   orescence of 20 microns thick cryosection of a naïve
                                                                                                   LN. Maximum z stack projections of a tile scan (top)
                                                                                                   and zoomed area (bottom) are shown. Boundary be-
                                                                                                   tween T and B cell areas is delineated by a discontin-
                                                                                                   ued line. The scale bars represent 500 microns (tile
                                                                                                   scan) and 100 microns (zoom). D-E) Immunofluores-
                                                                                                   cence of 10 microns thick cryosection of naïve and
                                                                                                   inflamed LNs from PDGFR–H2B-GFP mice immu-
                                                                                                   nized with CFA/OVA. D) Maximum z stack projections
                                                                                                   of representative images are shown. The scale bars
                                                                                                   represent 20 microns. E) Quantification of the indi-
                                                                                                   cated ECM components within the PDPN network.
                                                                                                   Each dot represents the median grey intensity of a
                                                                                                   different region of interest (n=3). Error bars represent
                                                                                                   mean and SD. **P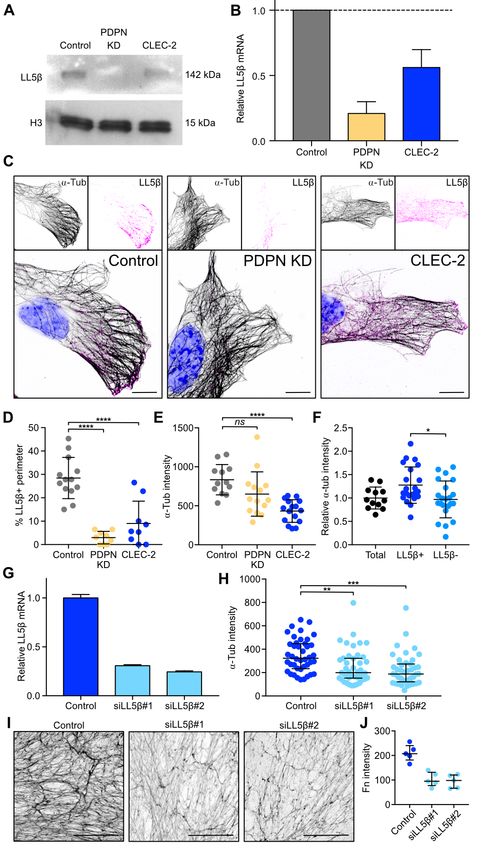
bioRxiv preprint first posted online Jan. 23, 2019; doi: http://dx.doi.org/10.1101/527481. The copyright holder for this preprint
 (which was not peer-reviewed) is the author/funder, who has granted bioRxiv a license to display the preprint in perpetuity.
                                    All rights reserved. No reuse allowed without permission.

                                                                                           ing LN expansion (Figure 1D) is unlikely to be due to degra-
                                                                                           dation. Further, since we observed that collagens (I, IV and
                                                                                           VI) are reduced in vivo in inflamed LNs (Figure 1D), but
                                                                                           were not transcriptionally regulated by CLEC-2, this tran-
                                                                                           scriptional regulation alone cannot fully explain the reduced
                                                                                           ECM observed (Figure 1D).
                                                                                           To investigate whether the CLEC-2/PDPN signalling axis
                                                                                           regulates ECM production at the protein level we undertook
                                                                                           proteomic analysis on FRC-derived matrices in vitro (Figure
                                                                                           S2). We generated CLEC-2-Fc-secreting FRCs to allow con-
                                                                                           stant CLEC-2 stimulation and compared to PDPN-depleted
                                                                                           FRCs (PDPN KD) (9) and a control FRC cell line. Mass
                                                                                           spectrometry analysis detected a similar number of proteins
                                                                                           in all three FRC cell lines of which 96 proteins were matri-
                                                                                           somal proteins with a 90 % overlap among samples (Figure
                                                                                           S2A). PDPN depletion phenocopies the same loss of con-
                                                                                           tractility induced by CLEC-2 (9), in contrast, when com-
                                                                                           paring ECM protein production, PDPN KD FRCs appeared
                                                                                           quantitatively very different from either control or CLEC-2-
                                                                                           expressing FRCs. Among the proteins statistically changed
                                                                                           (Figure S2B), PDPN KD FRC-derived matrices showed an
                                                                                           overall reduction in ECM components, whereas CLEC-2-
                                                                                           expressing FRCs and controls were more closely aligned
                                                                                           (Figure S2C). This suggests that loss of PDPN expression
                                                                                           is not equivalent to CLEC-2 modulation of PDPN function in
                                                                                           the case of matrix production.
                                                                                           While the CLEC-2/PDPN signalling axis certainly influ-
                                                                                           enced matrix transcription (Figure 2A-C) and protein pro-
                                                                                           duction (Figure S2), how these changes translated to fibril
                                                                                           formation, relevant to conduit remodelling in vivo, was still
                                                                                           unclear. Staining of FRC-derived matrices for fibronectin
                                                                                           and collagen VI showed that ECM structures formed by
                                                                                           CLEC-2-expressing FRCs appeared disorganised compared
                                                                                           to controls, with lower alignment and large empty spaces
                                                                                           and lower median intensity of matrix fibres (Figure 2D and
                                                                                           2E). Interestingly, in this functional assay, PDPN KD FRCs
                                                                                           phenocopied the effect of CLEC-2-Fc in matrix deposition
                                                                                           and organisation. Together, these experiments demonstrate
                                                                                           that CLEC-2/PDPN signalling regulates ECM remodelling at
                                                                                           multiple levels, gene expression, protein production and fibril
                                                                                           arrangement. These important in vitro results also show that
                                                                                           PDPN expression by FRCs is a key requirement for FRCs to
Fig. 2. Effects of CLEC-2 on ECM production by FRCs. A-C) Gene expression                  produce, deposit, and align ECM components, and that this
by RNAseq in control FRCs treated with CLEC-2-Fc for 6 and 24 hours. A) Genes
regulated by CLEC-2-Fc more or equal than 2-fold were subjected for statistical            process is disrupted by CLEC-2.
overrepresentation test of gene ontology analysis for cellular components. Each
dot represents a cellular component significantly enriched, by binomial analysis.          Signalling cascades regulated by CLEC-2 in FRCs. The
B) CLEC-2-Fc-regulated matrisomal gene cluster in a PCA space. C) Heatmap                  above results suggest that additional cellular mechanisms are
of matrisomal genes regulated by CLEC-2-Fc, clustered according to expression
pattern. Four replicates for each condition is shown. Color code represents z-scores       likely to regulate ECM remodelling in FRCs. To address
and the row average for each gene is indicated (right hand side of the heatmap). D)        the CLEC-2/PDPN-dependent signalling cascades control-
In vitro FRC cell line-derived matrices decellularized and stained for fibronectin (top)   ling ECM organisation, we performed unbiased phosphopro-
and collagen VI (bottom). Maximum z stack projections of representative images
are shown. The scale bars represent 20 microns. E) Median grey intensity for               teomics analysis of FRCs by tandem mass tag mass spec-
the indicated ECM components. Each dot represents a different region of interest           trometry (TMT-MS) (69) (Figure 3A). Control FRCs were
(n=3). Error bars represent mean and SD. *P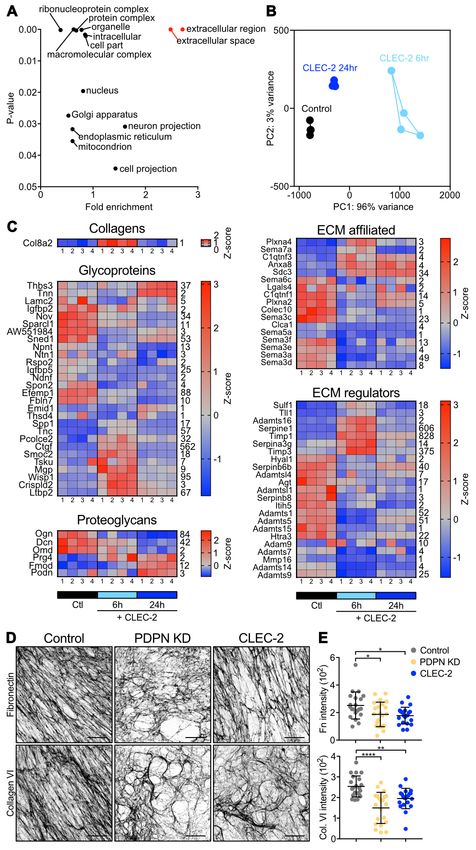
bioRxiv preprint first posted online Jan. 23, 2019; doi: http://dx.doi.org/10.1101/527481. The copyright holder for this preprint
 (which was not peer-reviewed) is the author/funder, who has granted bioRxiv a license to display the preprint in perpetuity.
                                    All rights reserved. No reuse allowed without permission.

tion sites were regulated by CLEC-2-Fc (Figure 3D) corre-                 ther CLEC-2-Fc treatment or PDPN depletion (Figure 2D),
sponding to 77 proteins. In contrast, after 24 hr, only 7 phos-           and confirming that LL5— is necessary for ECM deposition
phorylation sites corresponding to 6 proteins were regulated              in FRCs.
compared to controls, confirming the transient and reversible
nature of responses to CLEC-2/PDPN engagement (Figure                     Loss of FRC adhesion and reorganisation of micro-
3D).                                                                      tubule networks. LL5— is recruited to mature focal adhe-
In order to elucidate signalling cascades regulated by CLEC-              sion complexes, which require Rho-kinase (ROCK)/myosin-
2, we performed kinase target analysis (15 min dataset). We               mediated contractility (73, 74). Since the CLEC-2/PDPN
found that CSNK2B and CDK1 regulated the highest num-                     signalling axis inhibits actomyosin contractility in FRCs (9),
ber of predicted targets (Figure 3E). Gene ontology analy-                we predicted it might also alter FRC adhesion to the under-
sis of hits (28, 29) highlighted intracellular protein transport          lying conduit and therefore inhibit the localisation of LL5—
pathways (Figure 3F), of relevance to transport and deposi-               and microtubules to the cell cortex. We compared the struc-
tion of cargo such as ECM components. However, using                      ture and localisation of focal adhesions (p-paxillin) and LL5—
a GFP-based assay we found no reduction in protein secre-                 between FRCs cell lines. CLEC-2-Fc-treated and PDPN
tion in either CLEC-2-Fc-treated or PDPN KD FRCs (Figure                  KD cells presented significantly shorter focal adhesions (Fig-
S3). Nevertheless, the impaired ECM deposition observed in                ure 5A and 5B). This was phenocopied by the direct in-
both CLEC-2-Fc-treated and PDPN KD FRCs (Figure 2D)                       hibition of ROCK (Y-27632) (Figure 5A and 5B). In con-
prompted a closer look at the phosphoproteomic data. Secre-               trols, LL5— clustered directly adjacent to elongated mature
tion of large cargo proteins like ECM components requires                 focal adhesions (73) (Figure 5A and 5B). However, when
vesicle transport via cytoskeletal structures such as the mi-             focal adhesion maturation is disrupted, there is a concor-
crotubule network (70). We found that several key regulators              dant loss of LL5— clustering, linking actomyosin contractil-
of microtubule function were post-translationally modified                ity, cell-matrix adhesion, and LL5— recruitment in an inte-
by CLEC-2-Fc stimulation (Supplementary table 1), includ-                 grated mechanism (Figure 5A, 5B). To test these linked out-
ing Cytoplasmic linker protein 170 (CLIP-170), cytoplasmic                comes in a more physiological assay, we stimulated FRCs
dynein heavy chain 1, and pleckstrin homology-like domain                 with either control or CD11c CLEC-2 bone marrow-derived
family B member 2 (LL5—). While the direct function of                    dendritic cells (BMDCs). Cultured alone, FRCs displayed
these regulatory sites are not previously described, these data           prominent f-actin stress fibres and mature elongated focal
presented strong evidence that CLEC-2 altered the organisa-               adhesions to which microtubules bundles docked in abun-
tion of microtubules in FRCs, a possible regulatory mecha-                dance (Figure 5C and 5D). Interaction with control (CLEC-
nism of ECM deposition in LNs.                                            2+) BMDCs induced loss of actin stress fibres, shorter fo-
                                                                          cal adhesions and lower microtubule density at the periphery
CLEC-2 binding controls microtubule organization in                       (Figure 5C and 5D). This change in FRC morphology and
FRCs via LL5— . LL5— forms complexes at the basal pole                    function was not observed with CD11c CLEC-2 BMDCs
of epithelial cells attaching plus ends of microtubules to the            (Figure 5C and 5D), demonstrating that DC-induced inhibi-
cell cortex, forming a secretory pathway for local and po-                tion of actomyosin contractility and microtubule localisation
larised exocytosis (70–73). We examined the role of LL5— in               requires CLEC-2.
ECM deposition by FRCs. We found that both CLEC-2-Fc                      We next asked whether LL5— directs microtubule-mediated
treatment and PDPN KD reduced LL5— protein and mRNA                       deposition of matrix components in the FRC network in vivo.
levels in FRCs (Figure 4A and 4B). We attempted, unsuc-                   High-resolution imaging of LN tissue revealed that in naïve
cessfully to overexpress a phosphomimetic mutant (LL5—                    LN, the entire FRC network expressed high levels of LL5—,
S465E) in FRCs, leading us to hypothesise that phosphoryla-               and its localisation was always polarised towards the en-
tion of LL5— at S465 may target LL5— for degradation.                     sheathed conduit (Figure 5E). In contrast, in inflamed LNs,
Control FRCs clustered LL5— at the cell periphery (Fig-                   we observed many regions of the FRC network which lacked
ure 4C), however, this accumulation was absent in PDPN                    polarised localisation of LL5—, interestingly coinciding with
KD FRCs and more cytoplasmic in CLEC-2-Fc-treated cells                   loss of laminin in the same region (Figure 5E). This is a di-
(Figure 4C and 4D). The reduced cortical localisation of                  rect translation of the in vitro studies which predicted loss of
LL5— coincided with lower density of microtubules at the cell             LL5— when matrix adhesion is lost (Figure 4 and 5). These
periphery in PDPN KD and CLEC-2-Fc treated cells (Fig-                    data require us to consider FRCs as polarised cells, exhibiting
ure 4E). We confirmed the colocalization of LL5— with cor-                apical and basolateral polarity similarly to epithelial sheets
tical microtubules in control FRCs, where LL5—-positive ar-               (70) but enwrapping the conduit similarly to Schwann cells
eas presented higher microtubule density compared to areas                enwrapping nerve fibres (75). The inner surface of the FRC
lacking LL5— (Figure 4F). To ask if LL5— was required for                 adheres to the conduit and recruits LL5— for ECM secretion,
microtubule attachment to the cortex in FRCs, we silenced                 while the outer surface of the FRC excludes ECM, allowing
LL5— expression using siRNA (Figure 4G) which resulted                    optimal interaction with lymphocytes and antigen-presenting
in a corresponding loss of microtubules from the periphery                cells. Polarised and localised exocytosis in FRCs, directed
(Figure 4H). Importantly, LL5—-silenced FRCs also showed                  by LL5—, can for the first time mechanistically explain how
significantly reduced matrix deposition (Figure 4I and 4J),               ECM components are exclusively found within the conduit
phenocopying the disrupted matrix generated following ei-                 and not elsewhere in the LN parenchyma.

Martinez et al.   |   ECM remodelling in Lymph Nodes                                                                                bioR‰iv   |   5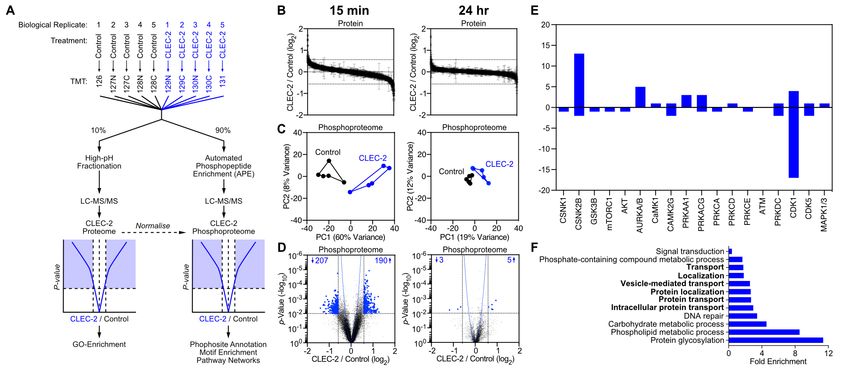
bioRxiv preprint first posted online Jan. 23, 2019; doi: http://dx.doi.org/10.1101/527481. The copyright holder for this preprint
 (which was not peer-reviewed) is the author/funder, who has granted bioRxiv a license to display the preprint in perpetuity.
                                    All rights reserved. No reuse allowed without permission.

Fig. 3. Phosphoproteomics of CLEC-2-treated FRCs. A) Control (untreated) and CLEC-2-Fc-treated FRCs cell lysates were isobarically labeled with tandem-mass
tags (TMT) (126–131 mass-to-charge ratio [m/z]), mixed, and subjected to automatic phosphopeptide enrichment (APE) (n = 5). TMT-phosphopeptides were analyzed by
high-resolution LC-MS/MS and normalized to total protein level changes. B) Waterfall graphs showing proteome regulation by CLEC-2-Fc. C) Control and CLEC-2-Fc-
treated phosphoproteomes cluster in a PCA space. D) Volcano plots showing statistical regulation of the CLEC-2-Fc-treated FRC’s phosphoproteome (n = 5, two-tailed t
test, Gaussian regression). Number of phosphosites considered statically different are indicated. E) Empirical parent kinase analysis. Bars represent number of targets
for each putative parent kinases manually assigned to hits. Positive and negative values mean higher or lower phosphorylation in CLEC-2-Fc-treated cells. F) Statistical
overrepresentation test of gene ontology analysis for biological processes. Each bar represents a biological process significantly enriched, by binomial analysis.

Changes in conduit flow and capture of antigen during                                  served in inflamed LNs would reflect leakiness of the sys-
LN expansion. We next asked how remodelling the ECM                                    tem and whether this might affect antigen uptake by LN
would affect conduit function. We compared the flow of 10,                             cells. By flow cytometry we found a significant increase
70 and 500 kDa fluorescently-labelled dextrans through the                             in the number cells that captured the soluble 10 kDa dex-
LN sinuses and conduit network of naïve and acutely in-                                tran in inflamed LNs (Figure 6Ci and S5). This analysis
flamed LNs. 10 kDa and 70 kDa dextrans rapidly perco-                                  was performed 90 minutes after dextran injection, meaning
lated throughout LN parenchyma of naïve LNs and remained                               that antigen capture at the site of injection did not contribute
contained within the conduit, while the 500 kDa dextran re-                            to the effect. We observed a similar trend for the 70 kDa
mained within the capsule and was excluded from all but the                            dextran, but no effect on the 500 kDa, confirming that size
most proximal branches of the conduit (Figure S4A). Simi-                              exclusion by the conduit is maintained during LN expan-
lar results were found in inflamed LNs, meaning that the fil-                          sion (Figure S4B). It also indicates that the increase in anti-
tering function and size-exclusion of the conduit network is                           gen uptake is conduit-dependent, and not the result of more
unaffected by LN expansion (Figure S4A). These results also                            tracers being endocytosed from the subcapsular sinus. We
indicated that ECM loss within parts of the network did not                            found increased number of dextran+ cells within both HLA-
impede the overall flow of small soluble molecules through                             II- and HLA-II+ populations (Figure 6Cii), with HLA-II+
LNs.                                                                                   cells representing 80% of all dextran+ cells (Figure S5B).
However, looking closer at the pattern of the 10 kDa dextran-                          Previous studies have shown that CD11c+CD11b-/+ T-cell
injected mice we noticed the presence of numerous gaps or                              area DCs have privileged access to conduit content (15, 16),
interruptions in dextran flow throughout inflamed LNs (Fig-                            which could explain the similar numbers of dextran+ DCs
ure 6A), which translated to a large decrease in percentage                            we found in naïve and inflamed LNs (Figure 6Ciii). On the
of dextran-positive area within the FRC network (Figure 6A,                            other hand, CD11b+CD11c- macrophages do not normally
right panel). Interestingly, we found that dextran flow in in-                         interact with the conduit (16), and nevertheless the number
flamed LNs perfectly correlated with FRCs which had main-                              of dextran+ macrophages doubled in inflamed LNs (Figure
tained polarised LL5— colocalised with basement membrane                               6Ciii). These changes in cell numbers resulted in underrep-
(laminin) (Figure 6B), indicating that conduit integrity de-                           resentation of DCs within the dextran+HLA-II+ cell popula-
termines conduit flow. Furthermore, despite the substantial                            tion (Figure S5B). Overall, these data further support that the
reduction in conduit structures during acute expansion, FRCs                           conduit network becomes leaky during LN expansion, grant-
maintain the overall global conduit functionality, reinforcing                         ing LN cells access to lymph-borne small molecules despite
the robustness of the FRC network (76) .                                               not being interacting with the conduit.
Antigen flow through the conduit secures under-control anti-
gen sensing by LN resident cells (14–17, 77). We there-
fore questioned whether the interruptions in conduit flow ob-

6   |   bioR‰iv                                                                                                    Martinez et al.   |   ECM remodelling in Lymph Nodes
bioRxiv preprint first posted online Jan. 23, 2019; doi: http://dx.doi.org/10.1101/527481. The copyright holder for this preprint
(which was not peer-reviewed) is the author/funder, who has granted bioRxiv a license to display the preprint in perpetuity.
All rights reserved. No reuse allowed without permission.
Conclusions
Our results show for the first time that the integrity of the T-
cell area conduit network is compromised during LN acute
expansion and that ECM components are lost or effectively
diluted during the early LN expansion. We observe discontin-
uous conduit flow within the FRC network, indicating areas
of potential leakage. Increased number of dextran+/MHC-II+
cells in inflamed LNs support the notion of leaking conduits,
increasing availability of soluble molecules during this phase
of the immune response. We found that CLEC-2 binding reg-
ulates matrix remodelling by FRCs which occurs at both gene
and protein levels and additionally downstream microtubule
polarisation. CLEC-2 binding impairs focal adhesion stabil-
ity and LL5— recruitment, temporarily inhibiting matrix de-
position.
Previous works have described the complex architecture of
the conduit network in steady state, and it is known that FRCs
produce and organise ECM components (16–19). We show
for the first time that FRCs exhibit apical/basolateral polarity
and use polarised microtubule networks to direct ECM de-
position unilaterally into conduit structures. Recruitment of
LL5— facilitates docking and attachment of plus ends of mi-
crotubules to the cell membrane at sites of FRC-matrix ad-
hesion, and enables matrix deposition. We previously proved
that CLEC-2+ DCs inhibit PDPN-dependent contractility in
FRCs (9), which also weakens FRC adhesion to the conduit.
This in turn inhibits the recruitment of LL5— and FRC ma-
trix secretion. LL5— expression is essential for FRCs to or-
ganise microtubules and form ECM matrices, and is exclu-
sively localised basolaterally in association with laminin in
vivo. Moreover, LL5— basolateral localisation is diminished
during LN expansion.
Our results confirm that the FRC network remains connected
in inflamed LNs (9, 10), even though the conduit flow is lo-
cally disrupted. Indicating that cell-cell connectivity is pri-
oritised over and above maintaining ECM production. Our
data suggest that to expand the LN rapidly, FRCs detach tem-
porarily from the conduit, and halt matrix production, lead-
Fig. 4. Regulation of microtubule organization by CLEC-2 via LL5— . A) Protein
blots showing levels of LL5— in FRC cell lines. Histone 3 was used as a loading ing to loss of conduit integrity as pre-existing ECM fibres
control. B) Expression of LL5— mRNA relative to control FRCs by qPCR. Error bars are stretched. However, the remaining intact sections of con-
represent mean and SD (n=2). C) Immunofluorescence of FCR cell lines in cul- duit are sufficient to channel the lymph throughout the LN
ture. Maximum z stack projections of representative images are shown. The scale
bars represent 10 microns. D) Quantification of LL5— coverage in FRC cell lines parenchyma. Recent observations based on FRC ablation and
as a percentage of total perimeter. Each dot represents a cell (n=2). Error bars a graph theory-based systems biology approach have demon-
represent mean and SD. ****PbioRxiv preprint first posted online Jan. 23, 2019; doi: http://dx.doi.org/10.1101/527481. The copyright holder for this preprint
(which was not peer-reviewed) is the author/funder, who has granted bioRxiv a license to display the preprint in perpetuity.
All rights reserved. No reuse allowed without permission.
Fig. 5. Focal adhesion, microtubule or-
ganization and contractility in FRCs. A-
B) Immunofluorescence of FCR cell lines
untreated, and control FRCs treated with
Y-27632 ROCK inhibitor. A) Maximum z
stack projections of representative images
are shown. The scale bars represent 5 mi-
crons. B) Quantification of FA length from
p-Paxilin staining and LL5— coverage as a
percentage of total perimeter. Dots repre-
sent FAs (top graph) or single cells (bottom
graph) (n=2). **PbioRxiv preprint first posted online Jan. 23, 2019; doi: http://dx.doi.org/10.1101/527481. The copyright holder for this preprint
(which was not peer-reviewed) is the author/funder, who has granted bioRxiv a license to display the preprint in perpetuity.
All rights reserved. No reuse allowed without permission.
Fig. 6. Conduit flow and antigen uptake
in inflamed LNs. Mice were immunized by
subcutaneous injection of IFA/OVA on the
right flank. 5 days later, fluorescently la-
belled 10 kDa dextran was injected on both
flanks. A) and B) Immunofluorescence of 20
microns thick cryosections of naïve and in-
flamed draining LNs 30 minutes post dextran
injection. Maximum z stack projections are
shown. The scale bars represent 20 microns
(A), 40 microns (B) and 20 microns (B zoom).
The asterisk indicates a portion of the FRC
network with all conduit components plus
dextrans flow. The arrow head indicates a
portion of the FRC network where the con-
duit is not present and dextrans not flowing.
Graph in A shows percentage of dextran-
positive area within the PDPN-positive net-
work. Each dot represents a different region
of interest (n=6). Error bars represent mean
and SD. ****PbioRxiv preprint first posted online Jan. 23, 2019; doi: http://dx.doi.org/10.1101/527481. The copyright holder for this preprint
(which was not peer-reviewed) is the author/funder, who has granted bioRxiv a license to display the preprint in perpetuity.
All rights reserved. No reuse allowed without permission.
equipped with a charge-coupled device camera (SIS Morada; U/mL) and 1% Insulin-Transferrin-Selenium (Life Technolo-
Olympus). gies, Invitrogen) at 37¶C in 10% CO2. Cells were passaged
when they reach 80-90% confluence, by incubating in Cell
Immunisations. Mice were immunized via subcutaneous Dissociation Buffer (Thermo Fisher Scientific) for 10 min-
injection in the right flank of 100 µl of an emulsion of OVA in utes at 37¶C, plus a gentle treatment of 1 min with Trypsin
CFA or IFA (100 µg OVA per mouse) (Hooke Laboratories). 0.25% (Thermo Fisher Scientific). When indicated, FRCs
After 5 days, mice were culled and inguinal LNs from both were treated with 50 µg/ml CLEC-2-Fc or 10 µM ROCK in-
flanks (naïve and inflamed) were extracted for paired histo- hibitor Y-27632 dihydrochloride (tocris) for the last 2 hr of
logical studies or flow cytometry analysis. culture. Primary cultures: Bone marrow cells were obtained
from tibias and femurs from CD11c CLEC-2 mice and Cre-
Immunostaining of tissue sections. LN samples were negative control littermates. Whole bone marrow was cul-
fixed in AntigenFix (DiaPath) overnight, washed and tured in non-treated 10 cm petri dishes in RPMI media sup-
incubated in PBS 30% sucrose (w/v) (Sigma-Aldrich) plemented with 10% FBS and Penicillin-Streptomycin (100
overnight at 4°C. Samples were embedded in Tissue-Tek® U/mL) plus 20 ng/ml of recombinant murine GM-CSF (Pe-
O.C.T. Compound (Thomas Scientific) and frozen using 2- protech) at 4x10⁶ cells / 13 ml of medium. After 3 days, cul-
Methylbutane (GPR RECTAPUR), cooled with liquid nitro- tures were supplemented with 4 ml of fresh media plus 37.2
gen. 20 µm sections were cut using a Leica CM1850 cryo- ng/ml GM-CSF. After 6 days in culture, BMDCs were stim-
stat. For immunostaining, tissue sections were blocked for 2 ulated with 10 ng/ml Lipopolysaccharides from Escherichia
hr at room temperature in 10% goat normal Serum (Sigma- coli 0111:B4 (Sigma-Aldrich) for 24 hr before harvesting.
Aldrich), 0.3% Triton X-100 (Sigma-Aldrich) in PBS. Pri-
RNAseq analysis. FRCs were cultured for 24h, adding 50
mary antibodies (table 1) were incubated overnight at 4¶C
µg/ml of CLEC-2-Fc from then beginning or 6 hours be-
in 10% goat normal Serum (Sigma-Aldrich), 0.01% Triton
fore collecting cells. Cells were left untreated as a control.
X-100 (Sigma-Aldrich) in PBS. 3 washing steps were used
RNA extractions were performed using the RNAeasy kit (Qi-
to remove unbound antibody, before incubation with the sec-
agen) following the manufacturer’s instructions, including a
ondary antibody plus Hoechst (Fisher Scientific) for 2 hr at
DNA digestion step to avoid genome contamination in fur-
room temperature. Samples were washed and mounted in
ther analysis. For transcriptome sequencing and analysis,
mowiol. Samples were imaged on a Leica TCS SP8 STED
RNA preparations from FRCs were sequenced to a depth
3X using HC PL APO CS2 /1.4 63x oil lenses.
of 9 million to 22 million reads by Queen Mary University
(QMUL) Genome Centre. The raw read quality control was
Image analysis. Conduit components: Podoplanin staining performed by the QMUL Genome Centre using Basesapce
was used to define the FRC network in LN frozen tissue Illumina software. Paired end FASTQ files were then aligned
sections. Podoplanin signal was filtered by Gaussian Blur to mus musculus GRCm38 reference assembly using STAR
(sigma=2) to remove background and thresholded identically aligner software (83). Transcripts were assembled and rela-
in all samples. We next created a selection that was used tive transcript abundance were calculated using Salmon soft-
in the corresponding channels in order to obtain the median ware (84). Using R (v3.4.4) and the Bioconductor txim-
intensity of the conduit components. We performed this pro- port package (85), TPM (Transcripts per million) values were
cess in a number of regions of interest within the T-cell area generated and annotated with ENSEMBL gene IDs. Bulk
for each LN, always minimising the presence of vasculature. TPM data were categorised by the fold change (>2 fold) be-
Semiautomated quantification of focal adhesion length: Sig- tween control, 6 hr and 24 hr conditions using an in-house
nal for phospho-Paxilin staining was thresholded equally in developed R script. Gene Ontology analysis were performed
all samples after removal of background noise by Gaussian using the PANTHER software (28, 29) and PCA plots were
Blur (sigma=2). Focal adhesions were segmented using the generated using the ggplot package in R.
analyse particle tool in Fiji and fit ellipse. Major axis of the
ellipse was used as an estimation of focal adhesion length. FRC-derived matrices. FRC-derived matrices were gener-
ated in vitro according to published methods (86). In brief,
Cell culture. Cell lines: In vitro experiments were per- gelatin-coated wells were used to culture FRC cell lines
formed using inmortalized WT (control) and PDPN knock- at 5x10³ cells/cm2 in culture media supplemented with 50
down mouse FRC cell lines previously described (9). For µg/ml L(+)-Ascorbic acid sodium salt (Sigma-Aldrich) for 5
CLEC-2-Fc expression by FRCs, Clec1b cDNA was cloned days, unless otherwise stated. Supplemented media was re-
into pFUSE-rIgG-Fc2 plasmids (Invivogen) and transfected plenished at day 1 and 3. For proteomic analysis, cells in their
into WT FRCs using lipofectamine 2000 (Thermo Fisher Sci- matrix were collected in PBS, centrifuged and resuspended in
entific). Transfected cells were selected by prolonged culture 4M Urea. For microscopy analysis, cells were lysed incubat-
with zeocin 100 µg/ml (Invivogen) and secretion of CLEC- ing for 15 min at 37°C in PBS 1% Triton X-100 20 mM am-
2-Fc was confirmed by western blotting for cell-derived su- monium hydroxide. Matrices were blocked with 2% bovine
pernatants (data not shown). FRC cell lines were cultured serum albumin (w/v) (Sigma-Aldrich) and stained with the
in DMEM plus glutamax (Life Technologies, Invitrogen) indicated antibodies (table 1). Samples were imaged with a
supplemented with 10% FBS, Penicillin-Streptomycin (100 Leica TCS SP5 Confocal Microscope using 63X oil HCX PL
10 | bioR‰iv Martinez et al. | ECM remodelling in Lymph NodesbioRxiv preprint first posted online Jan. 23, 2019; doi: http://dx.doi.org/10.1101/527481. The copyright holder for this preprint
(which was not peer-reviewed) is the author/funder, who has granted bioRxiv a license to display the preprint in perpetuity.
All rights reserved. No reuse allowed without permission.
APO lenses. of 300 nL/min. The mass spectrometer was operated in the
data-dependent mode to automatically switch between Or-
Proteomics of FRC-derived matrices. Quantitative pro- bitrap MS and MS/MS acquisition. Survey full scan MS
teomic analysis of the FRC-derived matrices was performed spectra (from m/z 400-2000) were acquired in the Orbitrap
by sequential window acquisition of all theoretical spectra with a resolution of 70,000 at m/z 400 and FT target value
mass spectrometry (SWATH MS). For construction of the of 1x10⁶ ions. The 20 most abundant ions were selected
spectral library, FRCs and derived matrices were washed for fragmentation using higher-energy collisional dissocia-
in PBS, centrifuged and enriched for extracellular matrix tion (HCD) and dynamically excluded for 30 seconds. Frag-
as previously described in Krasny et al. (2018). En- mented ions were scanned in the Orbitrap at a resolution of
riched matrices were digested using gel-assisted protocol 35,000 (TMT) at m/z 400. The isolation window was reduced
Shevchenko:2006co and desalted prior analysis by liquid to 1.2 m/z and a MS/MS fixed first mass of 120 m/z was
chromatography-tandem mass spectrometry (LC-MS/MS) on used to aid TMT detection. For accurate mass measurement,
Agilent 1260 HPLC coupled to TripleTOF 5600+ (SCIEX) the lock mass option was enabled using the polydimethyl-
mass spectrometer in data-dependent acquisition mode. For cyclosiloxane ion (m/z 445.120025) as an internal calibrant.
LC-MS/MS, peptides were spiked with iRT peptides (Biog- For peptide identification, raw data files produced in Xcal-
nosys AG), loaded on a 75 µm x 15 cm long analytical ibur 2.1 (Thermo Scientific) were processed in Proteome Dis-
column packed with Reprosil Pur C18-AQ 3 µm resin (Dr. coverer 1.4 (Thermo Scientific) and searched against Swis-
Maisch) end eluted using a linear gradient of 2-40% of sProt mouse (2011-03 release, 15,082,690 entries) database
Buffer B (98% ACN, 0.1% FA) in 90 min at flow rate of using Mascot (v2.2). Searches were performed with a pre-
250nl/min. Acquired datasets were searched by ProteinPilot cursor mass tolerance set to 10 ppm, fragment mass toler-
5.0.1 software (Sciex) against a Swissprot mouse database ance set to 0.05 Da and a maximum number of missed cleav-
and spectral library was generated in Spectronaut 11 (Biog- ages set to 2. Peptides were further filtered using a mascot
nosys AG) from the results and combined with previously significance threshold 20 and a
published library (Krasny et al. 2018). For quantitative anal- FDR 75%, maximum 4-PTM/peptide) (91). Phosphopeptides
using gel-assisted protocol. Desalted peptides were spiked from Proteome Discoverer 1.4 were normalized against total
with iRT peptides and analysed on the same LC-MS/MS in- protein levels (from in-gel digest experiments), and protein-
strument using identical LC conditions. MS/MS data were level phospho-site locations (phosphoRS 3.1 score >75%,
acquired in 60 SWATH windows with fixed size of 13 Da. maximum 4-PTM/peptide) were manually annotated using
SWATH spectra were analysed in Spectronaut 11 with FDR PhosphoSitePlus. Phosphoproteomic volcano plots display
restricted to 1%. Further statistical processing of median nor- mean Proteome Discoverer 1.4 quantification fold-difference
malized data was performed in Perseus (1.5.6, ref Tyanova et values across all replicates (log2) against two-tailed t-test P
al. Nat. Methods, 2016) values (calculated from arrays of raw MS/MS TMT intensity
counts). Volcano plots were assembled in GraphPad Prism 6
Isobaric Tandem Mass Tag (TMT) Phosphoproteomics. (non-linear Gaussian regression, least squares fit). For prin-
Isobaric Tandem Mass Tag (TMT) Phosphoproteomics were ciple component analysis (PCA), Proteome Discoverer 1.4
performed as described in Tape et al., Cell, 2016 (PMID: quantification ratio values were converted to log2, imported
27087446). Following treatment, FRCs were lysed in 6 M into R (version 3.0.1), computed using the function ‘prin-
urea, 10 mM NaPPi, 20 mM HEPES, pH 8.0, sonicated, cen- comp(X)’ and plotted in GraphPad Prism. Empirical parent
trifuged to clear cell debris, and protein concentration was kinases were manually identified by referenced Uniprot an-
determined by BCA (Pierce 23225). 200 µg of each condi- notation and putative parent kinases were manually assigned
tion were individually digested by FASP (87), amine-TMT- using ScanSite (92) 3 (‘High- Stringency’ setting, top 0.2%
10-plex-labeled (Pierce 90111) on membrane (iFASP) (88), of all sites, lowest score). Phospho-sites that did not meet
eluted, pooled, lyophilized, and subjected to automated phos- these conditions were not annotated.
phopeptide enrichment (APE) (89). Phosphopeptides were
desalted using OLIGO R3 resin (Life Technologies 1-1339- GFP secretion assay. FRC cells lines were transfected with
03) and lyophilized prior to liquid chromatography-tandem 500 ng of lumGFP plasmid (93) using Attractene Transfec-
mass spectrometry (LC-MS/MS) analysis. Samples were tion Reagent (Qiagen) for 8 hr. Culture media was replen-
run on a Q-Exactive Plus mass spectrometer (Thermo Sci- ished with fresh media. After 15 hr, supernatants were col-
entific) coupled to a Dionex Ultimate 3000 RSLC nano sys- lected and cells lysed in PBS 0.5% triton X-100. Super-
tem (Thermo Scientific). Reversed-phase chromatographic natants were centrifuged in order to remove cell debris. GFP
separation was performed on a C18 PepMap 300 Å trap car- levels in cell lysates and supernatants were measured by a
tridge (0.3 mm i.d. x 5 mm, 5 µm bead size; loaded in solid-phase sandwich ELISA (94). Briefly, polystyrene 96-
a bi-directional manner), a 75 µm i.d. x 50 cm column well plates were coated overnight with 200 µl/well of PBS
(5 µm bead size) using a 120 minute linear gradient of 0- plus sheep anti-GFP 1:50,000 for 1 hr at room temperature.
50% solvent B (MeCN 100% + 0.1% formic acid (FA)) The antibody solution was removed and the plates were then
against solvent A (H2O 100% + 0.1% FA) with a flow rate incubated for 1 hr at room temperature to block nonspecific
Martinez et al. | ECM remodelling in Lymph Nodes bioR‰iv | 11bioRxiv preprint first posted online Jan. 23, 2019; doi: http://dx.doi.org/10.1101/527481. The copyright holder for this preprint
(which was not peer-reviewed) is the author/funder, who has granted bioRxiv a license to display the preprint in perpetuity.
All rights reserved. No reuse allowed without permission.
binding by using 300 µl/well of TEB (1% Triton X-100, 0.2% washed and mounted on glass slides for imaging. Samples
gelatin, 1 mM EDTA in PBS). The TEB was removed, each were imaged in Leica TCS SP5 and SP8 STED 3X Confocal
well was filled with 200 µl of samples or standard curve in Microscopes using 63X HCX PL APO lenses or HC PL APO
TBE, and the plates were incubated while shaking for 1 hr. CS2 /1.4 63x oil lenses.
After extensive washing, plates were incubated with 200 µl
TBE plus Rabbit anti-GFP 1:20,000 for 1 hr with shaking. LL5— silencing by siRNA. WT FRC cell lines were trans-
Next, plates were washed and incubated with 200 µl/well of fected with four different siRNAs targeting LL5— expres-
Goat anti-Rabbit HRP 1:3,000 in TBE for 1 hr plus shaking. sion (Dharmacon, GE Healthcare) using lipofectamine 2000
Plates were washed three times in TBE and 3 times in PBS (Thermo Fisher Scientific). After 24 hr transfection, cells
and using a standard o-phenylenediamine assay. Percentage were washed and cultured in fresh media for an additional 12
of secreted GFP was calculated with respect to total GFP pro- hours before silencing efficiency was determined by qPCR.
duced (supernatant plus lysates). The following two siRNAs were selected for further assays: 1
GCAGAGUAUCAGCGGAACA and 2 GAACAAUGAAG-
Western Blotting. Equal number of cells were seeded and GACCGAGA. Scrambled RNA and non-template controls
cultured for 24 hours. Cells were washed with cold PBS and were used for comparison.
lysed using Laemmli buffer (BioRad). All lysates were son-
icated, heated for 10 min at 95°C and treated with 143 µM
Dextran uptake in vivo. Five days after immunization,
b-mercaptoethanol. Electrophoresis gels were loaded with
mice were injected subcutaneously in both flanks with 20
the same quantity of lysates and run for 45 min at 130 V.
µl of dextran solution (100 µg dextran per flank) conjugated
Transfer to PDVF membranes were carried out at 65 V for
to: Cascade Blue (10kDa dextran), Tetramethylrhodamine
2 hr. Membranes were blocked for 2 hr at room temperature
(70 kDa dextran) or Fluorescein (500 kDa dextran), all from
with 5 % skim milk powder (Sigma-Aldrich), 2 % BSA in
Thermo Fisher Scientific. Mice were culled and paired in-
PBS and stained with primary antibodies (table 1) overnight
guinal LNs (inflamed vs non-inflamed) collected after 30 or
at 4°C in 1:5 diluted blocking buffer. The next day, mem-
90 minutes for histological and flow cytometry analysis re-
branes were thoroughly washed in PBS 0.05% Tween 20 and
spectively.
incubated with HRP-conjugated secondary antibodies 1:5000
in 1:5 diluted blocking buffer.
Flow cytometry of LNs. Inguinal LNs were carefully dis-
Quantitative RT-PCR analysis for Phldb2 (LL5— ) mes- sected and digested using collagenase P at 200 µg/ml (Sigma-
senger RNA. cDNA was generated from RNA samples Aldrich), dispase II 800 µg/ml (thermos fisher scientific) and
using the SuperScript™ IV Reverse Transcriptase kit DNase I 100 µg/ml (Sigma-Aldrich) in RPMI at 37¶C in a
(Thermo Fisher Scientific), following manufacturer’s in- water bath. Every 10 min LNs were mixed by pipetting up
structions. Quantitative PCRs were run using the MESA and down and half of the digestion media replenished by
Blue qPCR Mastermix (SYBR Assay). We used specific fresh until all tissue was digested. Cell suspensions were cen-
primers for detection of Phldb2 mRNA transcripts 1 and trifuged, resuspended in FACS buffer (PBS 2 % FBS 10mM
2 (PrimerBank ID 23510303a1): Forward Primer AGC- EDTA) and filtered through a 70 µm cell strainer (Corning).
CGCGTTTCTGAAAGCA (1653-1671); Reverse Primer Cells were counted and approximately 1x10⁶ cells were used
CATCCGGGCGTCTTCCATT (1773-1755). Detection of for immunofluorescence staining. In brief, cells were resus-
GAPDH mRNA was used for normalization. pended in 100 µl FACS buffer, treated with Fc blocking for
10 min on ice and incubated with the indicated antibodies
Three-dimensional cell culture. FRCs were plated in 24- (table 1) for 30 min on ice. Cells were washed extensively
well MatTek plates at 3.5x10³ cell/cm2. Matured BMDCs and resuspended in 500 µl FACS buffer. Precision Count
were harvested and 150,000 cells were seeded per well in 150 Beads (BioLegend) were used for accurate cell count. Sam-
µl collagen/matrigel matrix plus 20 ng/ml rmGM-CSF (95– ples were run in a Fortessa X20 flow cytometer (BD Bio-
97). FRC:BMDC ratio 1:43. Gels were set at 37¶C for 30 sciences) at the UCL Cancer Institute and analysed using the
min. After 24 hr, cells were fixed, permeabilized and stained FlowJo software (FlowJo, LLC). Live cells were gated by
for the stated cellular components (table 1). FSC/SSC parameters and doublets discriminated by compar-
ing SSC-A versus SSC-H.
Immunostaining of cells in vitro. Cells were plated on
13 mm coverslips. Cells were fixed for 15 min in 3.6% Statistical analysis. Statistical analysis was performed us-
formaldehyde and permeabilized with triton X-100 0.3% for ing Prism 7 (GraphPad Software). For in vivo experiments,
15 min, at room temperature. Cells were blocked with PBS naïve versus inflamed LNs were compared by unpaired, para-
2% BSA for 1 hr at room temperature, followed by overnight metric t test, assuming that both populations had the com-
incubation with corresponding primary antibodies (table 1) parable standard deviation. For in vitro experiments and all
in PBS 1% BSA. After washing, cells were incubated with other multiple comparisons, ordinary one-way ANOVA fol-
Alexa-fluor-conjugated secondary antibodies plus Hoechst lowed by Tukey’s multiple comparisons test was performed.
and/or phalloidin to reveal DNA in cell nuclei and F-actin re- Binomial test type for PANTHER Overrepresentation Test of
spectively, all in PBS 1% BSA for 2 hr at room temperature, cellular components (RNAseq) and biological process (Phos-
12 | bioR‰iv Martinez et al. | ECM remodelling in Lymph NodesbioRxiv preprint first posted online Jan. 23, 2019; doi: http://dx.doi.org/10.1101/527481. The copyright holder for this preprint
(which was not peer-reviewed) is the author/funder, who has granted bioRxiv a license to display the preprint in perpetuity.
All rights reserved. No reuse allowed without permission.
phoproteomics) was used to analysed changes induced by chemokines and small blood-borne molecules through the splenic white pulp. The Journal
of Experimental Medicine, 198(3):505–512, August 2003.
CLEC-2 binding to FRCs. 16. Michael Sixt, Nobuo Kanazawa, Manuel Selg, Thomas Samson, Gunnel Roos, Dieter P
Reinhardt, Reinhard Pabst, Manfred B Lutz, and Lydia Sorokin. The conduit system trans-
ACKNOWLEDGEMENTS ports soluble antigens from the afferent lymph to resident dendritic cells in the T cell area of
The authors are grateful to J. Sanes for LL5 antibody, and to C. Reis e Sousa for the lymph node. Immunity, 22(1):19–29, January 2005.
CD11cCLEC-2 mice; A. Vaughan for assistance with microscopy, and C. Bennett 17. Ramon Roozendaal, Thorsten R Mempel, Lisa A Pitcher, Santiago F Gonzalez, Admar
for assistance with in vivo experiments. They are also grateful to C. Bennett, S. Verschoor, Reina E Mebius, Ulrich H von Andrian, and Michael C Carroll. Conduits mediate
Makris, C.M. de Winde and E. Sahai for critical reading of the manuscript. This transport of low-molecular-weight antigen to lymph node follicles. Immunity, 30(2):264–276,
work is supported by a Cancer Research UK (CRUK-A19763) (to S.E.A) and Med- February 2009.
ical Research Council (MC_U12266B). C.T is supported by Cancer Research UK 18. Gregg P Sobocinski, Katherine Toy, Walter F Bobrowski, Stephen Shaw, Arthur O Ander-
(C60693/A23783). T.S is supported by the Wellcome Trust (105604/Z/14/Z). S.D son, and Eric P Kaldjian. Ultrastructural localization of extracellular matrix proteins of the
is supported by Swiss National Science Foundation (grants P2BSP3/ 158804 and lymph node cortex: evidence supporting the reticular network as a pathway for lymphocyte
P300PA_167657) and EHA Research Grant award granted by the European Hema- migration. BMC immunology, 11(1):42, 2010.
tology Association. L.K. and P.H. are supported by the Institute of Cancer Research 19. Deepali Malhotra, Anne L Fletcher, Jillian Astarita, Veronika Lukacs-Kornek, Prakriti Tay-
and Breast Cancer Now (2014NovPR360). alia, Santiago F Gonzalez, Kutlu G Elpek, Sook Kyung Chang, Konstantin Knoblich, Mar-
AUTHOR CONTRIBUTIONS tin E Hemler, Michael B Brenner, Michael C Carroll, David J Mooney, Shannon J Turley,
V.G.M. and S.E.A designed the study and wrote the manuscript. V.G.M A.B and and Immunological Genome Project Consortium. Transcriptional profiling of stroma from
V.P performed in vitro experiments. V.G.M and S.D performed in vivo experiments. inflamed and resting lymph nodes defines immunological hallmarks. Nature Immunology,
L.K. and P.H. performed mass spectrometry of ECM. C.T designed and performed 13(5):499–510, April 2012.
TMT-Proteomics experiments. I.W and J.B. performed E.M of conduit structures, 20. Meilang Xue and Christopher J Jackson. Extracellular Matrix Reorganization During Wound
T.S, H.H and J. KV performed bioinformatics and statistical analyses. All authors Healing and Its Impact on Abnormal Scarring. Advances in wound care, 4(3):119–136,
contributed to editing the manuscript. March 2015.
21. Thomas A Wynn and Thirumalai R Ramalingam. Mechanisms of fibrosis: therapeutic trans-
lation for fibrotic disease. Nature Medicine, 18(7):1028–1040, July 2012.
Bibliography 22. Timothy W Schacker, Jason M Brenchley, Gregory J Beilman, Cavan Reilly, Stefan E Pam-
buccian, Jodie Taylor, David Skarda, Matthew Larson, Daniel C Douek, and Ashley T Haase.
1. Matthew B Buechler and Shannon J Turley. A short field guide to fibroblast function in Lymphatic tissue fibrosis is associated with reduced numbers of naive CD4+ T cells in hu-
immunity. Seminars in immunology, 35:48–58, February 2018. man immunodeficiency virus type 1 infection. Clinical and vaccine immunology : CVI, 13
2. Mario Novkovic, Lucas Onder, Hung-Wei Cheng, Gennady Bocharov, and Burkhard (5):556–560, May 2006.
Ludewig. Integrative Computational Modeling of the Lymph Node Stromal Cell Landscape. 23. Ming Zeng, Anthony J Smith, Stephen W Wietgrefe, Peter J Southern, Timothy W Schacker,
Frontiers in Immunology, 9:2428, 2018. Cavan S Reilly, Jacob D Estes, Gregory F Burton, Guido Silvestri, Jeffrey D Lifson, John V
3. Lauren B Rodda, Erick Lu, Mariko L Bennett, Caroline L Sokol, Xiaoming Wang, Sanjiv A Carlis, and Ashley T Haase. Cumulative mechanisms of lymphoid tissue fibrosis and T cell
Luther, Ben A Barres, Andrew D Luster, Chun Jimmie Ye, and Jason G Cyster. Single-Cell depletion in HIV-1 and SIV infections. The Journal of clinical investigation, 121(3):998–1008,
RNA Sequencing of Lymph Node Stromal Cells Reveals Niche-Associated Heterogeneity. March 2011.
Immunity, 48(5):1014–1028.e6, May 2018. 24. Angela Riedel, David Shorthouse, Lisa Haas, Benjamin A Hall, and Jacqueline Shields.
4. Alexander Link, Tobias K Vogt, Stéphanie Favre, Mirjam R Britschgi, Hans Acha-Orbea, Tumor-induced stromal reprogramming drives lymph node transformation. Nature Immunol-
Boris Hinz, Jason G Cyster, and Sanjiv A Luther. Fibroblastic reticular cells in lymph nodes ogy, 17(9):1118–1127, September 2016.
regulate the homeostasis of naive T cells. Nature Immunology, 8(11):1255–1265, November 25. N A Rohner, J McClain, S L Tuell, A Warner, B Smith, Y Yun, A Mohan, M Sushnitha, and
2007. S N Thomas. Lymph node biophysical remodeling is associated with melanoma lymphatic
5. Viviana Cremasco, Matthew C Woodruff, Lucas Onder, Jovana Cupovic, Janice M Nieves- drainage. The FASEB Journal, 29(11):4512–4522, November 2015.
Bonilla, Frank A Schildberg, Jonathan Chang, Floriana Cremasco, Christopher J Harvey, 26. Bin Yang, Jennifer B Treweek, Rajan P Kulkarni, Benjamin E Deverman, Chun-Kan Chen,
Kai Wucherpfennig, Burkhard Ludewig, Michael C Carroll, and Shannon J Turley. B cell Eric Lubeck, Sheel Shah, Long Cai, and Viviana Gradinaru. Single-cell phenotyping within
homeostasis and follicle confines are governed by fibroblastic reticular cells. Nature Im- transparent intact tissue through whole-body clearing. Cell, 158(4):945–958, August 2014.
munology, 15(10):973–981, October 2014. 27. Marc Bajénoff and Ronald N Germain. B-cell follicle development remodels the conduit
6. Je-Wook Lee, Mathieu Epardaud, Jing Sun, Jessica E Becker, Alexander C Cheng, Ai- system and allows soluble antigen delivery to follicular dendritic cells. Blood, 114(24):4989–
ris Yonekura, Joan K Heath, and Shannon J Turley. Peripheral antigen display by lymph 4997, December 2009.
node stroma promotes T cell tolerance to intestinal self. Nature Immunology, 8(2):181–190, 28. Huaiyu Mi, Xiaosong Huang, Anushya Muruganujan, Haiming Tang, Caitlin Mills, Diane
February 2007. Kang, and Paul D Thomas. PANTHER version 11: expanded annotation data from Gene
7. Anne L Fletcher, Veronika Lukacs-Kornek, Erika D Reynoso, Sophie E Pinner, Angelique Ontology and Reactome pathways, and data analysis tool enhancements. Nucleic acids
Bellemare-Pelletier, Mark S Curry, Ai-Ris Collier, Richard L Boyd, and Shannon J Tur- research, 45(D1):D183–D189, January 2017.
ley. Lymph node fibroblastic reticular cells directly present peripheral tissue antigen under 29. Huaiyu Mi, Anushya Muruganujan, John T Casagrande, and Paul D Thomas. Large-scale
steady-state and inflammatory conditions. The Journal of Experimental Medicine, 207(4): gene function analysis with the PANTHER classification system. Nature protocols, 8(8):
689–697, April 2010. 1551–1566, August 2013.
8. Juan Dubrot, Fernanda V Duraes, Lambert Potin, Francesca Capotosti, Dale Brighouse, To- 30. Alexandra Naba, Karl R Clauser, Sebastian Hoersch, Hui Liu, Steven A Carr, and Richard O
bias Suter, Salomé LeibundGut-Landmann, Natalio Garbi, Walter Reith, Melody A Swartz, Hynes. The matrisome: in silico definition and in vivo characterization by proteomics of
and Stéphanie Hugues. Lymph node stromal cells acquire peptide-MHCII complexes from normal and tumor extracellular matrices. Molecular & cellular proteomics : MCP, 11(4):
dendritic cells and induce antigen-specific CD4 T cell tolerance. The Journal of Experimen- M111.014647, April 2012.
tal Medicine, 211(6):1153–1166, June 2014. 31. Alexandra Naba, Karl R Clauser, Huiming Ding, Charles A Whittaker, Steven A Carr, and
9. Sophie E Acton, Aaron J Farrugia, Jillian L Astarita, Diego Mourão-Sá, Robert P Jenkins, Richard O Hynes. The extracellular matrix: Tools and insights for the “omics” era. Matrix
Emma Nye, Steven Hooper, Janneke van Blijswijk, Neil C Rogers, Kathryn J Snelgrove, Biology, 49:10–24, January 2016.
Ian Rosewell, Luis F Moita, Gordon Stamp, Shannon J Turley, Erik Sahai, and Caetano 32. Alexandra Naba, Oliver M T Pearce, Amanda Del Rosario, Duanduan Ma, Huiming Ding,
Reis e Sousa. Dendritic cells control fibroblastic reticular network tension and lymph node Vinothini Rajeeve, Pedro R Cutillas, Frances R Balkwill, and Richard O Hynes. Charac-
expansion. Nature, 514(7523):498–502, October 2014. terization of the Extracellular Matrix of Normal and Diseased Tissues Using Proteomics.
10. Jillian L Astarita, Viviana Cremasco, Jianxin Fu, Max C Darnell, James R Peck, Janice M Journal of proteome research, 16(8):3083–3091, August 2017.
Nieves-Bonilla, Kai Song, Yuji Kondo, Matthew C Woodruff, Alvin Gogineni, Lucas Onder, 33. Peter D Ellis, James C Metcalfe, Marko Hyvönen, and Paul R Kemp. Adhesion of endothelial
Burkhard Ludewig, Robby M Weimer, Michael C Carroll, David J Mooney, Lijun Xia, and cells to NOV is mediated by the integrins alphavbeta3 and alpha5beta1. Journal of vascular
Shannon J Turley. The CLEC-2–podoplanin axis controls the contractility of fibroblastic research, 40(3):234–243, May 2003.
reticular cells and lymph node microarchitecture. Nature Immunology, 16(1):75–84, October 34. Filippo Gagliardi, Ashwin Narayanan, and Pietro Mortini. SPARCL1 a novel player in cancer
2014. biology. Critical reviews in oncology/hematology, 109:63–68, January 2017.
11. Andrea J Radtke, Wolfgang Kastenmüller, Diego A Espinosa, Michael Y Gerner, Sze-Wah 35. Kai Yin, Mengyuan Shang, Shengchun Dang, Linjun Wang, Yiwen Xia, Lei Cui, Xin Fan,
Tse, Photini Sinnis, Ronald N Germain, Fidel P Zavala, and Ian A Cockburn. Lymph-node Jianguo Qu, Jixiang Chen, and Zekuan Xu. Netrin-1 induces the proliferation of gastric
resident CD8–+ dendritic cells capture antigens from migratory malaria sporozoites and cancer cells via the ERK/MAPK signaling pathway and FAK activation. Oncology Reports,
induce CD8+ T cell responses. PLoS pathogens, 11(2):e1004637, February 2015. 40(4):2325–2333, August 2018.
12. Gwendalyn J Randolph, Stoyan Ivanov, Bernd H Zinselmeyer, and Joshua P Scallan. The 36. Angara Sureshbabu, Hiroshi Okajima, Daisuke Yamanaka, Elizabeth Tonner, Surya Shas-
Lymphatic System: Integral Roles in Immunity. Annual Review of Immunology, 35(1):31–52, tri, Joanna Maycock, Malgorzata Szymanowska, John Shand, Shin-Ichiro Takahashi, James
April 2017. Beattie, Gordon Allan, and David Flint. IGFBP5 induces cell adhesion, increases cell sur-
13. Mirela Kuka and Matteo Iannacone. The role of lymph node sinus macrophages in host vival and inhibits cell migration in MCF-7 human breast cancer cells. Journal of Cell Science,
defense. Annals of the New York Academy of Sciences, 1319(1):38–46, June 2014. 125(Pt 7):1693–1705, April 2012.
14. J E Gretz, C C Norbury, A O Anderson, A E Proudfoot, and S Shaw. Lymph-borne 37. Koji Ohashi, Takashi Enomoto, Yusuke Joki, Rei Shibata, Yasuhiro Ogura, Yoshiyuki
chemokines and other low molecular weight molecules reach high endothelial venules via Kataoka, Yuuki Shimizu, Takahiro Kambara, Yusuke Uemura, Daisuke Yuasa, Kazuhiro
specialized conduits while a functional barrier limits access to the lymphocyte microenviron- Matsuo, Satoko Hayakawa, Mizuho Hiramatsu-Ito, Toyoaki Murohara, and Noriyuki Ouchi.
ments in lymph node cortex. The Journal of Experimental Medicine, 192(10):1425–1440, Neuron-derived neurotrophic factor functions as a novel modulator that enhances endothe-
November 2000. lial cell function and revascularization processes. The Journal of biological chemistry, 289
15. Martijn A Nolte, Jeroen A M Beliën, Inge Schadee-Eestermans, Wendy Jansen, Wendy W J (20):14132–14144, May 2014.
Unger, Nico Van Rooijen, Georg Kraal, and Reina E Mebius. A conduit system distributes 38. Wei Jia, Hong Li, and You-Wen He. The extracellular matrix protein mindin serves as an
Martinez et al. | ECM remodelling in Lymph Nodes bioR‰iv | 13You can also read