Deep Fusion Model Based Enhanced Convolution Neural Networks for MRI Brain Image Classification System
←
→
Page content transcription
If your browser does not render page correctly, please read the page content below
International Journal of Recent Technology and Engineering (IJRTE)
                                                                            ISSN: 2277-3878, Volume-8 Issue-5, January 2020

            Deep Fusion Model Based Enhanced
         Convolution Neural Networks for MRI Brain
                Image Classification System
                                J. Andrews, A. Jayachandran, T.Sudersson Rama Perumal

                                                                         of the brain is very hard and has limited space. Any growth
   Abstract: Magnetic Resonance (MR) Imaging is a popular                inside the brain builds up many problems. Tumors of the brain
non-invasive modality for the visualization of different                 can be classified as cancerous (malignant) ornon-cancerous
abnormalities in the brain due to its good soft-tissue contrast and
                                                                         (benign). As these cell tumors starts to grow they creates a
accessibility of multispectral images. Using information from MR
images, CAD systems have been developed to benefit doctors in            pressure within the skull to increase. Which damages the
rapid diagnosis. CAD systems can provide the diagnosis                   brain and it is also a life-threatening. There are two types f
depending upon the specific attributes present in the medical            brain tumors, primary and secondary. A tumor which forms in
images. The present study proposes a comprehensive method for            the brain is termed as primary brain tumor. When the tumor is
the diagnosis of the cancerous region in the MRI images. Here,           occurring due to the cancer cells of another organ which is
after image noise reduction, optimal image segmentation based
on Support Vector Neural neural algorithm is utilized. Afterward,        spread to the brain is known as secondary or metastatic brain
an optimized feature extraction and feature selection based on a         tumor. Primary brain tumors are more usually occurs in
modified region growing optimization algorithm are proposed for          children and older adults. Secondary brain tumor is often
improving the classification accuracy of brain images. Further, it       found on adults. The MRI sequence images are used here as
is also proposed that the input MR brain image be de-noised using        they represent a particular appearance of tissue which
a non-local Euclidean median in non-subsampled contourlet
                                                                         depicted in terms of no. of radio-frequency and
space. The classification accuracy of MRG with SVM is 74.24%,
MRG with CNN is 82.67% and MRG with ANN is 62.71% and our                gradients[4-5].
proposed method MRG with MBCNN is 91.64%.                                   This provides different sequences showing different
                                                                         contrast levels between tissues which helps in diagnosis
  Keywords: MRI image, CNN, Classification, Denoising,
Texture.                                                                 diseases. This builds a need for classification or separation of
                                                                         MRI sequences into number of different slices namely
                     I. INTRODUCTION                                     proton-density (PD) weighted, T1-weighted, T2-weighted,
                                                                         diffusion-weighted,flow sensitive and 'miscellaneous'. In our
   The brain is a crucial part of the human body which plays
                                                                         proposed work 3 main slices for detection of brain tumor used
an important role in controlling all parts of the human organ.
                                                                         are:
Sometimes the brain is affected by the unnatural growth of
                                                                            • T1-weighted MRI: Since T1 w allows for an easy
abnormal cells in the tissues. This abnormal growth of cells is
                                                                         annotation of the healthy tissues, it has become the most
called Brain tumor which can be cancerous or noncancerous.
                                                                         commonly used sequence images for the brain tumor structure
Uncontrolled brain tumor leads to death to the patients. So, it
                                                                         analysis.
is necessary to detect the tumor as early as possible to reduce
                                                                            • T2-weighted MRI: T2- weighted images reflect the decay
the chances of death of the patient. Human Brain is made up
                                                                         speed of magnetic moment in the transverse relaxation.
of numerous number of cells called as neurons. Each cell
                                                                            • PD-Proton Density-weighted MRI: These images reflect
carries a different function from another. The term growth of a
                                                                         the difference between proton density.
cell includes cell division and cell reproduction. When the
                                                                            Contours usually contain key visual information of an
cycle of growth of cell fails to control then the cell grows and
                                                                         image. In computer vision, contours have been widely used in
divides very often irregularly.Then these excess cells make a
                                                                         many practical tasks. Although quite a few contour detection
mass of tissues and termed it as a tumor[1-3]. Thus a brain
                                                                         methods have been developed over the past several decades,
tumor, can be defined as a collection of abnormal cells
                                                                         contour detection is still a challenging problem in the image
developed inside the brain. Skull
                                                                         field. Among the non-learning approaches, many early
                                                                         methods, such as the famous Canny detector, find contours by
                                                                         extracting edges where the brightness or color changes
Revised Manuscript Received on January 15, 2020.                         sharply. However, such methods usually employ regular
* Correspondence Author
    *Dr. J.Andrews, Associate Professor, Department of CSE, Presidency   kernels, e.g., Gaussian filter and Gabor filter , to measure the
University, Bangalore. India                                             extents of local changes, and thus can hardly deal with
andrewsj@presidencyuniversity.in                                         textures.
     Dr. A. Jayachandran ,Associate Professor, Department of CSE,
Presidency University, Bangalore.India.
 ajayachandran@presidencyuniversity.in.
     Mr. T.Sudersson Rama Perumala ,Associate Professor ,Department of
CSE, Rajas Engineering college,Tirunelveli, India

                                                                               Published By:
   Retrieval Number: D7792118419/2020©BEIESP                                   Blue Eyes Intelligence Engineering
   DOI:10.35940/ijrte.D7792.018520                                   3511      & Sciences Publication
Deep Fusion Model Based Enhanced Convolution Neural Networks for MRI Brain Image Classification System
To address this problem, many texture suppression the average of the gray levels with a filter mask. In this
methods have been proposed. Examples are the method based proposed method, 5x5 filter mask was used for filtering
on non classical receptive field inhibition, the method approach that enhanced the image quality and reduced noise.
based on sparseness measures, the method based on This filter operation had done by the convolution sum of the
surround-modulation, etc. It has been validated that texture filter mask with corresponding intensity values in an
suppression can help improve contour detection performance. image[12].
Nonetheless, these methods still mainly use low-level local 2.2 Segmentation of brain tumor region using Optimal
features. Moreover, some of them are computationally heavy, Thresholding
which leads to difficulties in practical applications[6-8]. As compared with other methods, region growing results
Magnetic Resonance (MR) Imaging is a popular with faster and accurate segmentation. Region growing
non-invasive modality for the visualization of different methods can correctly separate the regions that have the same
abnormalities in the brain due to its good soft-tissue contrast properties. It can provide the original images which have clear
and accessibility of multispectral images. Using information edges for the good segmentation results with less time
from MR images, CAD systems have been developed to compared to other methods. The approach is more innovative
benefit doctors in rapid diagnosis. CAD systems can provide and novel as we can place the seed points inside the edge of
the diagnosis depending upon the specific attributes present in the affected region and not on the centre point of the affected
the medical images. Typically, these systems usually employ region. This method can be carried out manually or
the steps of preprocessing, attribute extraction, selection, and automatically. By using region-growing method brain tumor
classification for categorizing normal/ abnormal brain MR region is segmented [13-14]. Here the seed point is manually
images. Numerous methods have been proposed in the selected and corresponding pixels are grouped by comparing
literature that employs classical machine learning algorithms seed pixel with neighboring pixels. Consider if the selected
for the detection of abnormal brain images. These studies seeds forms number of regions. 1, 2, 3,….. .
have proposed solutions based on K-nearest neighbour For each repetition, one pixel will be added into the regions.
(k-NN), Support vector machine (SVM), Kohonen-Hopfield Now using the region after steps and not allotted set of
neural network (KHNN), and Artificial neural networks pixel, it is given in Eqn(1)
(ANN), etc[9-10]. This paper is organized as follows; section n n
II states about the existing work associated with MRI brain L u RRi / I (u ) RRi (1)
image segmentation. Section III describes about the proposed i 1 i 1
framework consists of preprocessing, feature extraction, Where, ( ) is the adjoining neighbor of pixel , uϵL
feature selection, similarity measure and classifier. Section IV means ( ) maps exactly one RRi and ( ) = {1,2,..,n} with
contains experimental results. The summarization of the satisfying the condition, ( ) ∩ ≠ ∅ and ( ) finds the
proposed system is given in section V. difference from the neighboring regions of u. ( ) Can be
expressed as per Eqn(2):
II. METHODOLOGY
(u ) g (u ) meany RRi (u ) g ( y)
The proposed system fusses and registers the three MRI scan (2)
images, by extracting Gray Level Run Length Matrix (u ) min u L (u )
(GLRLM) and Centre-Symmetric Local-Binary Patterns Where, ( )is gray-scale value of pixel of existing
(CSLBP) and features are stored in the database, CNN boundary pixels and ∈ follows that and u belongs to
classifier is used to divide the brain images as Benign tumor , RRi,the above procedure continued till all the pixels are
Malignant tumor and Normal. assigned. Our "ideal thresholding approach" sections the
A. Image Enhancement and Noise Removal picture by thresholding the distinction lattice of the likelihood
delineate, while taking into tally the pixel's tissue compose
This section provides some techniques to enhancement of
and quality of its probability. The key thought behind our
MRI which can perform image enhancement and noise
approach is to distinguish all pixels whose shading attributes
removal techniques that enhance quality of the images for
are like those of the seed pixel, before iteratively refining the
better segmentation accuracy. This primary stage plays a
division limit. The refinement is by basic thresholding of the
significant role to detect, trace and extract the brain tumor
distinction lattice, Q, which is a grid of the contrast between
region from hemisphere. Because in this step images are
the two most noteworthy probabilities for every pixel, and
changes to finer, sharper and enhanced. The enhanced image
gives a moment level of
is finer than the original one for the specific application and
tissue membership probability and this can be communicated
gives the more accurate segmentation. The main objectives of
as per Eqn(3)
this step is improve image and quality[11].
Mostly segmentation process depends on the sharp Q Pmax1 Pmax 2 (3)
transition of image intensity level. A blur or noisy image is not
where Pmax1 max( P) and Pmax 2 max( P) ,
appropriate for extract information. The average filter has
been applied in this method for smoothing the images by P Pmax1
reducing the image intensity values variation from one pixel
to another. An average filter is a linear smoothing filter that
was done by the value of each pixel in an image replaced with
Published By:
Retrieval Number: D7792118419/2020©BEIESP
Blue Eyes Intelligence Engineering
DOI:10.35940/ijrte.D7792.018520 3512 & Sciences PublicationInternational Journal of Recent Technology and Engineering (IJRTE)
ISSN: 2277-3878, Volume-8 Issue-5, January 2020
The region of interest (ROI) pointis defined as the region in Density features are obtained through the following steps:
Q and the next step is to iteratively threshold the ROI.At each First, separate or divide the MRI brain into two regions are
step the mean of the segmented ROI,where the seed point is inner and outer regions. Inner region minor axis is equal to the
located is calculated. Theoretically if the mean value will half minor axis of the outer region. Second, calculate the
decrease ,the threshold value also decrease. The optimal average brightness of the inner and outer region. Finally,
threshold is defined as the threshold value where the mean calculate the density degree for MRI images using the Eqn(4).
values become ‘stable’ without any sudden decreases or inner
DensityDegree (4)
increase. The segmented region can be obtained by
outer
thresholding the ROI with the optimal threshold value.
Experimentally, the suitable values for the threshold τ, and
step size are 0.1,0.01 respectively. Pseudo code for the
proposed segmentation approach is as follows.
Input: 4D probability map, P
Output: Segmented lesion region, I x, y
Procedure:
1 Compute probability difference matrix, Q
2 Based on probability map of seed pixel, identify ROI
3 Set max(Q)
4 Set 0.1
5 Set step 0.01
6 Set th
7 While th
seg ROI th
segmean mean(seg )
th th step
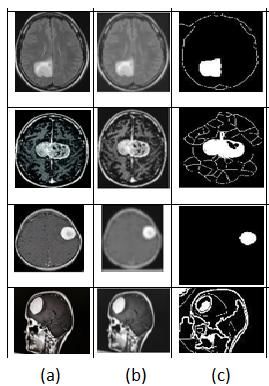
end Fig 1 Segmentation results (a) original image (b)
Preproessed image (c) Segmented image
8 Identify optimal threshold, thopt based on
Mostly, the effective classification is subjective to the
segmean image features which are associated with an edges and the
9 I x, y ROI thopt depth of the network. Hence above mentioned pre-processing
techniques are applied to the incoming image sequences to
10 Perform morphological operations on I x, y preserve the features edge and the connectivity of each edges
for better classification. We boosted our network to the
Finally, the segmented MRI image I x, y for the maximum in all possible ways and hence named as Maximum
pre-processed image Dn will be generated using our Boosted Convolutional Neural Network.
Classification of diseases is a crucial aspect in disease
proposed hybrid segmentation method and the following
section illustrate the feature extraction for the segmented categorization through image processing techniques. The
categorization of diseases according to pathogen groups is a
image I x , y
significant research domain and potentially a challenging area
of work.. Classification and detection are very similar, but in
III. FEATURE EXTRACTION AND CLASSIFICATION classification primary focus is on the categorization of various
diseases and then the classification according to various
The Feature extraction approach is one of the important pathogen groups. It consists of two stages such as training
methods to classification accuracy. It extracts the relevant phase and testing phase. Mostly, the effective classification is
information of brain image and it is formed in a feature vector. subjective to the image features which are associated with an
The obtained feature vector is applied to retrieval process or edges and the depth of the network. Hence above mentioned
classification process. In this paper, from the MRI brain
pre-processing techniques are applied to the incoming image
image three types of features are extracted on the basis of their
sequences to preserve the features edge and the connectivity
shape, margin and their density. The shape features provide
of each edges for better classification. We boosted our
the boundaries of the MRI brain image; margin features used
to describe the margin characteristics of the MRI brain image network to the maximum in all possible ways and hence
and finally the third feature of density feature represents the named as Maximum Boosted Convolutional Neural Network.
brightness variation of the MRI brain image. Finally, the CNN structure normally includes convolutional layer,
obtained three features are formed into a single feature vector. max-pooling layer with an activation function and a fully
MRI Brain image is represented in gray levels where density connected layer.
degree is denoted by their brightness variation of MRI image.
Published By:
Retrieval Number: D7792118419/2020©BEIESP Blue Eyes Intelligence Engineering
DOI:10.35940/ijrte.D7792.018520 3513 & Sciences PublicationDeep Fusion Model Based Enhanced Convolution Neural Networks for MRI Brain Image Classification System
If the input of 2D convolutional layer is ( , ) , and the evaluation in this work is conducted with widely used
corresponding feature map ( , ) will be obtained by statistical measures, sensitivity, specificity and accuracy, it is
convolving the input data defined in Eqn(8) [15-16].
with a convolution kernel ( , ) of size × , it is defined
in Eqn(5). Tp
M 1 N 1 Sensitivity
Tp Fn
s( x, y ) I (m, n) * w( x m, y n)
m 0 n 0 Tn
(5) Specificity
Tn Fp
IV. DEEP FUSION MODEL Tp Tn
Accuracy
The two individual MBCNN features are fused and Tp Fp Tn Fn (8)
combined with LSTM for learning the deterministic spatial
feature information of each image sequences in series of time The experimental results of sensitivity, specificity and
to realize FER task. As shown in Fig.1, the proposed model is accuracy are given in Figure 2.Experimental results are also
a composition of two deep learning structures. On the one validated using k-fold cross validation method, the overall
hand, the proposed MBCNN has the ability to extract features results are summarized in table 1
and on the other hand, LSTM models the contextual
information of arbitrary sequences in each time step. Besides
the pre- processing techniques forms two input layer and fed
into to the first convolutional layer of two individual MBCNN
base model. The successive convolutional layers with batch
normalization and activation function followed by fully
connected layer forms the feature sampling layer which
establish feature map of each expression.The two MBCNN
feature layers are fused and it is given as per Eqn(6)
( )={ ( ) ⊕ ( ) )} (6)
where ( ) is the output of fusion layer, ⊕ is the operation of
matrix addition, ( ) is the th equalised image features,
and ( ) is the th edge enhanced features obtained from the
original image sequence after pre-processing. More Figure 2 Experimental results of proposed method
specifically, the knowledge of each expression features are Table 1 Overall summarized result of proposed MRG
transferred from the fused MBCNN to the LSTM model. Now with different classifiers using k-fold method
LSTM feature learning layer generates new representative Methods Sensitivity(%) Specificity (%) Accuracy (%)
feature vector. Furthermore, Global Average Pooling (GAP) ANN 62.4 63.5 62.7
is considered which globally reduces the dimensionality of
SVM 74.4 72.5 74.24
spatial features by averaging all the feature vectors obtained
CNN 82.65 82.7 82.67
from the previous layer. According to [48], GAP avoids over
fitting as it is a structural regularizer and no parameters are MBCNN 91.6 92.2 91.64
needed to optimize. Hence it produce the confidence feature
maps and better approximation of expression categories. V. CONCLUSION
Finally, the softmax layer classifies and predicts the The development of the computer-aided detection systems
probability of each expression labels based on the input and in recent years turned them into a nondestructive and popular
learned feature maps. In multi-class facial expression method for the cancer diagnosis in MRI images. The method
classification, the softmax has an ability to classify a non- includes different parts of image processing: in the first step,
linear functions easily. However, it increases the the original images have been pre-processed by a anisiotropic
generalization of our model. The Softmax layer is given as per filter for the noise elimination. Afterward, an optimized image
Eqn(7) segmentation based on region growing algorithm is used for
segmenting the cancer area from the background. Then,
(7) several features are extracted for improving the process of
The performance of MRI Brain image classification was classification accuracy. To achieve an optimal feature
extraction, an optimal method is used for selecting the useful
evaluated on collected images from National Cancer Institute
features and for pruning the remained useless features. After
database (http://cancerimagingarchive.net.. Here, the dataset
feature extraction, they trained into an SVNN classifier to
composed comprises of 20 different patients with 200 MRI diagnosis what input image is cancerous or healthy. The
images. Three orders of MR images has considered for each image segmentation and the feature selection parts are
patient i.e., T1, T2 and FLAIR. However, each volume holds optimized based on the newly introduced grasshopper
a dissimilar number of slices that is 100–150. In this paper optimization algorithm.
divide the framework into two categories where 100 abnormal
and 40 normal images respectively. Classifier performance
Published By:
Retrieval Number: D7792118419/2020©BEIESP
Blue Eyes Intelligence Engineering
DOI:10.35940/ijrte.D7792.018520 3514 & Sciences PublicationInternational Journal of Recent Technology and Engineering (IJRTE)
ISSN: 2277-3878, Volume-8 Issue-5, January 2020
In future, optimal feature selection method has to be various international Journals. He has published more than 40 papers in
various international and National Journals..
implemented, which should be followed with the
development of improved deep learning architecture that may
give higher potential in tumor detection and classification. Dr.A.Jayachandran received his Ph.D. Degree in
Computer Science and Engineering specialization from
ANNA University, Chennai, Tamil Nadu in 2014, He
REFERENCES received his M.Tech (IT) degree from university
1. Eman Abdel-Maksoud, Mohammed Elmogy, Rashid Al-Awadi. "Brain uthor-2 Department, M.S University, Tirunelveli, Tamil Nadu in
tumor segmentation based on a hybrid clustering technique", Egyptian 2007.Photo
Presently he is working as Associate Professor in the Department of
Informatics Journal, 2015. Computer Science & Engineering, School of Engineering, Presidency
2. Dhanasekaran, R ,Jayachandran, A.,(2014): Severity analysis of brain University, Bangalore. He has published several papers in various National
tumor in MRI images uses modified multi-texton structure descriptor and International Journals with high Impact factors, also five research
and kernel- SVM. Arab. J. Sci. Eng. 39(10),7073–7086 (2014). scholars are completed Ph.D., under his guidance. He has 40 publications
3. Cagney DN, Martin AM, Catalano PJ, et al. Incidence and prognosis of with 161 citations. His research interests include Image processing and
patients with brain metastases at diagnosis of systemic malignancy: a machine Learning.
population-based study. NeuroOncol. 2017;19(11):1511-1521.
4. Kromer C, Xu J, Ostrom QT, et al. Estimating the annual frequency of
synchronous brain metastasis in the United States 2010-2013: a Mr .T. Sudarson Rama Perumal received his B.E
population-based study. J Neurooncol. 2017;134(1):55-64. degree in Electronics and Communication Engineering
5. C Mahiba, A Jayachandran, "Severity analysis of diabetic retinopathy in from Noorul Islam College of Engineering, Anna
retinal images using hybrid structure descriptor and modified University, Chennai. He received his M.E. degree in
CNNs",Measurement,Volume 135, March 2019, Pages 762-767. Author-3 Computer Science and Engineering from Tagore
6. Jayachandran, A and R.Dhanasekaran 2013,’ Brain Tumor Detection Engineering
Photo College, Anna University, Chennai. He is currently working as an
using Fuzzy Support Vector Machine Classification based on a Texton Assistant Professor of Computer Science and Engineering department at
Co-occurrence Matrix’, Journal of imaging Science and Technology’, Rajas College of Engineering, Tirunelveli. His Research interested areas are
Vol 57, No 1, pp. 10507-1-10507-7(7),2013. Machine Learning ,Wireless communication.
7. Bar, Y., Diamant, I., Wolf, L., Lieberman, S., Konen, E., Greenspan, H.:
Chest pathology detection using deep learning with non-medical
training. In: ISBI. pp. 294–297 (2015).
8. Kharmegasundaraj.G, Jayachandran, A, (2016) ‘Abnormality
segmentation and Classification of multi model brain tumor in MR
images using Fuzzy based hybrid kernel SVM’ International Journal of
Fuzzy system , Volume 17, Issue 3, pp 434-443.
9. Vecht CJ, Haaxma-Reiche H, Noordijk EM, et al. Treatment of single
brain metastasis: radiotherapy alone or combined with neurosurgery?
Ann Neurol. 1993;33(6):583-590.
10. Jayachandran, A and R.Dhanasekaran ,(2017) ‘Multi Class Brain
Tumor Classification Of MRI Images using Hybrid Structure Descriptor
and Fuzzy Logic Based RBF Kernel SVM’ , Iranian Journal of Fuzzy
system , Volume 14, Issue 3, pp 41-54 , 2017.
11. Patchell RA, Tibbs PA, Walsh JW, et al. A randomized trial of surgery
in the treatment of single metastases to the brain. N Engl J
Med.1990;322(8):494-500.
12. Zhang, Y., Wang, S., Dong, Z., Phillip, P., Ji, G., Yang, J.: Pathological
brain detection in magnetic resonance imaging scanning by wavelet
entropy and hybridization of biogeography-based optimization and
particle swarm optimization. Prog. Electromagn. Res. 152, 41–58
(2015).
13. A. Jayachandran; R. Dhanashakeran ; O. Sugel Anand ; J. H. M. Ajitha,
"Fuzzy information system based digital image segmentation by edge
detection",2010 IEEE International Conference on Computational
Intelligence and Computing Research,28-29 Dec. 2010.
14. Gudigar, A., Raghavendra, U., San, T.R., Ciaccio, E.J., Acharya, U.R.:
Application of multiresolution analysis for automated detection of brain
abnormality using MR images: A comparative study. Futur. Gener.
Comput. Syst. 90, 359–367 (2019).
15. Acharya, U.R., Oh, S.L., Hagiwara, Y., Tan, J.H., Adeli, H.: Deep
convolutional neural network for the automated detection and diagnosis
of seizure using EEG signals. Comput. Biol. Med. (2017).
AUTHORS PROFILE
Dr.J.Andrews received B.E. (Computer Science &
Engineering) from Dr. Sivanthi Aditanar college of
Engineering, Manonmanium Sundaranar University
Tirunelveli, India in 1999 and M.E degree in
Computer Science & Engineering from Sathyabama
University, Chennai, India in 2006. He has received
Ph.D degree from Sathyabama University in 2014 for the thesis titled as
“Study of Selection and Ordering of Objective Functions for compiler
Optimization”. He had worked in different engineering colleges from
various position Assistant professor to Professor level. He has served more
than 11 years in Sathyabama University at Chennai. He has filed and
published the patent work titled as “Centralized wireless Cardiogram
System”(Application No:201741028231). He has reviewed many papers in
Published By:
Retrieval Number: D7792118419/2020©BEIESP Blue Eyes Intelligence Engineering
DOI:10.35940/ijrte.D7792.018520 3515 & Sciences PublicationYou can also read