Deformable Scintillation Dosimeter I: Challenges and Implementation using Computer Vision Techniques
←
→
Page content transcription
If your browser does not render page correctly, please read the page content below
Deformable Scintillation Dosimeter I: Challenges
                                                  and Implementation using Computer Vision
arXiv:2101.08831v1 [physics.med-ph] 21 Jan 2021

                                                  Techniques
                                                                 E Cloutier1,2 , L Archambault1,2 , L Beaulieu1,2 ‡
                                                                                 1
                                                                                   Physics, physical engineering and optics department and Cancer
                                                                                 Research Center, Universite Laval, Quebec, Canada.
                                                                                 2
                                                                                   CHU de Quebec – Université Laval, CHU de Quebec, Quebec,
                                                                                 Canada

                                                                 Abstract. Plastic scintillation detectors are increasingly used to measure dose
                                                                 distributions in the context of radiotherapy treatments. Their water-equivalence, real-
                                                                 time response and high spatial resolution distinguish them from traditional detectors,
                                                                 especially in complex irradiation geometries. Their range of applications could
                                                                 be further extended by embedding scintillators in a deformable matrix mimicking
                                                                 anatomical changes. In this work, we characterized signal variations arising from the
                                                                 translation and rotation of scintillating fibers with respect to a camera. Corrections
                                                                 are proposed using stereo vision techniques and two sCMOS complementing a CCD
                                                                 camera. The study was extended to the case of a prototype real-time deformable
                                                                 dosimeter comprising an array of 19 scintillating. The signal to angle relationship
                                                                 follows a gaussian distribution (FWHM = 52◦ ) whereas the intensity variation from
                                                                 radial displacement follows the inverse square law. Tracking the position and angle of
                                                                 the fibers enabled the correction of these spatial dependencies. The detecting system
                                                                 provides an accuracy and precision of respectively 0.008 cm and 0.03 cm on the position
                                                                 detection. This resulted in an uncertainty of 2◦ on the angle measurement. Displacing
                                                                 the dosimeter by ±3 cm in depth resulted in relative intensities of 100 ± 10% (mean
                                                                 ± standard deviation) to the reference position. Applying corrections reduced the
                                                                 variations thus resulting in relative intensities of 100 ± 1%. Similarly, for lateral
                                                                 displacements of ±3 cm, intensities went from 98±3% to 100±1% after the correction.
                                                                 Therefore, accurate correction of the signal collected by a camera imaging the output
                                                                 of scintillating elements in a 3D volume is possible. This work paves the way to the
                                                                 development of real-time scintillator-based deformable dosimeters.

                                                  ‡ Present address: Department of Physics, Université Laval, Quebec, QC BS8 1TS, Canada.
Deformable Scintillation Dosimeter I : Challenges and correction techniques 2
1. Introduction
Over the last decade, water-equivalent radio-luminescent materials have been used in a
variety of setups to quantify delivered dose distributions of radiotherapy treatments.
From plastic scintillating fiber detectors to volumetric scintillation dosimeters and
Cherenkov imaging, such systems enable real-time measurements with high spatial
resolution over a wide range of energies [1–3], without the need for energy-dependent
correction factors. Moreover, the advent of complex personalized treatment plans using a
greater number of small fields, more modulated beams and magnetic fields [4–6] highlight
the advantages of plastic scintillation detectors making them well suited tools for the
rising challenges of advanced radiation therapy techniques [7].
Over the same period, a growing clinical interest to consider anatomical variations
in treatment planning and delivery has developed. Inter-fractional and intra-fractional
organ motion, as well as anatomical deformations, have been shown to result in clinically
significant dose variations that need to be accounted for [8, 9]. This adds another layer
of complexity for dose measurements. Therefore, there is an increasing need for new
dosimeters capable of measuring dose in a deformable matrix mimicking anatomical
variations [10]. Scintillators have been used for 3D dosimetry and may be an ideal choice
for measurement in the presence of deformations. Volumetric scintillation dosimeters
have demonstrated the ability to perform millimeter resolution, real-time and water-
equivalent dosimetry of dynamic treatment plan over 2D [11] and 3D volumes [12–17].
A scintillator-based deformable dosimeter would be suited to the challenges imposed by
both motion management and advanced radiotherapy modalities. Furthermore, given
the rapidly increasing role of artificial intelligence [18] in radiation oncology, the need
for accurate experimental validation will likely increase in the future. However, going
from static to deformable geometries entails new difficulties. Applying a deformation
to a radioluminescent-based phantom will lead to translations and rotations of the
radioluminescent elements resulting in variations of the signal collected, even if no
change in deposited dose is expected.
This work is the first to investigate the signal variations arising from the
displacement and rotations of a point-like scintillator directly imaged by a camera (i.e.
not coupled to a clear optical fiber). Using computer vision techniques, the position
of the tip of a scintillating fiber and it’s angulation in regards to the photo-detector
is tracked, and signal variations are corrected. Then, those correction techniques are
applied to the case of a deformable phantom comprising an array of 19 scintillating
fibers measuring the dose from a linac. The dosimeter and correction method were
subsequently applied to the simultaneous deformation vector fields and dose distribution
measurements, which is presented in the companion paper [19].Deformable Scintillation Dosimeter I : Challenges and correction techniques 3
Table 1: Summarized detection setup for each experiment. F/M indicate whether the
detector and the dosimeter are fixed (F) or moving (M).
Experiment Detector(s) F/M Dosimeter F/M
Signal caracterization
(section 2.1)
Angular correction sCMOS mounted One scintillator
M F
Distal correction on robot at isocenter
Signal correction
(section 2.2)
3D positionning accuracy sCMOS1 + CCD One scintillator
F M
Angular measurement sCMOS2 + CCD mounted on robot
Correction validation
(section 2.3)
sCMOS mounted One scintillator
Single scintillator M F
on robot at isocenter
sCMOS1 + sCMOS2 Deformable
19 scintillators dosimeter F M
+ CCD dosimeter
2. Methods
Measurements were conducted with different detection setups which are summarized in
table 1. Throughout this work, green scintillators (length: 1.2 cm, diameter: 0.1 cm,
BCF-60; Saint-Gobain Crystals, Hiram, OH, USA) are used. All irradiations were
performed with a 6 MV photon beam (Clinac iX, Varian, Palo Alto, USA).
2.1. Characterizing signal spatial dependencies
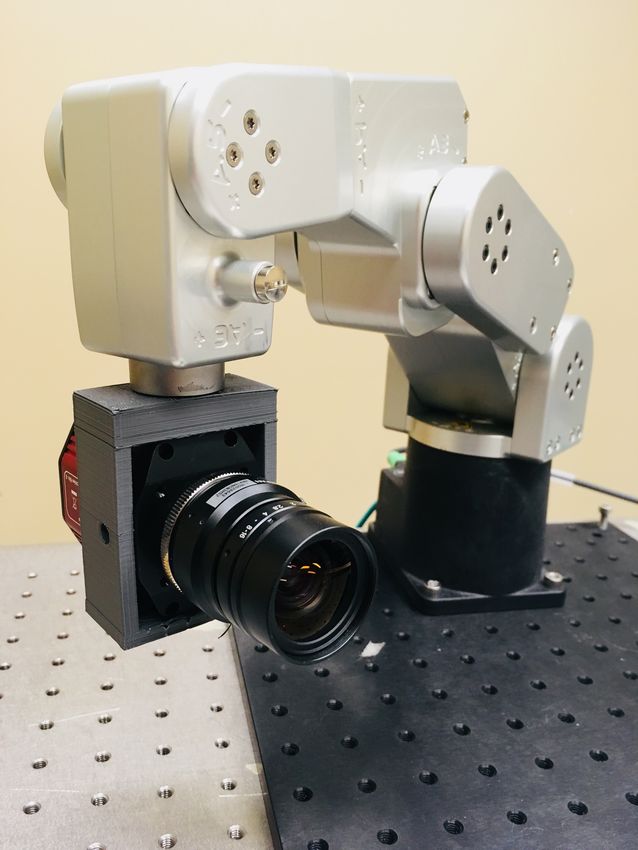
Signal variations caused by the displacement and rotation of scintillating fibers were
separately characterized using a sCMOS camera (Quantalux, Thorlabs, Newton, USA)
mounted on a Meca500 small industrial robot arm (Mecademic, Montreal, Canada)
(figure 1). From different viewpoints, the sCMOS acquired the scintillating signal
from the tip of a scintillator positioned at the isocenter of a 6 MV photon beam.
All measurements were compared to the signal obtained at a reference position set
to (r, θ, φ) = (35, 0, 0). The relation between the collected light and the orientation of
the camera with respect to the scintillator was characterized by moving the camera with
the robot around the scintillator, within the robot’s limits (±26◦ ), keeping a constant
radial distance (r = 35 cm, θ, φ = 0). Then, the signal to radial distance (r) relationship
was measured by moving the camera towards to scintillating fiber, from 30 to 43 cm,
keeping the orientation fixed (r, θ = 0, φ = 0). Acquisitions from a uniform white emitterDeformable Scintillation Dosimeter I : Challenges and correction techniques 4
(a) (b)
Lateral
displacement
Scintillating
sCMOS (r,θ,φ)
fiber (0,0,0)
r
✓
Figure 1: Setup used for the θ and r calibration and validation using lateral
displacements : (a) pictures the camera mounted on the robot while (b) presents the
coordinate system.
screen were also performed to quantify the impact of vignetting in the resulting images.
The vignetting for each pixel (i, j) was calculated using a cos4 (θ(i,j) ) fit as suggested by
Robertson et al [20].
2.2. Signal corrections
A setup of 3 cameras was designed to measure the signal, orientation and 3D position of
irradiated scintillation fibers (figure 2). The setup comprises two sCMOS and one cooled
CCD (Alta U2000, Andor Technology, Belfast, United Kingdom). The CCD camera
was chosen for its capacity to provide stable measurements, whereas the sCMOS were
selected for their high spatial resolution (1920 x 1080 pixels). The resulting detection
assembly aims at correcting the signal from moving scintillators measured with static
cameras.
2.2.1. Rotation measurement To account for the rotation of a scintillating fibers, a
sCMOS camera was positioned in front of a CCD. Angles were calculated from the
measured vertical (dyi ) and lateral (dxi ) displacement shifts by the facing cameras :
dx1 + dx2 dy2 − dy1
sin θm = ; sin φm = . (1)
l l
The accuracy of tilt measurements was assessed by mounting a 1.2 cm length (0.1 cm
diameter) scintillating fiber on the robot arm. θm and φm were simultaneously measured
while rotating the fiber with the robot in the θr and φr direction from 0◦ to 30◦ .
2.2.2. 3D position tracking Distance corrections rely on the 3D distance
(r = x + y 2 + z 2 ) of the fiber in the object space with respect to the cam-
2 2
era’s sensor center. Hence, a stereoscopic pair of camera was used to project the 2D
image position of each scintillating fiber onto the 3D object space and correct varia-
tions resulting from changes in their optical coupling with the cameras. Using computerDeformable Scintillation Dosimeter I : Challenges and correction techniques 5
Figure 2: Illustration of the room set-up for irradiation measurements: the CCD
measuring the scintillation signal and the two sCMOS paired to correct the signal from
variations in the distance and orientation of the fibers. The sCMOS1 is used to measure
the tilts of the scintillating fibers while the sCMOS2 enables their 3D tracking. The
dosimeter comprises an array of 19 scintillating fibers distant by 1 cm.
vision, it is possible to project the 3D object position Pe (x, y, z) on a 2D image plane
e 0 , y 0 ) using a projective transformation as:
p(x
pe = sm
f=K
3×3
[Rt − Rt t] 3×4 Pe . (2)
K and [Rt −Rt t] respectively refer to the intrinsic and extrinsic parameters of the camera,
which can be extracted from calibration [21]. The intrinsic parameters matrix depends
on the properties of the detector used whereas the extrinsic parameters matrix depends
on the position (rotation, translation) of the detectors with regards to the imaged scene.
Once known, it is possible to reconstruct the (x,y) position of an image point in the
object space. However, using only one camera limits the projection to (x,y) coordinates
as the z position (depth) is degenerate. The use of an additional camera imaging the
object from a different perspective removes the degeneracy along z and enables the 3D
positioning of the object.
In this work, we paired the Alta U2000 cooled CCD to a sCMOS to locate the tip
scintillating fibers in the object space (x, y, z). With this location, it was possible to
apply the distance correction to signal variations arising from the movement of the fibers.
Cameras were calibrated using a (15×10) chessboard pattern and a calibration algorithm
inspired by Zhang from the OpenCV Python library version 3.4.2 [22, 23]. Images
were rectified and corrected for distortion before performing the triangulation. The
rectification eases triangulation calculations whereas the distortion correction increases
its accuracy. The position of the left camera in relation to the first one, as obtained from
calibration, is presented in table 2. The accuracy of the 3D tracking from stereo-vision
was assessed by mounting a scintillating fiber on the robot arm. Displacements in the
x, y and z axis were subsequently performed by the robot in increments of 1 cm.Deformable Scintillation Dosimeter I : Challenges and correction techniques 6
Table 2: Translation and rotation between the sCMOS2 and the CCD coordinate systems
as obtained from the calibration
Translation [cm] X : 10.67 Y : -0.33 Z : 3.45
Angle [◦ ] Pitch : -1.3 Yaw : -15.62 Roll : -0.26
2.3. Validation of signal correction
The signal resulting from the lateral displacement was acquired to validate the proposed
correction technique. The case of a single scintillating fiber was first assessed by
mounting a sCMOS on the robot imaging a fixed scintillating fiber. Measurement were
taken from -7 to 7 cm in increments of 1 mm and a correction was performed using
known distance (r) and orientation (θ, φ).
2.4. Application to a deformable scintillating detector
The method was extended to the case of a deformable scintillator-based dosimeter
comprising as array of 19 BCF-60 scintillating fibers (figure 2) and a complete correction
was carried out without prior knowledge on the distance and orientation of the fibers.
2.4.1. Dosimeter fabrication The deformable dosimeter prototype consists of a clear,
flexible cylindrical elastomer in which 19 scintillating fibers were embedded (figure 2).
The cylinder is made from a commercial urethane liquid elastomer compound (Smooth-
On, Macongie, USA) cast in a silicone cylindrical mold (diameter: 6 cm, thickness:
1.2 cm). The compound was degassed in vacuum prior to pouring in order to remove
trapped air bubbles which would have reduced the final transparency of the elastomer.
Nineteen scintillations fibers were inserted in the cylindrical elastomer guided by a
3D-printed template. Each scintillating fiber was covered by a heat-shrinking opaque
cladding to isolate the scintillation light from its surrounding and, more importantly,
limit the collected signal to the one emerging from its ends. The scintillating fibers were
embedded in the phantom forming a 1x1x1 cm triangular grid array.
2.4.2. Dosimeter characterization The density (in g/cm3 ) of the detector was extracted
from a CT-scan (Siemens Somatom Definition AS Open 64, Siemens Healthcare,
Forchheim, Germany). CT-scans of the bulk elastomer (i.e. no fibers embedded) and a
reference water volume were also acquired for comparison. The pitch, current and energy
of the scanner were respectively set to 0.35, 60 mA and 120 kVp. The detector was also
irradiated with a 6 MV, 600 cGy/min photon beam (Clinac iX, Varian, Palo Alto, USA)
while being imaged. The center of the detector was aligned with the isocenter of the
linac. Dose linearity was studied while varying the dose deposited or the dose rate.
Different dose rates were achieved by varying the distance between the detector andDeformable Scintillation Dosimeter I : Challenges and correction techniques 7
the irradiation source while keeping the integration time and delivered monitor units
constant.
2.4.3. Dose correction measurements The dosimeter was displaced laterally from -3
to 3 cm relative to it’s initial position relative to the camera. Radial displacement
were also conducted moving the dosimeter from 32 to 38 cm from the CCD camera.
Displacements were achieved by translating the treatment couch in 1 cm increments
and repositionning the center of the dosimeter at the isocenter of the linac, to keep the
dose constant. The irradiations were of 100 monitor units (MU). The radiometry, i.e.
quantitative measurement of scintillating signal related to the dose, was carried by the
CCD camera, while both sCMOS measured the angle and 3D position of the fibers. The
CCD camera was positioned 35 cm from the dosimeter and coupled to a 12 mm focal
length lens (F/# = 16). For each measurement, five backgrounds, i.e. images acquired
in the absence of ionizing radiation, and five signal frames were acquired. Background
frames were subtracted from the signal images. Then, acquisitions were corrected using
a median temporal filter [24] and combined with an average. The scintillation signal
was integrated on the resulting images over a 3×3 pixels region-of-interest centered on
the centroid of each scintillating fiber. The cameras were shielded with lead blocks to
reduce noise from stray radiation.
3. Results
1.00 Measured
1.0 Fit : 1/r2 (r2 = 0.99)
0
0.95 200 0.9
Intensity [-]
Intensity [-]
0.8 400
Y Pixel [-]
0.8
600
0.90
0.6 800 0.7
1000 0.6
0.85 Measured 12000
Gaussian fit (FWHM = 52.0°, r2=0.97) 0.4 500 1000
X Pixel [-]
1500
20 0 20 30 35 40
Rotation [°] Distance [cm]
(c)
(a) (b)
Figure 3: Characterization of the angular θ (a) and radial r (b) dependencies of the
signal collected by the camera. Vignetting (c) was also characterized to correct signal
variations of the sensor.
3.1. Spatial dependencies characterization
Rotating the camera’s optical axis with respect to the scintillating fibers axis results
in a decrease of the collected signal. This decrease can be modeled according to a
gaussian distribution with a full width at half max (FWHM) of 52 ◦ (see figure 3a).
For comparison, the scintillating fiber has a numerical aperture of 0.583 which resultsDeformable Scintillation Dosimeter I : Challenges and correction techniques 8
in an emission angle limited to 35.45◦ in air. Figure 3b presents the distance to signal
relationship obtained while varying the distance between the camera and the scintillating
fiber from 30 to 43 cm. Increasing the distance results in a decrease of the collected
signal following the inverse square law (R2 > 0.99). Finally, figure 3c presents the
vignetting function used to correct signal variations arising from the displacements of
the scintillating spots on the CCD sensor.
3.2. Angle measurement accuracy
Figure 4 presents θm and φm measured while moving a scintillating fiber in the θ (a)
and φ (b) direction. Rotating the scintillating fiber from 0 to 30◦ resulted in differences
up to 2.3◦ between the measured and predicted tilts.
30
m m
Measured [°]
Measured [°]
20 m
20
m
10 10
0 0
2 0
Diff. [°]
Diff. [°]
0
2 10
0 10 20 30 10 20 30
Nominal [°] Nominal [°]
(a) (b)
Figure 4: θm and φm measured while rotating a scintillating fiber either in the θ (a) or
φ (b) axis.
3.3. 3D tracking accuracy
Figure 5 presents the measured displacement by the stereoscopic pair in the x, y and
z axis while moving the fibers in 1 cm increments in each directions, successively.
Throughout all the measurements, the system provided a mean accuracy and precision
of 0.008 cm and 0.03 cm respectively.
3.4. Corrections validation
Figure 6 presents the signal variations measured from a lateral displacement of the
camera imaging one scintillating fiber and the resulting signal after angular, radial and
vignetting corrections are applied. A gaussian fit was applied to raw data to account
for uncertainties arising from wobbling movements of the camera through the robot’s
displacement. Figure 6(b) shows the corrected signal and the contribution of vignetting,Deformable Scintillation Dosimeter I : Challenges and correction techniques 9
Error [cm] Meas. displacement [cm]
Error [cm] Meas. displacement [cm]
Error [cm] Meas. displacement [cm]
1.00 1.00 1.00
0.75 0.75 0.75
x x x
0.50 y 0.50 y 0.50 y
z z z
0.25 0.25 0.25
0.00 0.00 0.00
0.05 0.05 0.05
0.00 0.00 0.00
0.05 0.05 0.05
5.0 2.5 0.0 2.5 5.0 4 2 0 2 34 35 36 37 38 39
Position [cm] Position [cm] Position [cm]
(a) (b) (c)
Figure 5: 3D measured displacement, while moving the scintillating fiber in the X
(a), Y (b) or (c) direction. The errors represent the difference between the expected
displacement and the one measured with the stereo pair of cameras.
angle and distance to the magnitude of the correction. The combined correction resulted
in signal variations lesser than 0.5% for lateral displacements ranging from -7 to 7 cm.
1.00 1.00
0.95 0.95
Intensity [-]
Intensity [-]
0.90 0.90
Gaussian fit (FWHM=12.3 cm)
0.85 0.85 Corr:Vignetting
Measured Corr:Vignetting+Angle
Gaussian fit (FWHM=12.3 cm, r2=0.90) Corr:Vignetting+Angle+Distance
0.80 0.80
5 0 5 5 0 5
Lateral displacement [cm] Lateral displacement [cm]
(a) (b)
Figure 6: Signal variation arising from lateral displacement of the camera (a) and its
correction using angular, radial and vignetting corrections (b). Horizontal lines in (b)
represents a ± 0.5% variation.
3.5. Application to a deformable scintillating detector
3.5.1. Dosimeter characterization Evaluation of the voxel density values from CT-
scans yielded (mean ± standard deviation) densities of 1.002 ± 0.005, 1.000 ± 0.005 and
0.999 ± 0.005 g/cm3 respectively for water, the urethane elastomer, and the elastomer
with the scintillating fibers inside. Figure 7 further presents a slice acquired from the CT
and a profile drawn across a region of interest. Even if the region of interest intercepts
four scintillating fibers, those are indistinguishable from the bulk elastomer.
As could be expected, the detector exhibited a linear dose-light relationship (R2 >
0.999) for all of the 19 scintillation fibers as presented on figure 8(a). The signal to doseDeformable Scintillation Dosimeter I : Challenges and correction techniques 10
0
Hounsfield unit [-]
200
400
600
800
1000
5.0 2.5 0.0 2.5 5.0
Position [cm]
(a) (b)
Figure 7: Image of a CT slice of the dosimeter (a) and a Housfield Unit profile extracted
from a region of interest (b). Dashed red lines on (a) correspond to the selected region
of interest.
400000 400000
300000 300000
Intensity [-]
Intensity [-]
200000 200000
100000 100000
0 0 10 20 30 40 50 0 0 200 400 600
Dose at isocenter [cGy] Dose rate at isocenter [cGy/min]
(a) (b)
Figure 8: Linearity of the scintillation signal as function of the dose (a) and dose rate
(b) for all of the 19 scintillating fibers. Solid lines represent linear fits : R2 > 0.999 for
all measurements.
proportionality remained linear (R2 > 0.999) when varying the dose rate from 215 to
660 cGy/min (figure 8(b)).
3.5.2. Spatial dependencies correction The signal obtained for the 19 scintillating fibers
as a result of varying the distance between the gel and the CCD camera from 32 to 38 cm
is presented of figure 9. The raw signal varies from 84.7% to 117.9% of the one obtained
at 35 cm (used as reference). Applying the inverse square law using the 3D positioning of
the fibers provided by the stereo matching cameras to the resulting signal reduced those
variation to 97.4% up to 101.9%. Figures 9(c) et 9(d) present the distribution from all
gathered data from the 19 scintillating fibers for each distance prior and after corrections
are applied. Radial distance variations resulted in mean ± standard deviation intensities
of 100±10 % and 100±1% before and after corrections, respectively.
Similarly, the raw signal variations caused by the lateral displacement of the
deformable dosimeter are presented in figure 10. Displacing the dosimeter from -3
cm to 3 cm relative to it’s initial position caused signal variations between 88.3% andDeformable Scintillation Dosimeter I : Challenges and correction techniques 11
Frequency [-]
1.2 1.2 50
1.1 1.1 00.8 1.0 1.2
Intensity [-]
Intensity [-]
Intensity [-]
1.0 1.0
(c)
0.9 0.9
Frequency [-]
0.8 32 34 36 38 0.8 32 34 36 38 50
Distance [cm] Distance [cm]
(a) (b)
00.8 1.0 1.2
Intensity [-]
(d)
Figure 9: Measured signal variation resulting from moving the dosimeter from a distance
32 to 38 cm in depth before (a) and after applying the signal corrections (b). (c) and
(d) present the distribution of raw and corrected data, respectively.
103.7%. Once corrected for angular and distal variations, signal variations ranged from
95.8% to 104.2%. The signal drop observed at 3 cm on figure 10 (a) results from a small
angulation of the prototype after its re-positioning at the isocenter. The angulation was
detected by the system and corrected as seen on 10 (b). The data distributions presented
of figures 10(c) et 10(d) reveal mean ± standard deviation intensities of 98%±3% and
100%±1% before and after corrections, respectively.
Frequency [-]
1.2 1.2 50
1.1 1.1 00.8 1.0 1.2
Intensity [-]
Intensity [-]
Intensity [-]
1.0 1.0
(c)
0.9 0.9
Frequency [-]
0.8 2 0 2 0.8 2 0 2 50
Distance [cm] Distance [cm]
(a) (b)
00.8 1.0 1.2
Intensity [-]
(d)
Figure 10: Measured signal variation resulting from lateral displacement before (a) and
after applying the signal corrections (b). (c) and (d) present the distribution of raw and
corrected data, respectively.Deformable Scintillation Dosimeter I : Challenges and correction techniques 12
4. Discussion
The signal produced by a scintillating fiber that is measured with a camera depends on
the distance between the camera and the scintillating fiber as well as the angle between
their respective axes. The resulting decrease of the measured signal as function of the tilt
of the fiber arises from the combined gaussian output of the guided scintillation signal
in the fiber and the non-guided isotropic signal emitted at the tip of the fiber. Signal
variations related to the distance between the camera and the fibers follows the inverse
square-law, as previously demonstrated [25, 26]. As a consequence, if not corrected, a
deformation of 1 cm in the z axis, captured by a camera distant of 35 cm, would lead
to signal variations of 5.48%. Thus, tracking position and angulation of the fibers is
essential for adequate dose measurements.
This work proposes the use of computer vision techniques to track the position of
scintillating fibers. The 3D optical position tracking enabled a precision of 0.03 cm.
This is slightly larger than the tolerance on the robot’s positioning of 0.01 cm and
the camera’s pixel resolution of 0.02 cm. The discrepancy on figure 5(a) happening
when the fiber passes the robot’s wrist center highlights the robot’s singularity point
(i.e. a configuration where the robot is blocked in certain direction, thus modifying
its path). Overall, our prototype dosimeter constitutes an application well suited to
stereo vision. Indeed, the accuracy of 3D reconstruction in stereo vision relies on 1)
the feature detection, and 2) the feature matching. Solving the correspondence problem
in the image pairs is one of the main challenges of stereo vision and many strategies
have been proposed to solve it [27]. Having 19 well-defined and organized points to
match significantly eases that challenge. As a result, our uncertainties are limited to
the feature detection, i.e. centroids, accuracy. Keeping the dosimetry application in
mind, an uncertainty of 0.03 cm would lead to a 0.17% dose uncertainty, at a distance
of 35 cm. As for the angle measurement, the uncertainty of 2◦ is consistent with the
spatial resolution of the camera’s limited to 0.02 cm. Compromising the field of view,
with a longer focal length objective for example, would improve the spatial and resulting
angular resolution of the system. The system could also be improved with the addition
of another sCMOS forming a stereoscopic pair with the facing camera (sCMOS1) to
completely position the fibers on both sides [19].
Correction functions (distance, angle and vignetting) were validated before their
application to the case of a deformable dosimeter. To do so, signal variations resulting
from the motion of a sCMOS imaging an irradiated scintillating fiber, from -7 to 7 cm,
were corrected using expected distances (r) and angles (θ). Thus, a signal decrease
down to 85% was reduced to 0.5%, after corrections. Using known r and θ enabled a
validation that minimized uncertainties related to the distance and angle measurement.
Density of the deformable detector presented no significant difference with water,
meaning the detector can simultaneously act as a water-equivalent detector and
phantom. Overall, displacement of the dosimeter radially generated higher signal
variations than lateral displacement. However, radial signal variations were moreDeformable Scintillation Dosimeter I : Challenges and correction techniques 13
effectively accounted for as the extrema were brought closer to the reference in
comparison to data resulting from lateral displacement. This highlights the accuracy
of the 3D positioning provided by the stereoscopic pair that enabled an efficient distal
correction. On the other hand, angular corrections rely on the measurements of small
pixel shifts. As lateral displacement has a stronger angular than radial correction
dependency, the corrected results exhibited larger discrepancies. Thus, the signal
variations remaining in the corrected data are attributed to uncertainties on the angular
measurement, mainly, and the 3D tracking accuracy. Smaller variations would also have
to be expect from fiber to fiber variations, in particular from the polishing of their ends
and exact lengths, which could affect the gaussian’s FWHM which guides the angular
correction.
The use of sCMOS cameras in the set-up enabled the 3D positionning and
orientation measurement of scintillating fibers. These cameras were used to acquire
qualitative images of high spatial resolution. Hence, the accuracy of the 3D tracking
and angle measurement only rely on the spatial resolution of the cameras, rather than
their stability over time. Thus, they could be replaced with cheaper cameras having
a sufficient spatial resolution. Since the radiometry is solely carried by the CCD,
the method does not compromise the stability and accuracy of dose measurements.
Moreover, the use of cameras directly on the treatment couch to measure the light
emitted by the scintillation fibers allows a cable-less setup. Hence, the detection system
does not impact deformation movement of the dosimeter.
Previous studies have looked into the characterization of optical artifacts inherent
to the use of plastic scintillators in static geometries [20]. As such, corrections related
to CCD, lens and scintillator tank artifacts were proven essentials to the resulting dose
measurement accuracy. However, new challenges arise from changing the scintillator
to detector geometry. Thus, tracking the position and orientation of radioluminescent
elements has applications to free-space measurements by a camera where corrections
are proven beneficial. In fact, scintillators have previously been used in set-ups where
the distance to the camera can vary, for example from the motion of the camera or the
breathing movement of a patient [25, 28, 29]. In the latter, the authors did not correct
the signal for distance variations, but found that a distance uncertainty margin of 2 cm
was required to keep the dose uncertainty under 1%, for a camera placed at a distance
of 400 cm. More recently, inverse-square distance corrections have been proposed to
account for Cerenkov-based dose measurements using a large field of view [26]. The distal
correction required reached ≈ 10% as the field of view covered a patient’s whole body. In
this work, the stereo matching provides an uncertainty margin of 0.03 cm, thus reducing
the potential dose uncertainty or even allowing the positioning of the scintillator closer
to the cameras. Therefore, precise 3D positioning and the associated corrections can
increase the signal-to-noise ratio (SNR) of dose measurements using radioluminescent
elements. Distance and angular dependencies corrections will be essential to accurate
dose measurements when extending scintillator’s range of application to deformable
cases: deforming a phantom comprising scintillators will lead to translations andREFERENCES 14
rotations of the scintillating elements. Translations up to 3 cm in every directions cover
the expected range of displacements in the context of radiotherapy treatments. Indeed,
anatomical variations in the millimeter-centimeter range occur through the course of
treatments [30]. A deformable scintillator-based detector would enable water-equivalent,
real-time dose measurement to study the dosimetric impact of anatomical deformations.
Compared to previously proposed scintillating dosimetry systems, this work enables
dose measurements of a moving and deforming scintillation based dosimeter. Moreover,
since scintillating fibers are read in free space, i.e. with no optical guide connecting
them to a detection device, their position can be optically tracked and serve as markers.
Hence, the optical 3D position tracking can be use to measure positions and resulting
deformation. Future work will look into the dosimetric characterisation of the system
as well as its ability to measure deformation vector fields. A water-equivalent, real-time
dosimeter that simultaneously measures dose and the deformation vector field would
have extensive application in validating deformable image registration algorithms [10,
31] as well as understanding the dosimetric impact of anatomical deformations.
5. Conclusion
The novel use of scintillating fibers in a varying geometry phantom presented new
difficulties that were characterized and corrected. Hence, measurements of the angular
and distal variations of the fibers from the detector reduced the signal dependencies
on the varying geometry of the gel. Pairing a cooled CCD to two sCMOS enabled the
3D positionning and angular tracking of 19 moving scintillating fibers. All together,
the setup enabled a correction workflow accounting for distal and angular variations of
moving scintillating elements. Moreover, we prototyped a novel deformable scintillation
detector measuring the dose at 19 points in a flexible phantom. This works is a step
toward the use of plastic scintillators in moving and varying geometries.
6. Acknowledgement
The authors thank Serge Groleau for his help manufacturing the elastomer. This
work was financed by the Natural Sciences and Engineering Research Council of
Canada (NSERC) Discovery grants #2019-05038 and #2018-04055. Emily Cloutier
acknowledges support by the Fonds de Recherche du Quebec – Nature et Technologies
(FRQNT). The authors thank Ghyslain Leclerc for the English revision of the paper.
References
[1] Brian W. Pogue, Adam K. Glaser, Rongxiao Zhang, and David J. Gladstone.
“Cherenkov radiation dosimetry in water tanks – video rate imaging, tomography
and IMRT & VMAT plan verification”. In: Journal of Physics: Conference Series
573.1 (2015), p. 012013.REFERENCES 15
[2] Luc Beaulieu and Sam Beddar. “Review of plastic and liquid scintillation
dosimetry for photon, electron, and proton therapy”. In: Physics in Medicine and
Biology 61.20 (Oct. 21, 2016), R305–R343.
[3] A. S. Beddar. “Water equivalent plastic scintillation detectors in radiation
therapy”. In: Radiation Protection Dosimetry 120.1 (Jan. 9, 2006), pp. 1–6.
[4] Daniel A Alexander, Rongxiao Zhang, Petr Bruza, and Brian W Pogue. “1
Scintillation Imaging as a High-Resolution, Remote, Versatile 2D Detection 2
System for MR-Linac Quality Assurance”. In: (), p. 24.
[5] Levi Madden, James Archer, Enbang Li, Urszula Jelen, Bin Dong, Natalia
Roberts, Lois Holloway, and Anatoly Rosenfeld. “First measurements with a
plastic scintillation dosimeter at the Australian MRI-LINAC”. In: Physics in
Medicine & Biology 64.17 (Sept. 4, 2019), p. 175015.
[6] F. Therriault-Proulx, Z. Wen, G. Ibbott, and S. Beddar. “Effect of magnetic field
strength on plastic scintillation detector response”. In: Radiation Measurements
116 (Sept. 2018), pp. 10–13.
[7] A. S. Beddar and L Beaulieu. Scintillation Dosimetry. CRC Press, Apr. 1, 2016.
[8] B. Schaly, J. A. Kempe, G. S. Bauman, J. J. Battista, and J. Van Dyk. “Tracking
the dose distribution in radiation therapy by accounting for variable anatomy”.
In: Physics in Medicine and Biology 49.5 (2004), p. 791.
[9] K. K. Brock, D. L. McShan, R. K. Ten Haken, S. J. Hollister, L. A. Dawson, and
J. M. Balter. “Inclusion of organ deformation in dose calculations”. In: Medical
Physics 30.3 (Mar. 1, 2003), pp. 290–295.
[10] Neil Kirby, Cynthia Chuang, Utako Ueda, and Jean Pouliot. “The need for
application-based adaptation of deformable image registration”. In: Medical
physics 40.1 (2013).
[11] Mathieu Goulet, Madison Rilling, Luc Gingras, Sam Beddar, Luc Beaulieu, and
Louis Archambault. “Novel, full 3D scintillation dosimetry using a static plenoptic
camera”. In: Medical Physics 41.8 (Aug. 1, 2014), p. 082101.
[12] Madison Rilling, Louis Archambault, and Simon Thibault. “Simulating imaging-
based tomographic systems using an optical design software for resolving 3D
structures of translucent media”. In: Applied Optics (), p. 11.
[13] Madison Rilling, Guillaume Allain, Simon Thibault, and Louis Archambault.
“Tomographic-based 3D scintillation dosimetry using a three-view plenoptic
imaging system”. en. In: Medical Physics (May 2020), mp.14213.
[14] Mathieu Guillot, Luc Gingras, Louis Archambault, Sam Beddar, and Luc Beaulieu.
“Performance assessment of a 2D array of plastic scintillation detectors for IMRT
quality assurance”. en. In: Physics in Medicine and Biology 58.13 (July 2013),
pp. 4439–4454.REFERENCES 16
[15] Florian Kroll, Jörg Pawelke, and Leonhard Karsch. “Preliminary investigations on
the determination of three-dimensional dose distributions using scintillator blocks
and optical tomography”. In: Medical Physics 40.8 (Aug. 1, 2013), p. 082104.
[16] A. S. Kirov, J. Z. Piao, N. K. Mathur, T. R. Miller, S. Devic, S. Trichter, M. Zaider,
C. G. Soares, and T. LoSasso. “The three-dimensional scintillation dosimetry
method: test for a 106 Ru eye plaque applicator”. In: Physics in Medicine and
Biology 50.13 (2005), p. 3063.
[17] A. S. Kirov, S. Shrinivas, C. Hurlbut, J. F. Dempsey, W. R. Binns, and J. L.
Poblete. “New water equivalent liquid scintillation solutions for 3D dosimetry”.
In: Medical Physics 27.5 (May 1, 2000), pp. 1156–1164.
[18] Reid F. Thompson, Gilmer Valdes, Clifton D. Fuller, Colin M. Carpenter,
Olivier Morin, Sanjay Aneja, William D. Lindsay, Hugo J.W.L. Aerts, Barbara
Agrimson, Curtiland Deville, Seth A. Rosenthal, James B. Yu, and Charles R.
Thomas. “Artificial intelligence in radiation oncology: A specialty-wide disruptive
transformation?” en. In: Radiotherapy and Oncology 129.3 (Dec. 2018), pp. 421–
426.
[19] Emily Cloutier, Luc Beaulieu, and Louis Archambault. “Deformable Scintillation
Dosimeter II: Real-Time Simultaneous Measurements of Dose and Tracking of
Deformation Vector Fields”. In: (2021).
[20] Daniel Robertson, Cheukkai Hui, Louis Archambault, Radhe Mohan, and
Sam Beddar. “Optical artefact characterization and correction in volumetric
scintillation dosimetry”. In: Physics in Medicine & Biology 59.1 (2014), p. 23.
[21] Richard Hartley and Andrew Zisserman. Multiple view geometry in computer
vision. OCLC: 171123855. 2004.
[22] Z. Zhang. “A flexible new technique for camera calibration”. In: IEEE
Transactions on Pattern Analysis and Machine Intelligence 22.11 (Nov. 2000),
pp. 1330–1334.
[23] G. Bradski. “The OpenCV Library”. In: Dr. Dobb’s Journal of Software Tools
(2000).
[24] Louis Archambault, Tina Marie Briere, and Sam Beddar. “Transient noise
characterization and filtration in CCD cameras exposed to stray radiation from
a medical linear accelerator”. In: Medical Physics 35.10 (Oct. 1, 2008), pp. 4342–
4351.
[25] Petr Bruza, Sarah L Gollub, Jacqueline M Andreozzi, Irwin I Tendler, Benjamin B
Williams, Lesley A Jarvis, David J Gladstone, and Brian W Pogue. “Time-gated
scintillator imaging for real-time optical surface dosimetry in total skin electron
therapy”. In: Physics in Medicine & Biology 63.9 (May 2, 2018), p. 095009.REFERENCES 17
[26] Yunhe Xie, Heather Petroccia, Amit Maity, Tianshun Miao, Yihua Zhu, Petr
Bruza, Brian W. Pogue, John P. Plastaras, Lei Dong, and Timothy C. Zhu.
“Cherenkov imaging for total skin electron therapy (TSET)”. en. In: Medical
Physics 47.1 (Jan. 2020), pp. 201–212.
[27] M. Gosta and M. Grgic. “Accomplishments and challenges of computer stereo
vision”. In: Proceedings ELMAR-2010. 2010, pp. 57–64.
[28] Irwin I Tendler, Petr Bruza, Mike Jermyn, Xu Cao, Benjamin B Williams, Lesley A
Jarvis, Brian W Pogue, and David J Gladstone. “Characterization of a non-contact
imaging scintillator-based dosimetry system for total skin electron therapy”. en.
In: Physics in Medicine & Biology 64.12 (June 2019), p. 125025.
[29] Cesare H Jenkins, Dominik J Naczynski, Shu-Jung S Yu, Yong Yang, and
Lei Xing. “Automating quality assurance of digital linear accelerators using a
radioluminescent phosphor coated phantom and optical imaging”. In: Physics in
Medicine and Biology 61.17 (Sept. 7, 2016), pp. L29–L37.
[30] U. J. Yeo, M. L. Taylor, L. Dunn, T. Kron, R. L. Smith, and R. D. Franich.
“A novel methodology for 3D deformable dosimetry”. In: Medical Physics 39.4
(Apr. 1, 2012), pp. 2203–2213.
[31] Neil Kirby, Cynthia Chuang, and Jean Pouliot. “A two-dimensional deformable
phantom for quantitatively verifying deformation algorithms”. In: Medical Physics
38.8 (Aug. 1, 2011), pp. 4583–4586.You can also read