DiaMole: Mole Detection and Segmentation Software for Mobile Phone Skin Images
←
→
Page content transcription
If your browser does not render page correctly, please read the page content below

Hindawi
Journal of Healthcare Engineering
Volume 2021, Article ID 6698176, 10 pages
https://doi.org/10.1155/2021/6698176

Research Article
DiaMole: Mole Detection and Segmentation Software for Mobile
Phone Skin Images

          Shuai Liu ,1 Zheng Chen ,1 Huahui Zhou ,1 Kunlin He ,1 Meiyu Duan ,1
          Qichen Zheng ,1 Pengcheng Xiong ,1 Lan Huang,1 Qiong Yu ,2 Guoxiong Su,3
          and Fengfeng Zhou 1
          1
            College of Computer Science and Technology and Key Laboratory of Symbolic Computation and Knowledge
            Engineering of Ministry of Education, Jilin University, Changchun 130012, China
          2
            Department of Epidemiology and Biostatistics, School of Public Health, Jilin University, 1163 Xinmin Street,
            Changchun 130021, China
          3
            Beijing Dr. of Acne Medical Research Institute, Beijing 100000, China

          Correspondence should be addressed to Fengfeng Zhou; fengfengzhou@gmail.com

          Received 1 December 2020; Revised 3 January 2021; Accepted 25 May 2021; Published 4 June 2021

          Academic Editor: le zhang

          Copyright © 2021 Shuai Liu et al. This is an open access article distributed under the Creative Commons Attribution License,
          which permits unrestricted use, distribution, and reproduction in any medium, provided the original work is properly cited.
          Motivation. The worldwide incidence and mortality rates of melanoma are on the rise recently. Melanoma may develop from
          benign lesions like skin moles. Easy-to-use mole detection software will help find the malignant skin lesions at the early stage.
          Results. This study developed mole detection and segmentation software DiaMole using mobile phone images. DiaMole utilized
          multiple deep learning algorithms for the object detection problem and mole segmentation problem. An object detection al-
          gorithm generated a rectangle tightly surrounding a mole in the mobile phone image. Moreover, the segmentation algorithm
          detected the precise boundary of that mole. Three deep learning algorithms were evaluated for their object detection performance.
          The popular performance metric mean average precision (mAP) was used to evaluate the algorithms. Among the utilized al-
          gorithms, the Faster R-CNN could achieve the best mAP � 0.835, and the integrated algorithm could achieve the mAP � 0.4228.
          Although the integrated algorithm could not achieve the best mAP, it can avoid the missing of detecting the moles. A popular Unet
          model was utilized to find the precise mole boundary. Clinical users may annotate the detected moles based on their experiences.
          Conclusions. DiaMole is user-friendly software for researchers focusing on skin lesions. DiaMole may automatically detect and
          segment the moles from the mobile phone skin images. The users may also annotate each candidate mole according to their own
          experiences. The automatically calculated mole image masks and the annotations may be saved for further investigations.

1. Introduction                                                        as normal cases with a high likelihood [3]. The MoleMapper
                                                                       project collected the skin moles captured by the iPhone
Skin cancer is a major public health problem, and melanoma             ResearchKit and released the data for the research community
accounted for 75% of deaths associated with skin cancers [1].          [5]. However, this dataset did not provide the detailed masks
Screening of all skin cancer types before metastasis may               of the lesion sites and the disease annotations.
provide the patients with more effective treatment options                   Segmentation and classification were the two tasks for the
[2]. Noninvasive dermoscopy is a popular technology to                 dermoscopy image-based melanoma prediction study [6]. A
capture high-resolution images of skin lesions [2].                    dermoscopy image usually zoomed in to the skin mole, and
    Melanoma detection based on mobile phone images re-                segmentation served as the first task to get the skin mole’s
cently caught the dermatologic researchers’ attention [3, 4].          precise boundary. Zhang et al. coupled a deep fully con-
However, the existing studies did not demonstrate sufficient             volutional network and a shallow network with textons to
detection accuracies, and they may even identify melanomas             automatically detect the skin lesions’ detailed segmentations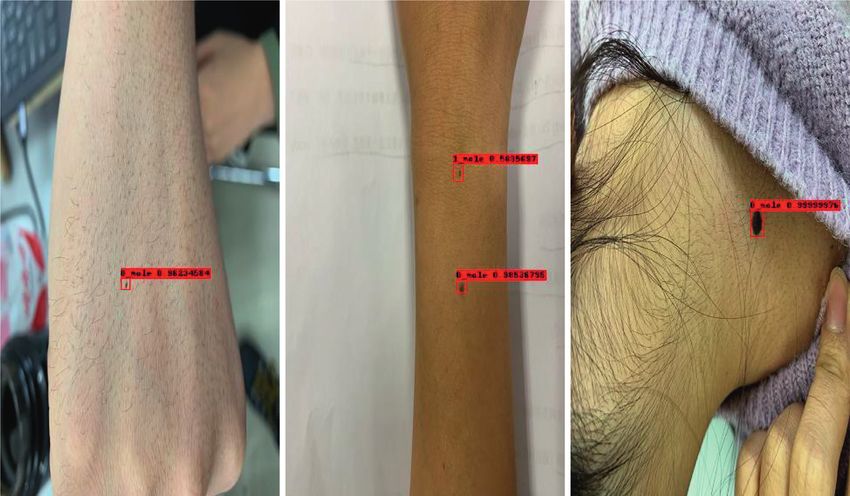
2                                                                                          Journal of Healthcare Engineering

[7]. Fully convolutional residual networks also demonstrated     3000 × 4000. We use OPPO Find X2, and the operating
promising performances in segmenting the skin lesions on the     system is Android 10, and each image is 3000 × 4000. This
dermoscopy images [8]. The second task of lesion classifi-        dataset serves as an independent validation and demon-
cation may utilize deep neural networks [8] or regular clas-     strative dataset for DiaMole. The images of the local cohort
sifiers like support vector machines (SVMs) [9].                  were resized to 320 × 568 in pixels, the same size in the
    This study hypothesized that locating the lesion site with   MoleMapper cohort.
a rectangle may improve the mole detection using mobile              Although there were over two thousand images in the
phone images. This was based on the observation that the         public datasets, we were concerned about whether the deep
skin lesion usually occupied the majority area of a der-         learning models could be well trained using these images. So
moscopy image, and usually there was only one lesion per         we only split the dataset into 70% training and 30% test
dermoscopy image. The experienced dermatologist may              datasets. The training dataset was used to train the model
ensure the high quality of a dermoscopy image. However, all      and to tune the hyperparameters. The 30% images in the test
these assumptions may not always be correct for a mobile         dataset were not involved in the model training step. This
phone image captured by a nonprofessional user. The              may cause the model overfitting problem. So both the 30%
software DiaMole was proposed to provide both object             test dataset and the locally collected dataset were used to
detection and segmentation functions using popular algo-         independently evaluate the trained model. The conventional
rithms. The user may also annotate the moles using their         training/validation/test splitting strategy will be used if a
experiences within the software DiaMole.                         larger dataset is available.

2. Materials and Methods
                                                                 2.2. Summary of the DiaMole Implementation. This study
2.1. Summary of the Datasets Used in This Study. Two datasets    developed the mole detection and segmentation software
were used to evaluate the performances of the proposed           DiaMole using the Python programming language version
software DiaMole. The MoleMapper project generously              3.6.2. Two major Python packages TensorFlow version 1.12.0
authorized us to evaluate DiaMole using their mole images        and OpenCV version 4.1.1.26 were used to support the
captured by the Apple ResearchKit [5]. The project recruited     object detection and lesion segmentation modules. DiaMole
2,069 participants, who contributed 1,920 demographic            was developed and tested on the two mainstream operating
surveys, 3,274 mole measurements, and 2,422 curated mole         systems Windows 7 and Windows 10.
images. Each image is 320 × 568 pixels in size. But the              DiaMole has a few prerequisite Python packages, in-
current version of the dataset did not provide the annota-       cluding Numpy and Pillow. To provide an easy installation
tions of the bounding boxes and mole masks. This study           procedure, we used the software Anaconda Distribution
annotated the bounding boxes of the MoleMapper images            version 4.3.25 to manage the virtual environments. The
using the open-source software labelImg [10]. Most of the        virtual environment was exported as the configuration file
images in this dataset put coins as the size meters of the       “diamole.yaml.” The Anaconda Distribution is an open-
moles. This study only keeps the images with both moles and      source Python system that supports Linux, Windows, and
coins for further analysis. There are 2,415 images reserved to   Mac OS X. If the user wants to install the running envi-
train and evaluate our models. We use 70% of the dataset to      ronment, use the command line “conda env create -f dia-
train our models and 30% to test the trained models. There       mole.yaml.” Then the environment may be started by the
are 1,691 and 724 images in the training and testing datasets,   command line “activate diamole.” The graphical user in-
respectively.                                                    terface (GUI) of DiaMole may be started in the above en-
     Another public dataset from the ISIC 2018 challenge was     vironment by “python gui\main.py.”
retrieved to train our segmentation model [11, 12]. This
dataset provides 2,594 images, and each is 224 × 224 pixels in
size.                                                            2.3. Implementation Details of Object Detection Algorithms.
     This study was approved by the institutional review         The first main task of DiaMole was object detection, and
board (IRB) of the College of Public Health of the Jilin         three popular object detection algorithms were integrated.
University. All the recruited local participants signed the      The popular object detection algorithm YOLOv3 (You Only
informed consent forms. Ten local participants were              Look Once) [13] calculated the bounding box of an object at
recruited to collect the mole images captured by mobile          three scales, as similar to the feature pyramid networks [14].
phones. There are five male and five female participants in        Each bounding box was evaluated using logistic regression,
this local cohort. Seven mole images were captured by            and the class label of each detected box was predicted by a
iPhone 6S, and the operating system is IOS 12.3.1. Each          series of 3 × 3 and 1 × 1 convolutional layer duets. YOLOv3
image is 1080 × 1440 pixels in size. To verify the influence by   ran very fast to accurately predict the objects and their class
different mobile operating systems, we chose three local          labels in the given image.
participants to collect the mole images by three different            Another widely used two-stage object detection algo-
mobile operating systems. In this study, we use iPhone XR to     rithm, Faster R-CNN (faster region convolutional neural
collect the images, and the operating system is IOS 14.2, and    network, abbreviated as FR-CNN), was also integrated into
each image is 4032 × 3024. We use HLK-AL00, and the              DiaMole [13]. FR-CNN utilized a region proposal network
operating system is Android 10.1.0, and each image is            (RPN) to generate high-quality region proposals. Its object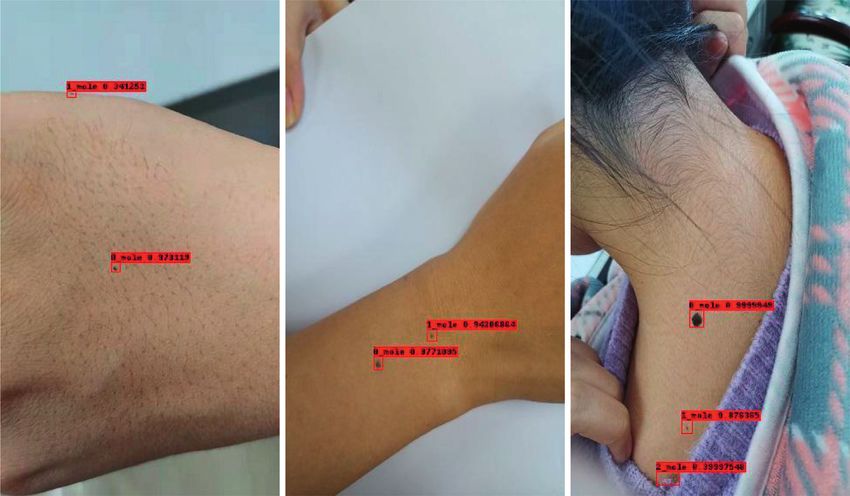
Journal of Healthcare Engineering                                                                                                  3

detection performance was better than the previous version,
                                                                                             Input data
the fast region convolutional neural network [15].
    Lin et al. proposed RetinaNet, a simple dense detector
[16]. RetinaNet matched the running speed of the previous
one-stage object detection networks but achieved a better            YOLOv3         FR-CNN           RetinaNet            ALL
object detection accuracy [16]. The main contribution of
RetinaNet was a new focal loss function that reduced the
training bias caused by the dataset imbalance and rapidly              Box 1         Box 2     ……         Box i    ……     Box n
focused the model training process on the difficult
samples.
    The detection results of all the above three object de-                                     Box i
tection algorithms might be integrated using the Non-
Maximum Suppression (NMS) strategy to generate the
consensus object bounding boxes [17]. The integration               Clinician
                                                                                              Bounding
                                                                                                                            UNet
procedure was denoted as the algorithm ALL.                                                     box
                                                                                  Mole                            Image
                                                                                annotation                         mask
2.4. Implementation Details of Mole Segmentation. The                                            Mole
dataset MoleMapper did not provide the mole masks and                                           report
labels, and this study transferred a publicly available seg-
                                                               Figure 1: Workflow of DiaMole. Moles in the input images were
mentation model from the ISIC 2018 challenge [18]. The         detected by the algorithms YOLOv3, FR-CNN, RetinaNet, and
ISIC 2018 challenge released a number of segmentation          ALL. After that, each bounding box was cropped out and seg-
source codes, and the team Opsins released their convolu-      mented by the UNet. The users may annotate these moles. The
tional neural networks (CNNs) with the UNet architecture.      annotation information and the mask images of the detected moles
The pretrained VGG-16 model was chosen as the base model       will be assembled as the final mole report.
in this study [19].
    A mole usually occupied the major part of a dermoscopic
                                                                   All the intermediate data are stored in the local database.
image, but a mobile phone skin image may cover the large
                                                               The user may export the masks and annotations of the
neighboring regions of a few moles. So this study firstly got
                                                               detected moles for further analysis. The user can export the
the bounding boxes of the moles using the above object
                                                               masks, bounding boxes, and annotations of the detected
detection algorithms. Then each bounding box was regarded
                                                               moles to a word file.
as a dermoscopy-like image and fed to the segmentation
model.
    This model was implemented using the Python pro-
gramming language version 3.6.2. The following Python          3.2. Data Analysis and Annotation Protocol Using DiaMole.
packages were used in the above-mentioned UNet model:          This section described the data analysis and annotation
Tensorflow version 1.12.0, Keras version 2.2.4, Pandas          protocol using the proposed software DiaMole. The ex-
version 0.25.1, Numpy version 1.17.2, Scikit-image version     perimental data of DiaMole on multiple datasets were de-
0.16.1, Matplotlib version 3.1.1, etc.                         scribed and discussed in the following sections.
                                                                    Step 1. Run the software DiaMole and its GUI, as
                                                                    shown in Figure 2(a). The left region consists of two
3. Results                                                          buttons and one text box. The user may click the
                                                                    button “Input an Image” to load one image into
3.1. Workflow of DiaMole. The graphical user interface
                                                                    DiaMole or click the other button “Choose a Folder”
(GUI) of DiaMole may be loaded by running the command
                                                                    to load all the images into DiaMole. DiaMole can
line “python gui/main.py” in the directory of DiaMole, as
                                                                    automatically load the images in the specified folder if
shown in Figure 1. The default workflow is to detect the
                                                                    these images are in the formats of JPG, PNG, BMP,
moles in a given human skin image. This image may be
                                                                    and TIFF.
captured by a mobile phone. The bounding boxes of the
moles are detected using the three popular object detection         The middle region has four buttons, and each is to
algorithms, that is, YOLOv3, FR-CNN, and RetinaNet.                 provide one of the four object detection algorithms,
These algorithms’ results may also be integrated using the          YOLOv3, RetinaNet, FR-CNN, and ALL. The below
algorithm NMS.                                                      part is the visualization region, and there are three
    In the second step, the UNet model will get the precise         pages for the raw image (raw), images with bounding
boundary of each mole, whose bounding box is cropped by             boxes (detect), and images for manual curation
the detection algorithms. Besides, the user can draw the            (draw).
bounding boxes based on their own experiences for the               The right region has three buttons, that is, “About,”
moles which are not detected by the algorithms. All the             “Export,” and “Save.” The button “About” gives a pop-
annotations could be saved to local database.                       up window with the information about DiaMole. The
4                                                                                                  Journal of Healthcare Engineering

                                  (a)                                                              (b)

Figure 2: Graphical user interface (GUI) of DiaMole. (a) After running the software, DiaMole’s GUI is shown above. (b) An image is loaded
into the GUI.

     button “Save” is to save the results of detection,
     segmentation, and annotation to the local temporary
     database. The button “Export” is to export the in-
     formation from the database into a word file. The
     detected moles are enumerated in the text box in the
     below part so that the user may click to choose each
     detected mole.
     Step 2. Choose an image to analyze, as shown in
     Figure 2(b). The user may click the button “Input an
     Image” to load an image. Or the user may load all the
     images in a specified file folder, by clicking the button
     “Choose a Folder.” After loading all the images files in
     the supported formats, the user may choose an image
     file by clicking the file name in the file list box in the left
     region of DiaMole.                                               Figure 3: Mole detection and segmentation. After running the
     Step 3. Detect and segment the moles in the given                object detection algorithm, the detection result and the mask label
                                                                      result are shown in the software.
     image, as shown in Figure 3. The bounding boxes of the
     moles in the given images may be detected using four
     algorithms, that is, YOLOv3, RetinaNet, FR-CNN, and                    may then use the mouse to draw a rectangle to cover a
     ALL. Click the button to choose the object detection                   candidate mole in the image, as shown in Figure 4(b).
     algorithm. There is only one mole segmentation al-                     DiaMole asks whether the user wants to save this
     gorithm UNet, and the mole in each bounding box is                     rectangle as a candidate mole. The user may click
     automatically segmented.                                               “Yes,” if satisfied with the drawn bounding box.
     The visualization region under the four buttons has                    Otherwise, the user may just click “No” to cancel this
     three pages, that is, “raw,” “detect,” and “draw.” The                 draw bounding box. The newly drawn bounding box is
     page “raw” gives the original image. The bounding                      shown in the image after the user clicks “Yes,” as
     boxes and the masks of the detected moles are illus-                   shown in Figure 4(c). The user can annotate a can-
     trated in the page “detect.” The detected moles are                    didate mole with any text after clicking the mole’s
     listed in the below part of the right region. The page                 name in the right region of DiaMole, as shown in
     “draw” gives the canvas for the user to draw a                         Figure 4(d).
     bounding box to cover a user-detected candidate                        Step 5. Click the button “Save” in the right region of
     mole.                                                                  DiaMole to save the current data. The masks and an-
     Step 4. Define a bounding box for a candidate mole                      notations of all the candidate moles will be saved into
     missed by DiaMole, as shown in Figure 4. Firstly, the                  the local database.
     user may switch to the page “draw” in the middle                       Step 6. Click the button “Export” in the right region of
     region of DiaMole, as shown in Figure 4(a). The user                   DiaMole to export the current data. The masks and
Journal of Healthcare Engineering                                                                                                     5

                                  (a)                                                              (b)

                                  (c)                                                              (d)

Figure 4: Draw the bounding box for a candidate mole. (a) The user may draw a rectangle as the bounding box for a candidate mole missed
by DiaMole. (b) DiaMole lets the user decide whether the rectangle is good enough for the candidate mole. (c) The user-defined bounding
box is shown in the image, and its name is listed in the right region. (d) Click a bounding box name in the right region to annotate it.

     annotations of all the candidate moles will be exported              In this study, we used three object detection algorithms,
     as an annotation report, and the data may be analyzed            YOLOv3, RetinaNet, and FR-CNN. We can get the positions
     by other tools.                                                  of the coins and moles in the images by these algorithms.
                                                                      During the training phase of YOLOv3, we used the mo-
     Step 7. Click the button “Help” in the left region of            mentum to optimize the weights. The learning rate was
     DiaMole to get the instruction. The usage instruction of         0.0001, and the cost function was optimized using 10705
     DiaMole will be popped up if you click the “Help”                epochs. When training the Faster R-CNN, we used the
     button.                                                          momentum to optimize the weights, set the learning rate to
                                                                      0.0001, and used 150000 epochs to optimize the cost
                                                                      function. When training the RetinaNet, we used the mo-
3.3. Performance Evaluation of Mole Detection Algorithms.             mentum to optimize the weights, set the learning rate 0.0005,
DiaMole used three popular object detection algorithms to             and used 150000 epochs to optimize the cost function.
detect the two types of objects in the MoleMapper dataset.                The four algorithms were evaluated for their detection
The integration algorithm ALL used the NMS strategy to                performances of the two classes “Coin” and “Mole,” as
combine the detection results of the above three algorithms.          shown in Figure 5. This study randomly split the Mole-
An object detection algorithm’s performance is evaluated by           Mapper dataset into 70% training dataset and 30% test
mean average precision (mAP). The mAP is widely used in               dataset. Both FR-CNN and RetinaNet performed very well
measuring the object detection algorithms [13, 15, 16]. In the        on detecting the objects in the class “Coin” but only achieved
detection of moles and coins, curves can be drawn for every           0.644 in AP for detecting moles. YOLOv3 did not perform
class according to recall and precision. The average precision        well on detecting the moles. FR-CNN achieved the best
(AP) is the area under the corresponding curve, and mAP is            mAP � 0.835. When we used NMS to integrate the above
the average AP of multiple targets. The higher the mAP is,            algorithms, the integration algorithm ALL achieved
the better the algorithm’s performance is.                            mAP � 0.4228. Although the integration performance was
6                                                                                               Journal of Healthcare Engineering

                          1.000
                          0.900
                          0.800
                          0.700
                          0.600
                          0.500
                          0.400
                          0.300
                          0.200
                          0.100
                            0.00
                                      FR-CNN              RetinaNet             YOLOv3               ALL
                      AP (Coin)         0.906               0.901                0.467              0.4565
                      AP (Mole)         0.763               0.644                0.420               0.389
                      mAP               0.835               0.773                0.444              0.4228

                                   AP (Coin)
                                   AP (Mole)
                                   mAP
Figure 5: Performances of the four object detection algorithms. The column series AP (Coin) and AP (Mole) gave the averaged precision
(AP) for the two classes of objects “Coin” and “Mole,” and the column series mAP gave the mean averaged precision (mAP) for the two
classes.

not good, ALL avoided missing the detection of moles by               3.6. Performance of DiaMole on Mole Images of Different
integrating the three object detection algorithms.                    Qualities. To verify the software’s performance on mole
                                                                      images obtained using different mobile operating systems,
                                                                      this study took additional mole images by three different
3.4. Demonstration of the Segmented Moles. This section               mobile phones for three participants, as shown in Figure 9.
demonstrated that object detection was necessary for                  The mole images were obtained at different image qualities,
detecting moles in the mobile phone images, as shown in               and the mobile operating systems were iOS 14.2, Android 10,
Figure 6. The segmentation algorithm UNet did not find any             and Android 10.1.0, respectively. As Figure 9 illustrated, the
moles in the mobile phone image, as shown in Figures 6(a)             mole images were taken by different mobile operating
and 6(b). If the object detection algorithm ALL was used to           systems and had complicated backgrounds. But DiaMole
find the bounding boxes of the candidate moles in the image,           detected all the eye-observable moles. So the image quality
the UNet model accurately detected the two moles’ precise             showed neglectable impacts on DiaMole’s mole detection
boundaries from the mobile phone image.                               performance.

                                                                      3.7. Evaluation of Each Algorithm’s Running Time. This study
3.5. Performance of DiaMole on the Locally Collected Dataset.         used three object detection algorithms to detect the moles,
The mole images from six other locally recruited participants         and then the algorithm UNet was used to get the precise
were collected, and their information was summarized in               border of each detected mole’s bounding box. In order to
Figure 7. These data were used to evaluate how DiaMole                evaluate how fast each object detection algorithm ran on an
performed on the mobile phone images captured in everyday             image, this study chose the nine images from Figure 9 and
life, as shown in Figure 8. RetinaNet detected a light-colored        ran YOLOv3, RetinaNet, and FR-CNN on each image. The
mole, while the other two algorithms FR-CNN and YOLOv3                average running time of each algorithm on each mobile
missed it, as shown in Figure 8(a). All three algorithms              operating system was illustrated in Figure 10. So FR-CNN
detected the right mole, but FR-CNN and RetinaNet rec-                ran the fastest to detect moles on the mobile-taken mole
ognized the scar as a mole, as shown in Figure 8(d). FR-CNN           images, and it completed its task no more than 15.95 seconds
detected the mole correctly in Figures 8(c) and 8(e), but the         for the mole images taken by both iOS and Android.
other two algorithms missed. So overall FR-CNN may serve              YOLOv3 was the slowest mole detection algorithm. The data
as a good mole detection algorithm. The user may also                 in the above sections suggested that a combined result of all
choose the integrated algorithm ALL or the other two                  the three algorithms (the mode “ALL”) may be chosen to
algorithms.                                                           avoid any missed moles.
Journal of Healthcare Engineering                                                                                                 7

                                  (a)                             (b)                           (c)

Figure 6: Segmenting moles from a mobile phone image of the locally collected sample male-4. (a) The original mobile phone image.
(b) UNet-segmented mask on the original image. (c) UNet-segmented mask on the bounding boxes from the object detection algorithm
ALL.

                                               Sample            Gender              Age

                                               Female-1          Female              24
                                               Female-2          Female              27
                                               Female-3          Female              28
                                               Male-1             Male               28
                                               Male-2             Male               28
                                               Male-3             Male               27
                                               Male-4             Male               25

Figure 7: Summary of the 7 locally collected samples using iPhone 6S. The samples are annotated with the gender and age information.

      Original    FR-CNN      RetinaNet   YOLOv3           ALL            Original     FR-CNN   RetinaNet   YOLOv3      ALL
                                 (a)                                                                  (b)

      Original    FR-CNN      RetinaNet   YOLOv3           ALL            Original     FR-CNN   RetinaNet   YOLOv3      ALL
                                 (c)                                                                  (d)
                                                          Figure 8: Continued.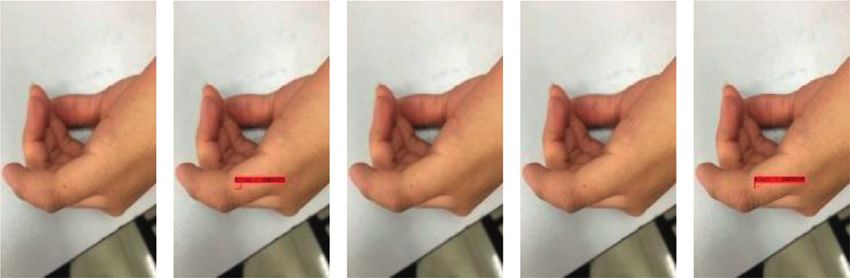
8                                                                                                       Journal of Healthcare Engineering

      Original      FR-CNN       RetinaNet     YOLOv3         ALL            Original   FR-CNN       RetinaNet      YOLOv3         ALL
                                    (e)                                                                 (f)

Figure 8: Detection of the moles in the mobile phone images of the six locally recruited participants. (a) Female-1, (b) female-2, (c) female-3,
(d) male-1, (e) male-2, and (f ) male-3.

                               Participant 1                      Participant 2                     Participant 3
                                                                       (a)

                               Participant 1                      Participant 2                     Participant 3
                                                                      (b)
                                                            Figure 9: Continued.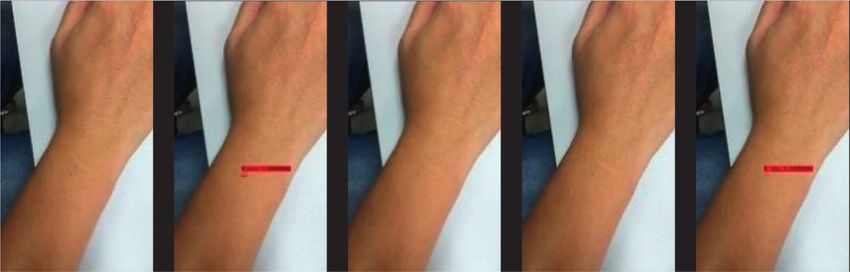
Journal of Healthcare Engineering                                                                                                                       9

                              Participant 1                                     Participant 2                      Participant 3
                                                                                     (c)

Figure 9: Detection of the moles obtained using different mobile operating systems. (a) iOS 14.2, (b) Android 10, and (c) Android 10.1.0.

                                                                      Running time on different mole images
                                                       26.00

                                                       22.00
                                      Time (seconds)

                                                       18.00

                                                       14.00

                                                       10.00
                                                                 YOLO v3              RetinaNet           FR-CNN

                                                               iOS 14.2
                                                               Android 10
                                                               Android 10.1.0
Figure 10: Running time of the three mole detection algorithms. The horizontal axis gave the algorithm names. The vertical axis gave the
running time of each algorithm on each mobile operating system. Three participants were tested, and the running time was averaged over the
three images taken by each mobile operating system.

4. Discussion                                                                                 All the detected moles and their annotations may be
                                                                                           exported for further investigations.
This study developed easy-to-use integrated software, Dia-
Mole, to help dermatological researchers collect and an-                                   5. Conclusions
notate the moles in the mobile phone-captured images.
Three popular object detection algorithms YOLOv3, FR-                                      The proposed software DiaMole may help the dermato-
CNN, and RetinaNet were integrated to find the bounding                                     logical researchers investigate the moles in mobile phone-
boxes of candidate moles. Their results may be further in-                                 captured images. Melanoma is a major lethal skin cancer,
tegrated using the NMS strategy. The candidate mole in a                                   and its early diagnosis will greatly increase the survival rate
given bounding box will be automatically segmented using                                   of the patients. Melanoma may develop from moles, but the
the UNet model. The users may manually draw a bounding                                     patients may ignore the changes of moles in many cases. This
box to cover a mole missed by DiaMole and annotate these                                   study demonstrated that the previous mole or melanoma
candidate moles based on their experiences.                                                detection algorithms were usually trained over the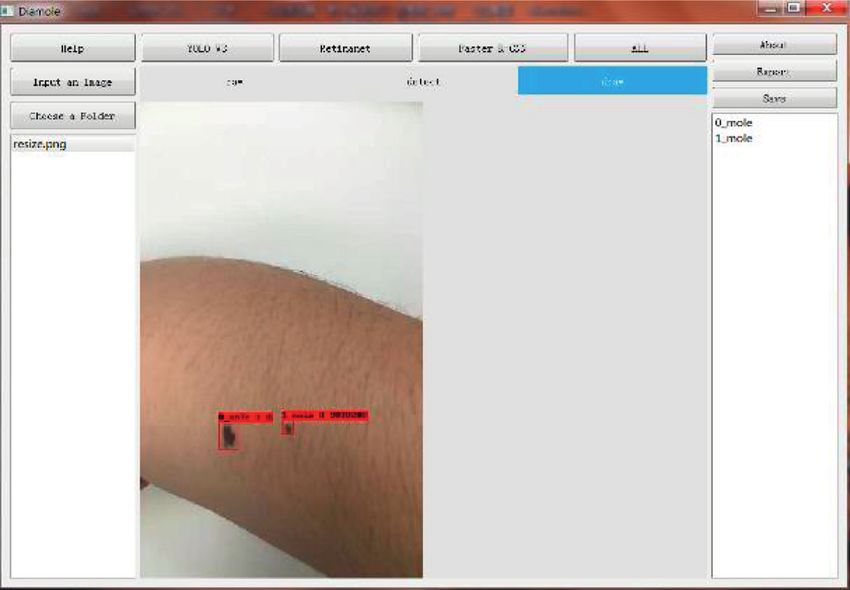
10                                                                                                   Journal of Healthcare Engineering

dermoscopic images and did not perform well on the mobile                [8] Y. Li and L. Shen, “Skin lesion analysis towards melanoma
phone-captured skin images. DiaMole utilized the object                      detection using deep learning network,” Sensors, vol. 18, no. 2,
detection algorithms to ensure that the segmentation al-                     p. 556, 2018.
gorithm was not distracted from the background objects. But              [9] S. Afifi, H. Gholamhosseini, and R. Sinha, “A system on chip
the DiaMole’s running time is a little long, and this will affect             for melanoma detection using FPGA-based SVM classifier,”
                                                                             Microprocessors and Microsystems, vol. 65, pp. 57–68, 2018.
the users’ efficiency. In future studies, we plan to test and
                                                                        [10] D. Biswas, H. Su, C. Wang, A. Stevanovic, and W. Wang, “An
integrate more lightweight neural network models into                        automatic traffic density estimation using single shot detec-
DiaMole. The neural network Python libraries with support                    tion (SSD) and MobileNet-SSD,” Physics and Chemistry of the
for parallel computing will be preferred to reduce the de-                   Earth, Parts A/B/C, vol. 110, pp. 176–184, 2019.
tection time.                                                           [11] N. Codella, V. Rotemberg, P. Tschandi et al., “Skin lesion
                                                                             analysis toward melanoma detection 2018: a challenge hosted
Data Availability                                                            by the international skin imaging collaboration (isic),” 2019,
                                                                             http://arxiv.org/abs/1902.03368.
The program and the phone-captured mole images of seven                 [12] P. Tschandl, C. Rosendahl, and H. Kittler, “The HAM10000
local participants are available at http://www.                              dataset, a large collection of multi-source dermatoscopic
healthinformaticslab.org/supp/.                                              images of common pigmented skin lesions,” Scientific Data,
                                                                             vol. 5, no. 1, Article ID 180161, 2018.
                                                                        [13] J. Redmon and A. Farhadi, “YOLOv3: an incremental im-
Conflicts of Interest                                                        provement,” 2018, http://arxiv.org/abs/1804.02767.
The authors declare that they have no conflicts of interest.             [14] T.-Y. Lin, P. Dollár, R. Girshick, K. He, B. Hariharan, and
                                                                             S. Belongie, “Feature pyramid networks for object detection,”
                                                                             in Proceedings of the IEEE Conference on Computer Vision and
Acknowledgments                                                              Pattern Recognition, pp. 2117–2125, Honolulu, HI, USA, July
                                                                             2017.
This work was supported by the Jilin Provincial Key Lab-
                                                                        [15] S. Ren, K. He, R. Girshick, and J. Sun, “Faster r-cnn: towards
oratory of Big Data Intelligent Computing (20180622002JC),                   real-time object detection with region proposal networks,”
the     Education     Department      of   Jilin  Province                   IEEE Transactions on Pattern Analysis and Machine Intelli-
(JJKH20180145KJ), and the startup grant of the Jilin Uni-                    gence, vol. 39, no. 6, pp. 1137–1149, 2015.
versity. This work was also partially supported by the Bio-             [16] T. Y. Lin, P. Goyal, R. Girshick, K. He, and P. Dollar, “Focal
know MedAI Institute (BMCPP-2018-001), the Beijing Dr.                       loss for dense object detection,” 2017, http://arxiv.org/abs/
of Acne Medical Research Institute (BDAM-Research-2019-                      1708.02002.
008), the High Performance Computing Center of Jilin                    [17] A. Neubeck and L. V. Gool, “Efficient non-maximum sup-
University, and the Fundamental Research Funds for the                       pression,” in Proceedings of the 18th International Conference
Central Universities, JLU. The authors acknowledge the                       on Pattern Recognition, pp. 850–855, Hong Kong, China,
                                                                             August 2006.
MoleMapper project for providing the mobile phone images
                                                                        [18] A. Bissoto, F. Perez, V. Ribeiro, M. Fornaciali, S. Avila, and
of skin moles to evaluate the performance of DiaMole.                        E. Valle, “Deep-learning ensembles for skin-lesion segmen-
                                                                             tation, analysis, classification,” 2018, http://arxiv.org/abs/
References                                                                   1808.08480.
                                                                        [19] S. Rajaraman, S. K Antani, M Poostchi et al., “Pre-trained
 [1] A. F. Jerant, J. T. Johnson, C. D. Sheridan, T. J. Caffrey, and          convolutional neural networks as feature extractors toward
     T. J. Sheridan, “Early detection and treatment of skin cancer,”         improved malaria parasite detection in thin blood smear
     American Family Physician, vol. 62, no. 2, pp. 357–362, 2000.           images,” PeerJ, vol. 6, Article ID e4568, 2018.
 [2] D. Schadendorf, A. C. J. van Akkooi, C. Berking et al.,
     “Melanoma,” Lancet, vol. 392, no. 10151, pp. 971–984, 2018.
 [3] N. Chuchu, Y. Takwoingi, J. Dinnes et al., “Smartphone ap-
     plications for triaging adults with skin lesions that are sus-
     picious for melanoma,” Cochrane Database of Systematic
     Reviews, vol. 12, Article ID CD013192, 2018.
 [4] T. Petrie, R. Samatham, A. M. Witkowski, A. Esteva, and
     S. A. Leachman, “Melanoma early detection: big data, bigger
     picture,” Journal of Investigative Dermatology, vol. 139, no. 1,
     pp. 25–30, 2019.
 [5] D. E. Webster, C. Suver, M. Doerr et al., “The mole mapper
     study, mobile phone skin imaging and melanoma risk data
     collected using research kit,” Scientific Data, vol. 4, no. 1,
     Article ID 170005, 2017.
 [6] N. K. Mishra and M. E. Celebi, “An overview of melanoma
     detection in dermoscopy images using image processing and
     machine learning,” 2016, http://arxiv.org/abs/1601.07843.
 [7] L. Zhang, G. Yang, and X. Ye, “Automatic skin lesion seg-
     mentation by coupling deep fully convolutional networks and
     shallow network with textons,” Journal of Medical Imaging,
     vol. 6, no. 2, Article ID 024001, 2019.
You can also read