Distinguishing the impacts of natural and anthropogenic aerosols on global gross primary productivity through diffuse fertilization effect - Recent
←
→
Page content transcription
If your browser does not render page correctly, please read the page content below
Research article
Atmos. Chem. Phys., 22, 693–709, 2022
https://doi.org/10.5194/acp-22-693-2022
© Author(s) 2022. This work is distributed under
the Creative Commons Attribution 4.0 License.

        Distinguishing the impacts of natural and anthropogenic
         aerosols on global gross primary productivity through
                        diffuse fertilization effect
             Hao Zhou1,2 , Xu Yue3 , Yadong Lei4 , Chenguang Tian1,2 , Jun Zhu3 , Yimian Ma1,2 , Yang Cao1,2 ,
                                            Xixi Yin3 , and Zhiding Zhang3
                           1 ClimateChange Research Center, Institute of Atmospheric Physics (IAP),
                                 Chinese Academy of Sciences (CAS), Beijing 100029, China
                                 2 University of Chinese Academy of Sciences, Beijing, China
                  3 Jiangsu Key Laboratory of Atmospheric Environment Monitoring and Pollution Control,

        Jiangsu Collaborative Innovation Center of Atmospheric Environment and Equipment Technology, School of
        Environmental Science and Engineering, Nanjing University of Information Science & Technology (NUIST),
                                                    Nanjing 210044, China
            4 State Key Laboratory of Severe Weather & Key Laboratory of Atmospheric Chemistry of the China

                                            Meteorological Administration (CMA),
                             Chinese Academy of Meteorological Sciences, Beijing 100081, China
                                         Correspondence: Xu Yue (yuexu@nuist.edu.cn)

                                  Received: 19 August 2021 – Discussion started: 16 September 2021
                        Revised: 10 November 2021 – Accepted: 1 December 2021 – Published: 17 January 2022

       Abstract. Aerosols can enhance ecosystem productivity by increasing diffuse radiation. Such diffuse fertiliza-
       tion effects (DFEs) vary among different aerosol compositions and sky conditions. Here, we apply a suite of
       chemical, radiation, and vegetation models in combination with ground- and satellite-based measurements to
       assess the impacts of natural and anthropogenic aerosol species on gross primary productivity (GPP) through
       DFE from 2001–2014. Globally, aerosols enhance GPP by 8.9 Pg C yr−1 under clear-sky conditions but only
       0.95 Pg C yr−1 under all-sky conditions. Anthropogenic aerosols account for 41 % of the total GPP enhance-
       ment, though they contribute only 25 % to the increment of diffuse radiation. Sulfate/nitrate aerosols from
       anthropogenic sources make dominant contributions of 33 % (36 %) to aerosol DFE under all-sky (clear-sky)
       conditions, followed by the fraction of 18 % (22 %) by organic carbon aerosols from natural sources. In contrast
       to other species, black carbon aerosols reduce global GPP by 0.28 (0.12) Pg C yr−1 under all-sky (clear-sky)
       conditions. Long-term simulations show that aerosol DFE increases 2.9 % yr−1 under all-sky conditions mainly
       because of a downward trend in cloud amount. This study suggests that the impacts of aerosols and cloud should
       be considered in projecting future changes of ecosystem productivity under varied emission scenarios.

1   Introduction                                                     (LUE = GPP / PAR, gross primary productivity per photo-
                                                                     synthetically active radiation) (Roderick et al., 2001; Gu et
Diffuse light enhances plant photosynthesis more efficiently         al., 2003; Rap et al., 2015). However, direct light is absorbed
than direct light (Gu et al., 2002; Alton et al., 2007; Mercado      only by sunlit leaves, and much of it is wasted because these
et al., 2009; Jing et al., 2010; Cirino et al., 2014; Zhou et al.,   leaves are usually at the light-saturated conditions (Gu et al.,
2021a, c). The cause for such a difference is that diffuse light     2002; He et al., 2013). As a result, increasing the diffuse ra-
can penetrate into the deep canopy and enhance photosyn-             diation can help promote canopy photosynthesis through the
thesis of more shaded leaves with higher light use efficiency        diffuse fertilization effect (DFE).

Published by Copernicus Publications on behalf of the European Geosciences Union.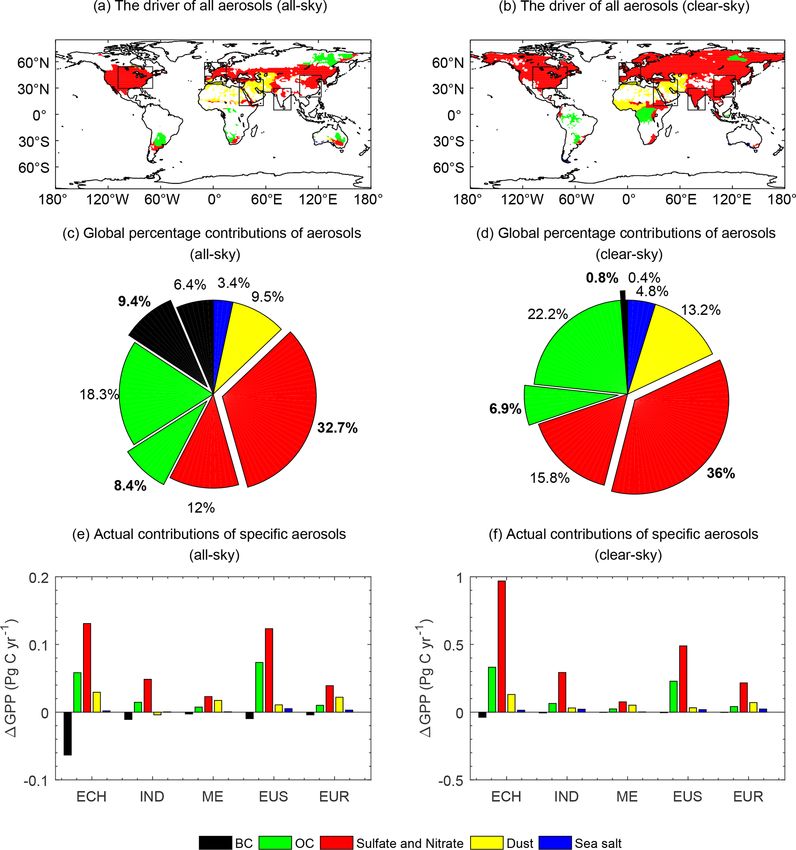
694                         H. Zhou et al.: Distinguishing the impacts of natural and anthropogenic aerosols on global GPP

Table 1. Summary of previous studies about aerosol DFE.

  Period         Region                  Method     Species                   Results∗                           References
  2000–2001      Eastern United States   Model      Aerosols                  Aerosol DFE decreases NPP          Matsui et al. (2008)
                                                                              by 0.71 g C m−2 (−0.09 %) in
                                                                              2000 but increases NPP by
                                                                              5 g C m−2 (0.5 %) in 2001.
  1960–1999      Global                  Model      Cloud and aerosols        DFE enhances the land car-         Mercado et al. (2009)
                                                                              bon sink by approximately one-
                                                                              quarter from 1960–1999.
  2002–2003      Amazon                  Flux.obs   Smoke aerosols            The increase in CO2 uptake un-     Doughty et al. (2010)
                                                                              der high AOD is due to DFE
                                                                              (80 %) and decreased tempera-
                                                                              ture (20 %).
  Jul–Aug 2007   Northwest China         Flux.obs   Cloud and aerosols        Cloud dominates DFE, but           Jing et al. (2010)
                                                                              aerosols lead to negative carbon
                                                                              uptake.
  2003–2010      Global                  Model      Aerosols                  Aerosol DFE enhances GPP           Chen and Zhuang (2014)
                                                                              by 4.9 Pg C yr−2 , NPP by
                                                                              3.8 Pg C yr−2 , and NEP by
                                                                              3.9 Pg C yr−2 .
  1999–2009      Amazon                  Flux.obs   Cloud and fire aerosols   Low AOD and cloud cover            Cirino et al. (2014)
                                                                              lead to relatively larger photo-
                                                                              synthetic efficiency than high
                                                                              aerosol loading and thick cloud.
  1998–2007      Amazon                  Model      Fire aerosols             Fire aerosols enhance diffuse      Rap et al. (2015)
                                                                              radiation by 3.4 %–6.8 % and
                                                                              NPP by 1.4 %–2.8 %.
  2003–2012      Eastern United States   Flux.obs   Aerosols                  High AOD (> 0.6) enhances          Strada et al. (2015)
                                                                              plant productivity for forests,
                                                                              but causes negative effects for
                                                                              croplands and grasslands.
  2000           Global                  Model      Aerosols                  Aerosol DFE increases global       Strada and Unger (2016)
                                                                              GPP by 1 %–2 %.
  1995–2013      United States           Model      Sulfate aerosols          The reductions of sulfate          Keppel-Aleks and Washenfelder (2016)
                                                                              aerosols lead to decreased
                                                                              diffuse light by 0.6 % yr−1 and
                                                                              GPP by 0.07 % yr−1 .
  2010           Amazon                  Model      Fire aerosols             Fire aerosols increase GPP by      Moreira et al. (2017)
                                                                              27 % and plant respiration by
                                                                              10 % and decrease soil respira-
                                                                              tion by 3 %.
  2010           Boreal North America    Model      Fire aerosols             Fire aerosols increase NPP         Yue et al. (2017a)
  2050                                                                        by 8 Tg C yr−1 in the 2010s
                                                                              and 14 Tg C yr−1 in the 2050s
                                                                              due to increased diffuse radia-
                                                                              tion of 2.6 W m−2 (1.7 %) and
                                                                              4.0 W m−2 (2.3 %).
  2009–2011      China                   Model      Aerosols                  Aerosols increase NPP by 1.6±      Yue and Unger (2017)
                                                                              0.5 % under all-sky conditions
                                                                              and 35 ± 0.9 % under clear-sky
                                                                              conditions.
  2008–2017      Eurasia                 Flux.obs   Aerosols                  High aerosol loading increases     Ezhova et al. (2018)
                                                                              GPP by 6 %–14 % at all sites.
  2000           Global                  Model      Biogenic aerosols         Biogenic aerosols enhance          Rap et al. (2018)
                                                                              global NPP by 1.23 Pg C yr−1
                                                                              due to DFE.
  2001–2011      Global                  Model      All and fire aerosols     All (fire) aerosols increase       Yue and Unger (2018)
                                                                              global GPP by 1.0 ± 0.2
                                                                              (0.05 ± 0.3) Pg C yr−1 due to
                                                                              DFE.

Atmos. Chem. Phys., 22, 693–709, 2022                                                                https://doi.org/10.5194/acp-22-693-2022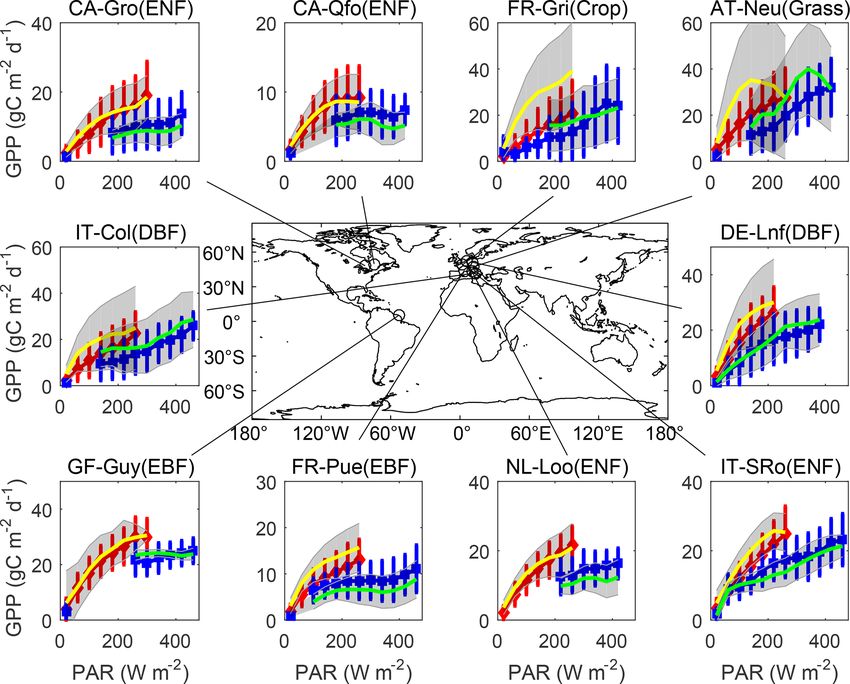
H. Zhou et al.: Distinguishing the impacts of natural and anthropogenic aerosols on global GPP                                                                   695

Table 1. Continued.

          Period              Region                       Method       Species                      Results∗                          References
          2014–2015           China                        Flux.obs     Aerosols                     Photosynthesis of sunlit and      Wang et al. (2018)
                                                                                                     shaded leaves increases by
                                                                                                     0.56 % and 10.71 % due to the
                                                                                                     increase in AOD of 0.1.
          2000                Amazon                       Model        Fire aerosols                Fire aerosols increase NPP by     Malavelle et al. (2019)
                                                                                                     5–13 Tg C yr−1 due to radiative
                                                                                                     effects.
          2018                Western North America        Flux.obs     Wildfire-smoke aerosols      Aerosols lead to GPP enhance-     Hemes et al. (2020)
                                                                                                     ment of 1.2 %–4.1 % compared
                                                                                                     to the previous growing season.
          2006–2015           China                        Model        Aerosols                     Aerosols enhance GPP by           Xie et al. (2020)
                                                                                                     0.36 Pg C yr−1 (5 %), and
                                                                                                     DFE makes the dominant
                                                                                                     contribution (59 %–62 %).

∗ Carbon metrics include net primary productivity (NPP), net ecosystem productivity (NEP), and gross primary productivity (GPP)

   Atmospheric aerosols can alter the quality of sunlight                                    Although observational studies directly estimate site-level
reaching Earth’s surface by absorbing and scattering so-                                  aerosol DFE, they are not able to reveal regional or global
lar insolation (Zhou et al., 2021b). The aerosol-induced ra-                              aerosol DFE due to the limited spatiotemporal coverage. On
diative impacts on terrestrial ecosystem productivity have                                the global scale, studies using varied models showed that
been investigated in both observational and modeling stud-                                aerosol DFE enhances global GPP by 4.9 Pg C yr−1 (Chen
ies (Table 1). Observations found unexpected decline of at-                               and Zhuang, 2014), 1 %–2 % (Strada and Unger, 2016), and
mospheric carbon dioxide in 1990s, which was attributed to                                1.0 ± 0.2 Pg C yr−1 (Yue and Unger, 2018) in different peri-
the increase in vegetation carbon uptake owing to the mas-                                ods. Rap et al. (2018) specifically explored DFE from bio-
sive eruption of Mt. Pinatubo in 1991 (Roderick et al., 2001).                            genic aerosols and found that biogenic aerosols enhance
Sulfate aerosols from volcanic eruption almost doubled dif-                               global net primary productivity (NPP) by 1.23 Pg C yr−1 . Re-
fuse radiation in the clear sky, leading to the enhancement                               gionally, Matsui et al. (2008) applied a land surface model
of plant productivity by 23 % at Harvard forests in 1992                                  and estimated that aerosol DFE decreased NPP by 0.09 %
(Gu et al., 2003). With the development of ground-based in-                               in 2000 but increased NPP by 0.5 % in 2001 over the east-
struments and satellite remote sensing, more observational                                ern US, because the cloud optical depth was about half in
data have been applied to detect the aerosol DFE. Strada et                               2001 relative to 2000. At the same region, Keppel-Aleks and
al. (2015) estimated aerosol DFE on plant productivity using                              Washenfelder (2016) estimated sulfate aerosol DFE using the
aerosol optical depth (AOD) from satellite cloudless obser-                               Community Earth System Model and found that the reduc-
vations at 10 flux sites, and they found that aerosols enhance                            tions of sulfate aerosols by 3.0 ± 0.6 % yr−1 led to reduc-
GPP by 13 % in midday hours under high-AOD conditions                                     tions of 0.6 % yr−1 in diffuse radiation and 0.07 % yr−1 in
(> 0.4) for deciduous and mixed forests. Similarly, Ezhova et                             regional GPP from 1995–2013. In Amazon, fire aerosols are
al. (2018) found that aerosols increase clear-day diffuse frac-                           estimated to play a role in varied DFEs among different stud-
tion from 0.11 to 0.27 at five remote sites in Eurasia, leading                           ies (Rap et al., 2015; Moreira et al., 2017; Yue and Unger,
to the enhancement of site-level GPP by 6 %–14 %.                                         2018; Malavelle et al., 2019). For example, Rap et al. (2015)
   In contrast to the large benefits on clear days, the aerosol                           found that fire aerosols enhance NPP by 1.4 %–2.8 % while
DFE is limited on cloudy days. Kanniah et al. (2013) ex-                                  Moreira et al. (2017) estimated that fire aerosols enhance
plored cloud direct radiative effects on canopy productivity                              GPP by 27 %. Such differences are mainly attributed to the
using observed carbon fluxes and radiation in tropical savan-                             high aerosol loading in Moreira et al. (2017) for September
nas, and they found that thick cloud masked aerosol DFE                                   2010 but much lower loading in Rap et al. (2015) for the 10-
and reduced GPP by 26 %. Cirino et al. (2014) also found                                  year (1998–2007) averages. Although these studies assessed
that aerosol DFE cannot increase plant photosynthesis under                               the DFE of total aerosols or the specific species (e.g., sul-
cloudy conditions. These studies indicated that aerosol DFE                               fate, fire, or biogenic), the individual DFEs of natural and
is subject to sky conditions and aerosol loading because the                              anthropogenic aerosols on global terrestrial productivity re-
potential benefits from DFE can be offset or even reversed by                             main unclear.
simultaneous reductions in direct radiation caused by thick                                  In this study, we explore the impacts of natural and anthro-
cloud or high aerosol loading (Alton, 2008; Cirino et al.,                                pogenic aerosol DFE on global GPP from 2001–2014 using
2014; Yue and Unger, 2017; Zhou et al., 2021b).                                           both multi-source observations and a series of well-validated

https://doi.org/10.5194/acp-22-693-2022                                                                            Atmos. Chem. Phys., 22, 693–709, 2022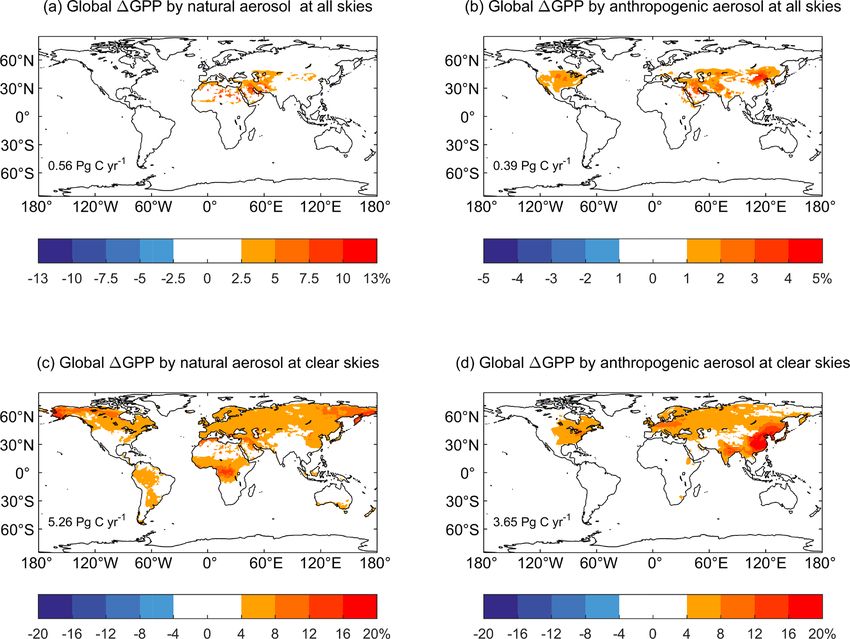
696                        H. Zhou et al.: Distinguishing the impacts of natural and anthropogenic aerosols on global GPP

models. A chemical transport model (CTM) is used to pre-           2.2   Radiative transfer model
dict changes of natural and anthropogenic aerosol concen-
                                                                   The Column Radiation Model (CRM) is the standalone
trations. A radiative transfer model is applied to calculate the
                                                                   version of the radiative transfer module used by the
perturbations in direct and diffuse PAR caused by aerosols. A
                                                                   NCAR Community Climate Model (http://www.cesm.ucar.
global dynamic vegetation model is used to quantify changes
                                                                   edu/models/, last access: 12 July 2021). In this model,
of global GPP caused by aerosol DFE. The main objectives
                                                                   aerosol direct radiative effects including absorbing and scat-
are (1) to distinguish the DFEs of natural and anthropogenic
                                                                   tering processes are calculated at 20 vertical layers from the
aerosols on global GPP and (2) to explore the different char-
                                                                   surface to 0.5 hPa at hourly intervals (Yue and Unger, 2017).
acteristics of aerosol DFEs for varied species.
                                                                   The CRM utilizes aerosol profiles of all species simulated
                                                                   by GEOS-Chem, including sulfate, nitrate, black carbon
2     Methods                                                      (BC), organic carbon (OC), dust (clay and silt), and sea salt
                                                                   (coarse and accumulation modes). Aerosol optical param-
2.1    Chemical transport model
                                                                   eters (e.g. single-scattering albedo, extinction coefficients,
The Goddard Earth Observing System coupled with                    and asymmetric parameters) are adopted from Yue and Liao
Chemistry (GEOS-Chem, http://geos-chem.org, last access:           (2012) for sea salt, Yue et al. (2010) for mineral dust, and
15 June 2021) is a three-dimensional (3-D) CTM for sim-            the RegCM4 model for other species (Giorgi et al., 2012). In
ulating atmospheric compositions and air quality (Bey et           this study, the CRM is used to simulate aerosol-induced per-
al., 2001). Global anthropogenic emissions from 2001–2014          turbations in surface radiative fluxes including diffuse and
are from the Community Emissions Data System (CEDS)                direct PAR. The model is driven with hourly 1◦ × 1◦ me-
inventory (http://www.globalchange.umd.edu/ceds/, last ac-         teorology from MERRA-2 reanalyses and 3-hourly cloud
cess: 15 June 2021). The CEDS inventory has been used              cover and liquid water path from CERES SYN1deg (http:
as anthropogenic emissions in the Coupled Model Inter-             //ceres.larc.nasa.gov, last access: 12 July 2021).
comparison Project Phase 6 (CMIP6), and this emission
database relies on existing energy consumption datasets and        2.3   Dynamic vegetation model
regional or country-specific inventories to produce trends
over recent decades (Hoesly et al., 2018). The specific emis-      The Yale Interactive terrestrial Biosphere (YIBs) model is
sion species include aerosols (black carbon, organic carbon),      a process-based vegetation model that dynamically simu-
aerosol precursors, and reactive compounds (SO2 , NOx ,            lates tree growth and leaf area changes (Yue and Unger,
NH3 , CH4 , CO, and non-methane volatile organic com-              2015). The model uses the well-established leaf photosynthe-
pounds (VOCs)) (Supplement Table S1). To estimate model-           sis (Farquhar et al., 1980) and stomatal conductance schemes
ing uncertainties due to emission inventories, the Emissions       (Ball et al., 1987). The canopy is divided into sunlit and
Database for Global Atmospheric Research (EDGAR) in-               shaded portions to separate photosynthetic responses to dif-
ventory vision 4.3.1 (https://edgar.jrc.ec.europa.eu/, last ac-    fuse and direct light (Spitters et al., 1986). We distinguish
cess: 15 June 2021) from 2001–2010 is also used as alter-          light absorption between sunlit (receiving both diffuse and
native anthropogenic emissions for the GEOS-Chem model.            direct light) and shaded leaves (receiving only diffuse light),
For natural emissions, the Global Fire Emission Database           and we derive canopy photosynthesis as the sum of that from
(GFED) version 4 inventory is used to represent emissions          sunlit and shaded leaves:
from open fires (http://www.globalfiredata.org/, last access:
15 June 2021). Biogenic VOC emissions are calculated us-           Atotal = Asunlit × Fsunlit + Ashaded × (1 − Fsunlit ) ,    (1)
ing the Model of Emissions of Gases and Aerosols from Na-
                                                                   where Asunlit and Ashaded are the photosynthesis of sunlit and
ture (MEGAN v2.1) (Guenther et al., 2012). Natural emis-
                                                                   shaded leaves, respectively. The fraction of sunlit leaf area
sions of sea salt (Jaeglé et al., 2011), dimethyl sulfate (Brei-
                                                                   Fsunlit is calculated as
der et al., 2017), volcanic SO2 (Fisher et al., 2011), and
NH3 are from the Global Emissions InitiAtive (GEIA, http:          Fsunlit = e−kL .                                           (2)
//www.geiacenter.org/, last access: 15 June 2021). In this
study, GEOS-Chem version 12.0.0 is used to simulate con-           Here, L is leaf area index (LAI) at one canopy layer, and
centrations of natural and anthropogenic aerosols at a hori-       k is extinction coefficient defined as 0.5/ cos α (solar zenith
zontal resolution of 4◦ × 5◦ and 47 vertical layers. The CTM       α). Compared with global in situ measurements, this canopy
is driven with assimilated meteorology from the Modern-Era         radiative transfer scheme reasonably captures the different
Retrospective analysis for Research and Applications, ver-         responses of GPP to direct and diffuse radiation (Yue and
sion 2 (MERRA2).                                                   Unger, 2018; Zhou et al., 2021a). For this study, we use the
                                                                   original scheme without modifications.
                                                                      Simulated GPP by the YIBs model has been validated us-
                                                                   ing ground-based observations at 145 sites and yielded an

Atmos. Chem. Phys., 22, 693–709, 2022                                                  https://doi.org/10.5194/acp-22-693-2022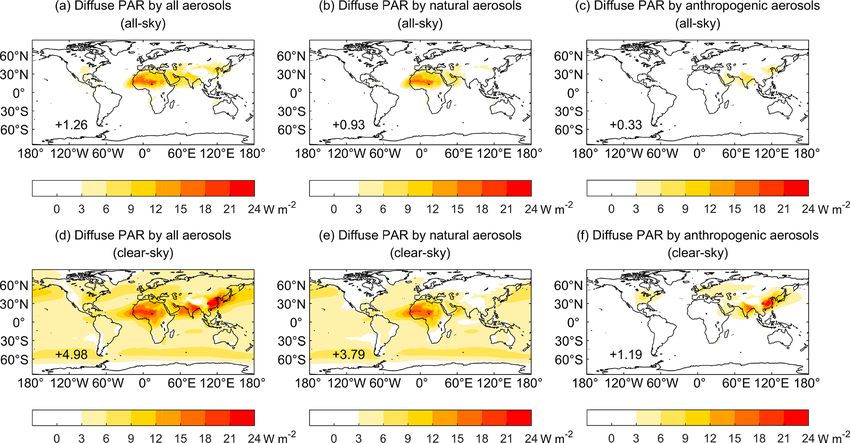
H. Zhou et al.: Distinguishing the impacts of natural and anthropogenic aerosols on global GPP                               697

average correlation coefficient of 0.76 for all sites (Yue and      the same in all runs, so as to exclude their impacts on global
Unger, 2015). The simulated global GPP also shows rea-              GPP.
sonable spatiotemporal variations compared with satellite re-
trievals (Yue et al., 2015). Recently, the model joined the         2.5    Observations for model evaluations
multi-model ensemble project of TRENDY to provide the es-
timates of global carbon budget (Friedlingstein et al., 2020).      We use site-level measurements of carbon fluxes from the
In this study, the YIBs model is used to isolate impacts of         FLUXNET2015 product (http://fluxnet.fluxdata.org/, last ac-
aerosol-induced PAR changes on GPP on the global scale.             cess: 15 August 2020) to validate model GPP and its re-
The model is driven with 1◦ × 1◦ meteorological forcing             sponses to diffuse and direct radiation. We select 10 sites
from MERRA-2 reanalyses and PAR (both diffuse and di-               providing simultaneous observations of diffuse radiation and
rect) simulated by CRM. Land cover product from MODIS               GPP at half-hourly time intervals for at least 8 years. On
is used as vegetation coverage for the YIBs model (Yue et al.,      the global scale, observed AOD is retrieved from the Moder-
2021), and observed CO2 concentrations from Mauna Loa               ate Resolution Imaging Spectroradiometer (MODIS, https://
are also used (Yue et al., 2015).                                   modis.gsfc.nasa.gov, last access: 14 August 2020), and GPP
                                                                    is derived using the global OCO-2-based SIF product (Li and
                                                                    Xiao, 2019). The all-sky and clear-sky shortwave radiation
2.4   Model simulations                                             are adopted from CERES SYN1deg (http://ceres.larc.nasa.
                                                                    gov, last access: 12 July 2021) to validate the CRM radia-
We perform two GEOS-Chem runs, as well as 22 CRM and                tive transfer model. To evaluate the performance of models,
YIBs runs, to isolate aerosol direct radiative impacts on GPP       we use statistical metrics including correlation coefficients
at different sky conditions (Table S2 in the Supplement).           (R) and normalized mean biases (NMB) defined as follows:
The GEOS-Chem runs GC_ALL and GC_NAT are driven                                 Pi=n
with the same meteorology and emissions except that the                             i=1 (Mi
                                                                                      − M)(Oi − O)
                                                                    R = qP                                 ,                   (3)
former includes all sources of emissions while the latter ex-              i=n         2×
                                                                                           Pi=n          2
                                                                         i=1 (M i − M)      i=1 (Oi − O)
cludes only anthropogenic emissions. Following the meth-                 Pi=n
ods in Nascimento et al. (2021) and Ryu et al. (2013), we                     (Mi − Oi )
use the differences between GC_ALL and GC_NAT to rep-               NMB = i=1
                                                                            Pi=n         ,                                     (4)
                                                                               i=1 Oi
resent aerosol concentrations contributed by anthropogenic
sources. In this practice, the sums of natural and anthro-          where Oi and Mi are observed and modeled values, respec-
pogenic aerosol concentrations are equal to the total aerosol       tively. O and M are the averages of the observed and mod-
concentrations without non-linear effects. Both GC_ALL              eled values. In this study, R and NMB are used to evaluate
and GC_NAT runs provide 3-D concentrations of different             the performance of models on the spatial scale, and the Stu-
aerosol types including sulfate, nitrate, OC, BC, dust, and sea     dent t test is used to examine the significance of correlation
salt. The CRM runs aim to calculate aerosol-induced PAR             coefficients and long-term trends.
changes using aerosol profiles simulated by GEOS-Chem.
These runs can be divided into two groups, with CLD runs
                                                                    3     Results
(all-sky conditions) are forced with observed cloud profiles
while CLR runs (clear-sky conditions) forced without any
                                                                    3.1    Model evaluations
cloud coverage. CRM_ALL and CRM_NAT are driven with
aerosol profiles of all species from GC_ALL and GC_NAT,             The YIBs model simulates a reasonable spatial pattern of
respectively. The impacts of individual aerosol species on          GPP compared to observations (Fig. S1) with a high cor-
PAR are isolated with individual aerosol profiles from ei-          relation coefficient (R) of 0.88 (p < 0.01) and a low nor-
ther GC_ALL or GC_NAT. For example, OC from GC_ALL                  malized mean bias (NMB) of −2.3 %. Similarly, modeled
and cloud amounts from CERES SYN1deg are used to drive              AOD from the GEOS-Chem model reproduces the observed
CRM (CRM_ALL_OCCLD) so as to isolate the impacts of                 spatial pattern from the MODIS product with a high R of
OC aerosols on PAR under all-sky conditions. It should be           0.78 (p < 0.01), though it overestimates the mean AOD by
noted that such a setup cannot resolve the interactive re-          21.7 % in eastern China and 37.9 % in southern Africa while
sponses among aerosol species, because the sum of individ-          it underestimates AOD by 35.7 % in Amazon, 25.2 % in cen-
ual aerosol effects is not necessarily equal to the net impact of   tral Africa, and 53.4 % in southeast Asia, leading to a global
all aerosols. The magnitude of these non-linear effects will be     NMB of −25.8 %.
evaluated accordingly. For each of CRM runs, the predicted             CRM driven with aerosol concentrations from GEOS-
diffuse and direct PAR values are used as input for the YIBs        Chem shows similar patterns of shortwave radiation to the
model to simulate GPP changes caused by aerosol DFEs. For           satellite observations (Fig. S2). The simulations match obser-
YIBs runs, other forcings (e.g., CO2 concentrations and cli-        vations well, with a high R of 0.98 and low NMB of 4.1 %
mate meteorology) except diffuse and direct PAR are kept            under all-sky conditions, and they show even better perfor-

https://doi.org/10.5194/acp-22-693-2022                                                Atmos. Chem. Phys., 22, 693–709, 2022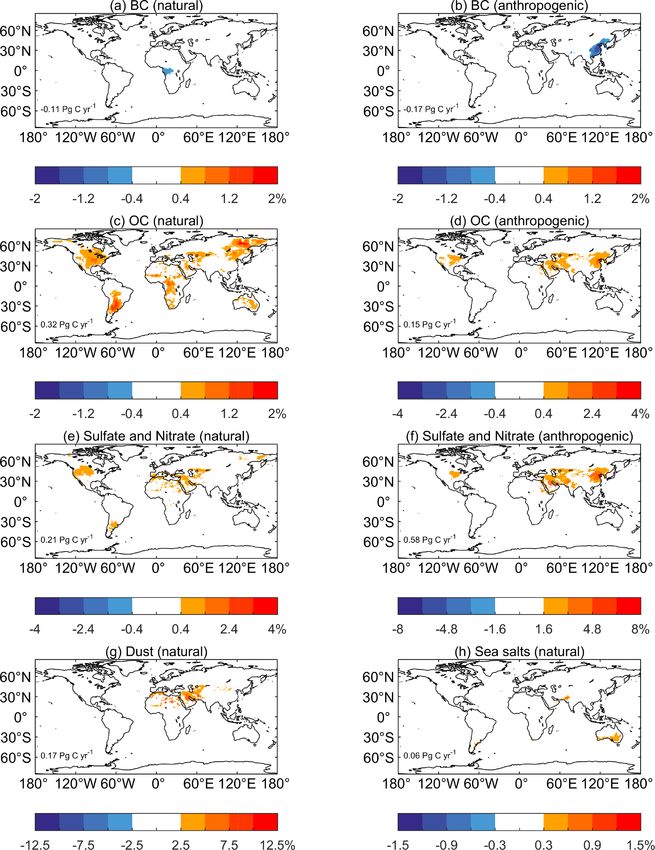
698 H. Zhou et al.: Distinguishing the impacts of natural and anthropogenic aerosols on global GPP
mance with R of 1 and NMB of 3.7 % under clear-sky con- hancing diffuse PAR of 0.93 W m−2 (Fig. 2b) and reducing
ditions. Although CRM presents high R and low NMB un- direct PAR of 2.05 W m−2 (Fig. S4b) under all-sky condi-
der both sky conditions, evaluations still show that modeled tions. As a comparison, anthropogenic aerosols induce much
shortwave radiation is higher than observations. Such over- smaller changes of diffuse radiation by 0.33 W m−2 and di-
estimation may be related to the underestimation of simu- rect radiation of −0.72 W m−2 (Figs. 2c and S4c). Natural
lated AOD (Fig. S1), which leads to more shortwave radia- aerosols mainly influence PAR fluxes in northern Africa ow-
tion reaching the surface. We further evaluate the simulated ing to a large amount of dust aerosols, while anthropogenic
diffuse fraction (DF) with satellite observations (Fig. S3). aerosols dominate PAR changes in eastern China, India, and
Simulations reproduce the observed spatial pattern with high the eastern US due to the large anthropogenic emissions.
R of 0.82 and low NMB of −0.1 % on the global scale, but Under clear-sky conditions, natural aerosols enhance diffuse
they overestimate regional DF over high latitudes and under- PAR by 3.79 W m−2 (Fig. 2e) and reduce direct PAR by
estimate DF over Asia. Moreover, CRM simulates reasonable 5.84 W m−2 (Fig. S4e), and anthropogenic aerosols on av-
aerosol direct radiative effects compared to multiple radiative erage enhance diffuse PAR by 1.19 W m−2 and reduce direct
transfer models as shown in Yue and Unger (2018). PAR by 1.88 W m−2 .
We then compared the simulated and observed GPP re- We further explore the contributions of individual aerosol
sponses to direct (diffuse fraction < 0.2) and diffuse ra- species to the changes of diffuse and direct PAR un-
diation (diffuse fraction > 0.8) (Fig. 1). Observations and der all-sky conditions (Figs. S5 and S6). On the global
simulations show that diffuse light can increase GPP more scale, sulfate and nitrate aerosols enhance diffuse PAR by
efficiently than direct radiation as shown by the higher 0.57 W m−2 , accounting for 51 % of aerosol-induced dif-
GPP–PAR slopes at diffuse conditions. Similar results were fuse PAR changes. Meanwhile, diffuse PAR is enhanced
achieved by Mercado et al. (2009) and Yue and Unger (2018) 0.05, 0.37, and 0.25 W m−2 by the scattering effects of OC,
using the same methods. The diffuse fertilization efficiency, dust, and sea salt aerosols. However, BC aerosols reduce dif-
percentage changes in GPP per unit diffuse PAR, is esti- fuse PAR by 0.06 W m−2 due to the strong absorption. The
mated to be 0.45 % W−1 m2 –0.7 % W−1 m2 for observations changes of direct PAR caused by all aerosol species are neg-
and 0.3 % W−1 m2 –0.69 % W−1 m2 for simulations. As a re- ative, especially that by sulfate and nitrate (−0.97 W m−2 ),
sult, the YIBs model can reasonably reproduce varied light- dust (−0.86 W m−2 ), and sea salt (−0.5 W m−2 ). Gener-
response curves so as to isolate GPP responses to direct and ally, natural aerosols dominate changes of diffuse and direct
diffuse radiation. PAR owing to the large contributions from dust and sea salt
aerosols. However, sulfate, nitrate, and BC aerosols from an-
3.2 Changes of PAR by aerosols
thropogenic sources dominate the changes of diffuse and di-
rect PAR over eastern China, India, and the eastern US.
Aerosols reduce total PAR but enhance diffuse PAR at the
surface. Relative to PAR changes without aerosols, appear- 3.3 DFE by natural and anthropogenic aerosols
ance of aerosols on average reduces total surface PAR by
1.52 W m−2 under all-sky conditions and 2.73 W m−2 un- We quantify the percentage changes of global GPP caused
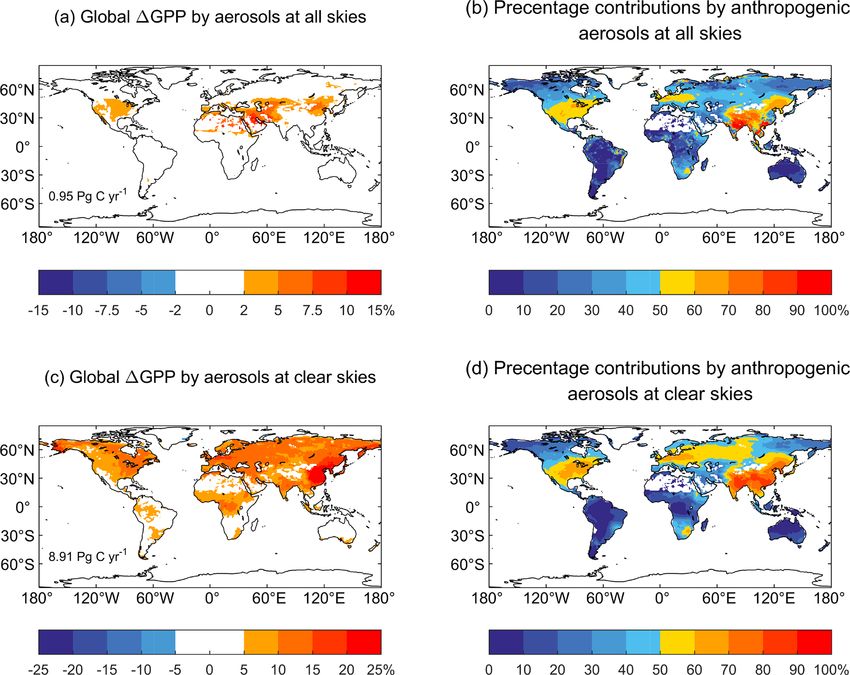
der clear-sky conditions on the global scale. Under all-sky by aerosol DFE. Relative to GPP changes without aerosols,
conditions, aerosols enhance diffuse PAR by 1.26 W m−2 aerosol DFE enhances global GPP by 0.65 % (0.95 ±
(Fig. 2a) but reduce direct PAR by 2.78 W m−2 (Fig. S4a). 0.13 Pg C yr−1 ) under all-sky conditions (Fig. 3a). Relatively
These changes are larger in clear-sky conditions, with en- high enhancements (> 2 %) in GPP are found over middle
hancement of diffuse PAR by 4.98 W m−2 (Fig. 2d) and re- latitudes (20–50◦ N) following the changes of diffuse PAR
duction of direct PAR by 7.71 W m−2 (Fig. S4d). Region- (Fig. 2a). The DFE of natural aerosols enhances global GPP
ally, aerosols cause large enhancement of diffuse PAR (> by 0.38 % (0.56 ± 0.1 Pg C yr−1 ), mainly over the Middle
3 W m−2 ) over southern US, Australia, Europe, and north- East and northern Africa due to dust aerosols (Figs. 4a and
ern Asia under clear-sky conditions (Fig. 2d). However, these 5g). The DFE of anthropogenic aerosols enhances global
enhancements of diffuse PAR are largely dampened under GPP up to 0.27 % (0.39 ± 0.04 Pg C yr−1 ), especially over
all-sky conditions (Fig. 2a). Similar changes in diffuse radi- populous regions including northeast China, the Middle East,
ation by aerosols are predicted by Chen and Zhuang (2014) and the contiguous US (Fig. 4b).
and Rap et al. (2018), though the former study yielded much Under clear-sky conditions, aerosol DFE enhances global
larger changes in radiation, and the latter examined only bio- GPP up to 7.8 % (8.91 ± 0.26 Pg C yr−1 ) (Fig. 3c), which
genic aerosols. The cause of smaller PAR changes under all- is around 9.5 times that under all-sky conditions (Fig. 3a).
sky conditions is that cloud tends to weaken aerosol radiative In most regions, aerosol DFE increases GPP by more than
forcing by amplifying absorption and diminishing scattering 4 %, with the maximum enhancement of 22.7 % in East Asia.
(Paulot et al., 2018). The DFE of natural aerosols enhances global GPP by 4.6 %,
Relative to diffuse PAR changes without aerosols, natu- with large changes over the Amazon, central Africa, bo-
ral aerosols dominate aerosol-induced PAR changes by en- real Asia, and North America (Fig. 4c). Meanwhile, anthro-
Atmos. Chem. Phys., 22, 693–709, 2022 https://doi.org/10.5194/acp-22-693-2022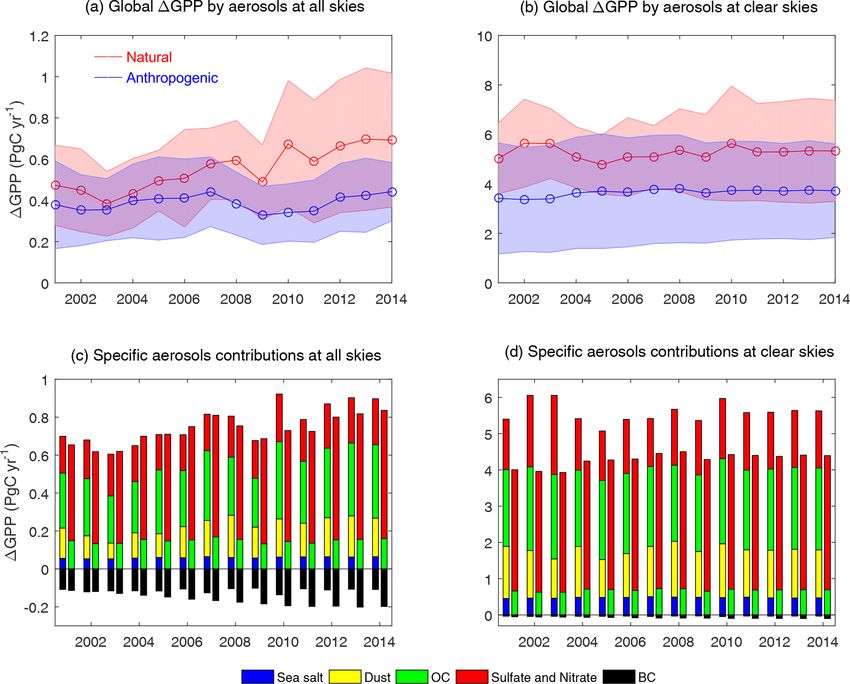
H. Zhou et al.: Distinguishing the impacts of natural and anthropogenic aerosols on global GPP                                        699

Figure 1. Simulated and observed GPP responses to direct and diffuse radiation. The comparisons are performed at 10 FLUXNET sites
where more than 8 years of observations are available. For each site, hourly observations are divided into direct and diffuse conditions if
diffuse fraction is < 0.2 (blue squares) and > 0.8 (red diamonds), respectively. The classified observations are averaged over PAR bins of
40 W m−2 , with error bars indicating 1 standard deviation of GPP for each bin. Similarly, simulations are also divided into direct (green)
and diffuse (yellow) bins of PAR, with gray shading indicating 1 standard deviation. The plant function types include evergreen broadleaf
forest (EBF), evergreen needleleaf forest (ENF), deciduous broadleaf forest (DBF), grassland (Grass), and cropland (Crop). The site name
and vegetation type are listed on the title of each panel.

pogenic aerosols enhance global GPP by 3.2 %, mainly lo-                3.4   DFE by individual aerosol species
cated in the eastern US, Europe, boreal Asia, India, and East
Asia (Fig. 4d).                                                         We isolate the DFE of individual aerosol species on global
   We further quantify the contributions of anthropogenic               GPP (Figs. 5 and S7), and we found that sulfate and ni-
aerosols to the total aerosol DFE. Although cloud masks                 trate aerosols dominate the aerosol DFE on the global scale.
aerosol DFE and significantly reduces GPP enhancement, the              Under all-sky conditions, sulfate and nitrate aerosols av-
contributions of anthropogenic aerosols remain similar be-              eragely enhance GPP by 0.79 Pg C yr−1 , to which anthro-
tween all-sky (Fig. 3b) and clear-sky (Fig. 3d) conditions.             pogenic sources contribute 0.58 Pg C yr−1 (Fig. 5f). OC
Relatively high contributions (> 50 %) are located at low               aerosols increase global GPP by 0.47 Pg C yr−1 , to which
latitudes to mid-latitudes including North America, Europe,             natural sources contribute 0.32 Pg C yr−1 (Fig. 5c). As the
and eastern China. Low contributions (< 50 %) are found at              dominant natural species, dust and sea salt are gener-
other regions such as Africa, South America, and Australia.             ated from non-vegetated areas. They can increase GPP of
On the global scale, anthropogenic aerosols on average con-             downwind land regions by 0.17 Pg C yr−1 (Fig. 5g) and
tribute to 41 % of the total aerosol DFE under all-sky condi-           0.06 Pg C yr−1 (Fig. 5h), respectively. Different from the
tions (Fig. 4a and b). Anthropogenic aerosols dominate DFE              above species, BC aerosols lead to negative impacts on GPP
over 30.5 % of land grids under all-sky conditions, but only            up to −0.28 Pg C yr−1 globally due to the strongly absorbing
19.5 % under clear-sky conditions (Fig. 3b and d). The most             radiative effects. Regionally, such negative effects are promi-
significant differences are located boreal Europe where the             nent over central Africa from biomass burning (Fig. 5a) and
anthropogenic aerosols make dominant contributions to DFE               eastern China from anthropogenic emissions (Fig. 5b).
under clear-sky conditions while the natural species domi-                 Under clear-sky conditions, scattering aerosols show
nate under all-sky conditions.                                          larger DFE compared to the all-sky conditions. Relative to
                                                                        GPP changes without aerosols, sulfate and nitrate aerosols
                                                                        increase global GPP by 5.18 Pg C yr−1 , which is 6.6 times

https://doi.org/10.5194/acp-22-693-2022                                                    Atmos. Chem. Phys., 22, 693–709, 2022
700 H. Zhou et al.: Distinguishing the impacts of natural and anthropogenic aerosols on global GPP Figure 2. Global annual changes of diffuse PAR at the surface by all, natural, and anthropogenic aerosols under all-sky conditions (a–c) and clear skies (d–f). The aerosol species include natural (BC, OC, dust, sea salt, sulfate, and nitrate) and anthropogenic (BC, OC, sulfate, and nitrate) aerosols. The total changes in PAR caused by different aerosol sources are shown on corresponding panels. Changes of diffuse PAR caused by individual aerosol species are shown in Fig. S4. The units are W m−2 . Figure 3. Percentage changes in annual GPP caused by the aerosol diffuse fertilization effect and percentage contributions by anthropogenic aerosols at (a, b) all skies and (c, d) clear skies. The DFE of all aerosols (natural + anthropogenic) are shown on the left, and the contributions by anthropogenic aerosols alone are shown on the right. Atmos. Chem. Phys., 22, 693–709, 2022 https://doi.org/10.5194/acp-22-693-2022
H. Zhou et al.: Distinguishing the impacts of natural and anthropogenic aerosols on global GPP                                     701

Figure 4. Percentage changes in annual GPP by (a, c) natural and (b, d) anthropogenic aerosols under (a, b) all-sky and (c, d) clear-sky
conditions. The total changes in GPP caused by different aerosol sources are shown in corresponding panels. Please notice that the color
scales for natural and anthropogenic aerosols are different. The units are percent.

that under all-sky conditions. The DFE of OC aerosols also            ever, the absolute ratios by BC aerosols significantly reduce
largely increases to 2.89 Pg C yr−1 , in which 2.21 Pg C yr−1         to 1.2 %, because BC-induced DFE is limited while DFE
is from natural sources. Dust and sea salt aerosols lead to           of other species is significantly strengthened under clear-sky
positive impacts on global GPP by 1.32 and 0.48 Pg C yr−1 ,           conditions (Fig. S7).
respectively. In contrast, BC aerosols reduce global GPP                 We further explore the interannual variations in GPP
by 0.12 Pg C yr−1 , much weaker than the magnitude of                 changes caused by aerosol DFE from natural and anthro-
0.28 Pg C yr−1 under all-sky conditions. Such a change                pogenic sources (Fig. 7). Under all-sky conditions, aerosol
mainly follows the larger diffuse absorption by BC aerosols           DFE significantly (p < 0.05) increases by 2.89 % yr−1
under all-sky conditions (0.06 W m−2 ) than that under clear-         (24.6 Tg C yr−2 ) on the global scale (Fig. S8a). Such en-
sky conditions (0.02 W m−2 ).                                         hancement is mainly located in northeastern China, In-
   We then identify the aerosol species making the dominant           dia, central Africa, and Europe (Fig. S9a). Natural aerosols
contributions to the total aerosol DFE (Fig. 6). Under all-           lead to a positive trend of 4.7 % yr−1 in the global GPP
sky conditions, sulfate and nitrate aerosols lead the DFE at          (22 Tg C yr−2 ), which is 6 times of the trend of 0.67 % yr−1
65 % of the grid cells (Fig. 6a) and account for 44.7 % of the        (2.6 Tg C yr−2 ) from anthropogenic aerosols (Fig. 7a). Un-
total absolute GPP changes (Fig. 6c). The secondary con-              der clear-sky conditions, aerosol DFE increases by only
tribution is from OC aerosols, which account for 26.7 % of            0.4 % yr−1 (Fig. S8b), much lower than that under all-sky
the total DFE. Dust and sea salt aerosols contribute to the           conditions (Fig. S8a). Both the DFE trends from natural and
total DFE by 9.5 % and 3.4 %, respectively (Fig. 6c). BC              anthropogenic aerosols are limited (Fig. 7b). The contrast of
aerosols exert negative DFE, the absolute value of which is           DFE trends between different sky conditions is related to the
equivalent to 15.8 % of the total DFE. Regionally, sulfate and        changes of cloud amount, which shows a significant reduc-
nitrate aerosols lead DFE in eastern China, India, the east-          tion trend of 0.38 % yr−1 in 2001–2014 (Fig. S8c), especially
ern US, and Europe, while dust aerosols dominate DFE in               over the Amazon and eastern US (Fig. S9d). The reduction
the Middle East (Fig. 6e and f). Under clear-sky conditions,          of cloud helps increase or maintain aerosol DFE under all-
the percentage contributions of sulfate and nitrate aerosols to       sky conditions (Fig. S9c). The trend of all-sky aerosol DFE
the total DFE further increase to 51.8 % on the global scale          is mainly contributed by dust aerosols from natural sources,
(Fig. 6d). OC, dust, and sea salt aerosols show comparable            which increases by 4.75 % yr−1 from 2001–2014 (Fig. 7c).
contributions to DFE as those under all-sky conditions. How-          The trend of clear-sky aerosol DFE is mainly attributed to

https://doi.org/10.5194/acp-22-693-2022                                                  Atmos. Chem. Phys., 22, 693–709, 2022
702                           H. Zhou et al.: Distinguishing the impacts of natural and anthropogenic aerosols on global GPP

Figure 5. Percentage changes in annual GPP by specific natural and anthropogenic aerosols under all-sky conditions. The global changes
in GPP caused by individual aerosol species (BC, OC, sulfate and nitrate, dust and sea salt aerosols) from different sources (natural and
anthropogenic) are shown in corresponding panels. Please notice that the color scales for different aerosol species are different. The units are
percent.

sulfate and nitrate aerosols, which increase by 0.44 % yr−1               before 2003 (Fig. S11a), but decreased cloud amount en-
from 2001–2014 (Fig. 7d).                                                 hances natural aerosol DFE over the Amazon, central Africa,
   The differences between natural and anthropogenic                      and boreal Asia after 2003 (Fig. S11b). These opposite trends
aerosol DFE are inconsistent at varied sky conditions                     of cloud over regions with a high loading of natural aerosols
(Fig. 7). For the year 2003, 1GPP by natural aerosols is                  lead to a turning point for natural aerosol DFE in 2003 under
very close to that by anthropogenic aerosols under all-sky                all-sky conditions.
conditions (Fig. 7a). However, the same year sees large dif-
ferences of 1GPP between different sources of aerosols in
clear-sky conditions (Fig. 7b). Analyses show that increased
cloud amount weakens aerosol DFE, especially over central
Africa and boreal Asia, with high loading of natural aerosols

Atmos. Chem. Phys., 22, 693–709, 2022                                                          https://doi.org/10.5194/acp-22-693-2022
H. Zhou et al.: Distinguishing the impacts of natural and anthropogenic aerosols on global GPP                                         703

Figure 6. (a, b) Dominant aerosol species contributing to the simulated changes in annual GPP, (c, d) percentage contributions of aerosol
species to global GPP, and (e, f) actual DFE of aerosol species in specific regions under (a, c, e) all skies and (b, d, f) clear skies. The
contributions in (c) and (d) are calculated as the ratios of absolute DFE, as BC aerosols induce negative DFE. The normal (bold) fonts in
(c) and (d) represent aerosol species from natural (anthropogenic) sources. Regions with relatively high percentage changes in GPP (> 1 %
for all-sky and > 5 % for clear sky) by aerosols are shown in (a) and (b). The regions include eastern China (ECH), India (INA), the Middle
East (ME), the eastern US (EUS), and Europe (EUR), which are marked as black boxes in (a) and (b). Black, green, red, yellow, and blue
represent the effects of BC, OC, sulfate and nitrate, dust, and sea salt aerosols, respectively.

4     Discussion                                                        aerosol DFE was limited under cloudy skies. Cloud can mask
                                                                        aerosol DFE by modifying both the quantity and quality of
4.1    Factors influencing aerosol DFE                                  aerosol radiative perturbations (Yu et al., 2006). First, cloud
                                                                        weakens the impacts of aerosols on both direct and diffuse
We quantified the impacts of sky conditions, emission                   radiation (Figs. 2 and S4) by reducing the total sunlight avail-
sources, and aerosol species on terrestrial ecosystem produc-           able for the extinction by aerosols (Kinne, 2019). Therefore,
tivity through aerosol DFE. In our simulations, aerosols in-            the smaller changes in diffuse PAR by aerosols under all-
crease global GPP by 8.91 Pg C yr−1 under clear-sky condi-              sky conditions (Fig. 2) result in lower DFE than those under
tions but only 0.95 Pg C yr−1 under all-sky conditions. Sim-            clear-sky conditions. Second, cloud significantly reduces di-
ilarly, Cohan et al. (2002) and Yue and Unger (2017) found              rect radiation and limits the potential of increasing GPP by

https://doi.org/10.5194/acp-22-693-2022                                                     Atmos. Chem. Phys., 22, 693–709, 2022
704 H. Zhou et al.: Distinguishing the impacts of natural and anthropogenic aerosols on global GPP Figure 7. Interannual variations in GPP changes induced by the DFE of natural and anthropogenic aerosols under (a, c) all skies and (b, d) clear skies from 2001–2014. The left and right bars at each year in (c) and (d) represent the effects of natural and anthropogenic aerosol species, respectively. The hollow circles and shadings in (a) and (b) represent annual mean and standard deviation of aerosol-induced GPP changes from all months in each year. The black, green, red, yellow, and blue bars indicate the effects of BC, OC, sulfate and nitrate, dust, and sea salt aerosols, respectively. diffuse radiation. Observations have shown an optimal dif- Observations have revealed a higher optimal diffuse fraction fuse fraction of 0.4–0.6 to enhance GPP for most plant types at higher latitudes, where the higher solar zenith angle in- (Zhou et al., 2021c). A further increase in diffuse fraction duces a larger fraction of shading leaves (Zhou et al., 2021c). above the optimal range will dampen GPP due to the reduced As a result, the same amount of diffuse radiation increased by photosynthesis of sunlit leaves. Appearance of cloud has pro- anthropogenic aerosols results in higher GPP enhancement vided an environment with a high diffuse fraction in which at the middle latitudes than natural aerosols at low latitudes. aerosols may have limited benefits or even negative effects Furthermore, a dominant fraction of natural aerosols is con- for GPP (Yue and Unger, 2017). Such a relationship also ex- tributed by dust and sea salt, which increase diffuse radiation plains why the decreasing trend of global cloud amount con- over the barren land or open ocean with little forest coverage tributes to an increased aerosol DFE (Fig. 7a). (Fig. 2). In contrast, most anthropogenic aerosols are located Anthropogenic aerosols account for ∼ 25 % of the total in populous regions covered with dense vegetation. Conse- aerosol-induced enhancement of diffuse radiation (Fig. 2), quently, the diffuse radiation by anthropogenic aerosols has while they contribute 41 % to the total aerosol DFE under more interactions with ecosystems than that from natural both all- and clear-sky conditions (Fig. 3). The higher effi- sources. ciency of anthropogenic aerosols in increasing GPP is partly Different aerosol species induce varied DFEs to global associated with their geographic distribution. Regionally, an- GPP. Sulfate and nitrate dominate the aerosol-induced GPP thropogenic aerosols take a leading role in DFE over North changes (Fig. 6) because their strong scattering effects (Gu America, Europe, India, and eastern China, consistent with et al., 2003) largely increase diffuse radiation (Figs. 5 and the estimations by Strada and Unger (2016). On the other S7). Keppel-Aleks and Washenfelder (2016) estimated that hand, natural aerosols dominate DFE in the tropical regions. the regional reductions of sulfate aerosols decreased diffuse Atmos. Chem. Phys., 22, 693–709, 2022 https://doi.org/10.5194/acp-22-693-2022
H. Zhou et al.: Distinguishing the impacts of natural and anthropogenic aerosols on global GPP                             705

radiation by 0.6 % yr−1 and GPP by 0.07 % yr−1 in the east-      used another emission database (EDGAR) to assess the un-
ern US from 1995–2013. Such negative trends of GPP can           certainties of DFE from anthropogenic aerosols. The new
also be found over the same region in our clear-sky simula-      simulations showed that anthropogenic aerosols increased
tions (Fig. S9b). However, the global 1GPP shows limited         global GPP by 0.31 Pg C yr−1 (Figs. S13–S14), lower than
trends under clear-sky conditions (Fig. 7b) because the en-      the value of 0.39 Pg C yr−1 predicted with the CEDS inven-
hanced SO2 emissions in China at the same period (Hoesly         tory (Fig. 3). The spatial pattern of the percentage contribu-
et al., 2018) increased sulfate loading, promoted local GPP      tions remains similar for the two inventories, both of which
(Fig. S9b), and offset the negative 1GPP in the eastern US.      show dominant impacts by anthropogenic aerosols over east-
In our simulations, OC aerosols promote global GPP by            ern China, India, Europe, and North America. For DFE of
0.47 Pg C yr−1 . Such magnitude is much lower than the es-       aerosol species, anthropogenic sulfate and nitrate aerosols
timates of 0.76–1.61 Pg C yr−1 for the same aerosol species      still dominate global aerosol DFE up to 28.2 %, and natu-
by Rap et al. (2018). The main cause of such a discrepancy       ral OC aerosols contribute 18.2 % to aerosol DFE (Fig. S15),
is related to the predicted aerosol concentrations and radia-    which is similar to that from CEDS.
tive effects in two studies (Zhou et al., 2021b). Dust and sea      Third, uncertainties in the radiative transfer may cause bi-
salt aerosols increase regional GPP over arid and coastal re-    ases to aerosol DFE. Although the CRM was fully validated
gions due to the large local emissions (Yue et al., 2010; Yue    with observations (Figs. S2 and S3), simulated aerosol ra-
and Liao, 2012). Under all-sky conditions, dust exerts a large   diative effects showed large differences compared to other
DFE over North Africa and the Middle East (Fig. 3a) because      studies. For example, Chen and Zhuang (2014) found that
of the low cloud coverage (Fig. S10). However, such a high       aerosols increased surface diffuse PAR by 5.2 W m−2 us-
GPP ratio shows limited contributions (Fig. 4) to global total   ing another radiative transfer model. In our simulations,
1GPP because of the extremely low baseline GPP in arid re-       we estimated that aerosols increased diffuse PAR by only
gions. Different from the above species, BC exerts negative      1.26 W m−2 . As a result, the GPP enhancement by aerosol
impacts on direct and diffuse PAR owing to strong absorb-        DFE is 0.95 ± 0.13 Pg C yr−1 in our study, much lower than
ing properties (Kvalevåg and Myhre, 2007). As a result, BC       the value of 4.9 Pg C yr−1 in Chen and Zhuang (2014),
aerosols always decrease GPP with stronger dampening ef-         though the latter study also considered aerosol-induced
fects under all-sky conditions (Fig. 6c and d) when the light    changes in temperature and soil moisture. However, the
availability is much smaller than that under clear-sky condi-    aerosol radiative effects are likely overestimated in Chen
tions.                                                           and Zhuang (2014), which predicted total (direct + diffuse)
                                                                 reductions of 21.9 W m−2 in surface solar radiation by
4.2   Uncertainties
                                                                 aerosols; such magnitude is much higher than the multi-
                                                                 model ensemble estimate of −6.3 W m−2 under clear-sky
Our simulations are subject to limitations and uncertainties.    conditions (Yu et al., 2006). As a comparison, our simula-
First, biases in aerosol profiles may influence the derived      tions showed a reduction of 5.8 W m−2 in surface shortwave
aerosol DFE. We used the chemical transport model GEOS-          radiation, much closer to the ensemble estimates by Yu et
Chem to predict aerosol concentrations and identify con-         al. (2006).
tributions from natural and anthropogenic sources. Evalua-          Fourth, we ignored the interactive effects among different
tions showed that GEOS-Chem underestimated global AOD            aerosol species. Although we isolated the impacts of individ-
by 25.8 %, especially over the Amazon, central Africa, and       ual aerosol species on global GPP, their non-linear influences
boreal Asia (Fig. S1) where natural aerosols dominate. In        still exist in our simulations. For the radiative responses to
contrast, simulated AOD is overestimated in eastern China        aerosol species, we found that total aerosols enhance dif-
where anthropogenic sources dominate. To explore the ef-         fuse PAR by 1.26 W m−2 (Fig. 2) and reduce direct PAR
fects of such underestimation on global aerosol DFE, we          by 2.78 W m−2 (Fig. S4). However, the sum of individual
performed three additional simulations with 1.5, 2, and 3        aerosol effects causes a net enhancement of 1.35 W m−2 in
times the original aerosol concentrations. Predicted aerosol     diffuse PAR (Fig. S5) and a reduction of 2.9 W m−2 in direct
DFE in these three simulations is respectively 1.13, 1.18,       PAR (Fig. S6), both of which are slightly higher than the ef-
and 0.97 Pg C yr−1 (Fig. S12), similar to the estimate of        fects of all aerosols. Similarly, aerosols enhance global GPP
0.95 Pg C yr−1 (Fig. 3a) with the original aerosol concentra-    by 0.95 Pg C yr−1 (Fig. 3) but the sum of individual aerosol
tions. Regionally, aerosols reduce GPP up to −3 % over the       species enhances global GPP by 1.21 Pg C yr−1 (Fig. 5).
Amazon, central Africa, India, eastern China, and Indone-        Such non-linearity is caused by the complicated responses of
sia under double or tripled aerosol conditions, which are re-    individual aerosol species, which can offset each other when
lated to negative effects from high cloud amount (Fig. S11)      they are put together. To facilitate the comparisons, we ex-
or aerosol loading (Fig. S1).                                    plore both the absolute (Fig. 6c and d) and actual (Fig. 6e
   Second, the uncertainties of emission inventories may in-     and f) contributions of individual aerosol species to global
fluence the conclusions. In this study, the CEDS emission        GPP.
inventory is used for anthropogenic emissions. Here, we

https://doi.org/10.5194/acp-22-693-2022                                            Atmos. Chem. Phys., 22, 693–709, 2022
706 H. Zhou et al.: Distinguishing the impacts of natural and anthropogenic aerosols on global GPP
Finally, we neglected the climatic responses to aerosol ra- Supplement. The supplement related to this article is available
diative effects. Surface temperature and relative humidity are online at: https://doi.org/10.5194/acp-22-693-2022-supplement.
altered in response to radiative changes caused by aerosols
(Jing et al., 2010; Cirino et al., 2014). The increase in rela-
tive humidity can increase plant photosynthesis owing to the Author contributions. XuY conceived the study. XuY, HZ, and
enhancement of water use efficiency (Lu et al., 2017; Wang YL designed the research and performed simulations. HZ com-
et al., 2021), but the impacts of cooling on photosynthesis pleted data analysis and the first draft. XuY reviewed and edited
the manuscript. CT, JZ, YM, YC, XiY, and ZZ were responsible for
are dependent on whether local background temperature is
data collection processes.
over the optimal temperature (Farquhar et al., 1980). In our
previous studies, we explored the direct aerosol radiative ef-
fects on NPP in China through changes in radiation, tem- Competing interests. The contact author has declared that nei-
perature, and soil moisture, and we found that aerosol DFE ther they nor their co-authors have any competing interests.
enhances regional NPP by 0.09 Pg C yr−1 , which accounts
for ∼ 50 % of the total aerosol effects (Yue et al., 2017b).
Similarly, Zhang et al. (2021) explored the impacts of an- Disclaimer. Publisher’s note: Copernicus Publications remains
thropogenic aerosols on global carbon sink from 1850–2014 neutral with regard to jurisdictional claims in published maps and
and found that aerosol DFE accounts for 78 % of the total institutional affiliations.
aerosol effects on carbon uptake, which is much higher than
the effects caused by temperature and precipitation changes.
Moreover, the changes in clouds from aerosol indirect ef- Acknowledgements. The authors thank the reviewers for their
fects were not considered in this study. Clouds can signifi- constructive comments and thoughtful suggestions, and all data or
cantly influence aerosol DFE because of its strong scattering model codes used in this study are available via websites in the
effects (Fig. 3). The perturbations in clouds can further influ- Methods section.
ence surface temperature, precipitation, and radiation (Zhu
et al., 2019), leading to more complex impacts on terrestrial
ecosystem productivity. However, these interactive effects by Financial support. This research has been supported by the Na-
tional Key Research and Development Program of China (grant
aerosols need to be resolved using Earth system models that
no. 2019YFA0606802) and Jiangsu Science Fund for Distinguished
implement fully coupled atmospheric chemistry, radiation,
Young Scholars (grant no. BK20200040).
land biosphere, and climate feedbacks.
Review statement. This paper was edited by Do-
4.3 Implications minick Spracklen and reviewed by two anonymous referees.
Our study reveals that aerosol DFE can enhance global GPP
by 0.95 Pg C yr−1 under all-sky conditions and as much as
References
8.91 Pg C yr−1 under clear-sky conditions. The natural and
anthropogenic aerosols make comparable contributions glob- Alton, P. B.: Reduced carbon sequestration in terres-
ally but with distinct spatial patterns. The DFE, as well as the trial ecosystems under overcast skies compared to
climatic effects, suggests that aerosols play important roles clear skies, Agric. Forest Meteorol., 148, 1641–1653,
in mitigating global warming through direct (cooling) and https://doi.org/10.1016/j.agrformet.2008.05.014, 2008.
indirect (more carbon assimilation) processes. Although the Alton, P. B., North, P. R., and Los, S. O.: The impact of diffuse sun-
reductions of aerosols may weaken the DFE, the associated light on canopy light-use efficiency, gross photosynthetic prod-
reductions of cloud amount due to reduced aerosol–cloud in- uct and net ecosystem exchange in three forest biomes, Global
teractions may induce more benefits to ecosystems. Further- Change Biol., 13, 776–787, https://doi.org/10.1111/j.1365-
2486.2007.01316.x, 2007.
more, reductions of black carbon aerosols help relieve both
Ball, J. T., Woodrow, I. E., and Berry, J. A.: A Model Predict-
climate warming and GPP inhibitions. Our results suggest ing Stomatal Conductance and its Contribution to the Control
that aerosol DFE should be considered in projecting future of Photosynthesis under Different Environmental Conditions, in:
changes in terrestrial ecosystem productivity, especially for Progress in Photosynthesis Research: Volume 4 Proceedings of
different emission scenarios. the VIIth International Congress on Photosynthesis Providence,
Rhode Island, USA, 10–15 August 1986, edited by: Biggins, J.,
Springer Netherlands, Dordrecht, 221–224, 1987.
Data availability. The simulated GPP and diffuse PAR caused by Bey, I., Jacob, D. J., Yantosca, R. M., Logan, J. A., Field,
natural and anthropogenic aerosols in this paper are publicly avail- B. D., Fiore, A. M., Li, Q. B., Liu, H. G. Y., Mickley,
able via Zenodo (https://doi.org/10.5281/zenodo.5115314; Zhou L. J., and Schultz, M. G.: Global modeling of tropospheric
and Yue, 2021). chemistry with assimilated meteorology: Model description
Atmos. Chem. Phys., 22, 693–709, 2022 https://doi.org/10.5194/acp-22-693-2022H. Zhou et al.: Distinguishing the impacts of natural and anthropogenic aerosols on global GPP 707 and evaluation, J. Geophys. Res.-Atmos., 106, 23073–23095, ter, B., Resplandy, L., Robertson, E., Rödenbeck, C., Schwinger, https://doi.org/10.1029/2001jd000807, 2001. J., Séférian, R., Skjelvan, I., Smith, A. J. P., Sutton, A. J., Tan- Breider, T. J., Mickley, L. J., Jacob, D. J., Ge, C., Wang, J., Payer hua, T., Tans, P. P., Tian, H., Tilbrook, B., van der Werf, G., Sulprizio, M., Croft, B., Ridley, D. A., McConnell, J. R., Sharma, Vuichard, N., Walker, A. P., Wanninkhof, R., Watson, A. J., S., Husain, L., Dutkiewicz, V. A., Eleftheriadis, K., Skov, H., Willis, D., Wiltshire, A. J., Yuan, W., Yue, X., and Zaehle, S.: and Hopke, P. K.: Multidecadal trends in aerosol radiative forc- Global Carbon Budget 2020, Earth Syst. Sci. Data, 12, 3269– ing over the Arctic: Contribution of changes in anthropogenic 3340, https://doi.org/10.5194/essd-12-3269-2020, 2020. aerosol to Arctic warming since 1980, J. Geophys. Res.-Atmos., Giorgi, F., Coppola, E., Solmon, F., Mariotti, L., Sylla, M. B., Bi, 122, 3573–3594, https://doi.org/10.1002/2016JD025321, 2017. X., Elguindi, N., Diro, G. T., Nair, V., Giuliani, G., Turuncoglu, Chen, M. and Zhuang, Q.: Evaluating aerosol direct ra- U. U., Cozzini, S., Guttler, I., O’Brien, T. A., Tawfik, A. B., Sha- diative effects on global terrestrial ecosystem carbon laby, A., Zakey, A. S., Steiner, A. L., Stordal, F., Sloan, L. C., dynamics from 2003 to 2010, Tellus B, 66, 21808, and Brankovic, C.: RegCM4: model description and preliminary https://doi.org/10.3402/tellusb.v66.21808, 2014. tests over multiple CORDEX domains, Climate Res., 52, 7–29, Cirino, G. G., Souza, R. A. F., Adams, D. K., and Artaxo, P.: The ef- https://doi.org/10.3354/cr01018, 2012. fect of atmospheric aerosol particles and clouds on net ecosystem Gu, L. H., Baldocchi, D., Verma, S. B., Black, T. A., Vesala, T., exchange in the Amazon, Atmos. Chem. Phys., 14, 6523–6543, Falge, E. M., and Dowty, P. R.: Advantages of diffuse radiation https://doi.org/10.5194/acp-14-6523-2014, 2014. for terrestrial ecosystem productivity, J. Geophys. Res.-Atmos., Cohan, D. S., Xu, J., Greenwald, R., Bergin, M. H., and Chameides, 107, 4050, https://doi.org/10.1029/2001jd001242, 2002. W. L.: Impact of atmospheric aerosol light scattering and absorp- Gu, L. H., Baldocchi, D. D., Wofsy, S. C., Munger, J. W., tion on terrestrial net primary productivity, Global Biogeochem. Michalsky, J. J., Urbanski, S. P., and Boden, T. A.: Re- Cycles, 16, 1090, https://doi.org/10.1029/2001gb001441, 2002. sponse of a deciduous forest to the Mount Pinatubo erup- Doughty, C. E., Flanner, M. G., and Goulden, M. L.: Ef- tion: Enhanced photosynthesis, Science, 299, 2035–2038, fect of smoke on subcanopy shaded light, canopy tem- https://doi.org/10.1126/science.1078366, 2003. perature, and carbon dioxide uptake in an Amazon Guenther, A. B., Jiang, X., Heald, C. L., Sakulyanontvittaya, rainforest, Global Biogeochem. Cycles, 24, GB3015, T., Duhl, T., Emmons, L. K., and Wang, X.: The Model of https://doi.org/10.1029/2009gb003670, 2010. Emissions of Gases and Aerosols from Nature version 2.1 Ezhova, E., Ylivinkka, I., Kuusk, J., Komsaare, K., Vana, M., Kras- (MEGAN2.1): an extended and updated framework for mod- nova, A., Noe, S., Arshinov, M., Belan, B., Park, S.-B., Lavrič, eling biogenic emissions, Geosci. Model Dev., 5, 1471–1492, J. V., Heimann, M., Petäjä, T., Vesala, T., Mammarella, I., Ko- https://doi.org/10.5194/gmd-5-1471-2012, 2012. lari, P., Bäck, J., Rannik, Ü., Kerminen, V.-M., and Kulmala, He, M. Z., Ju, W. M., Zhou, Y. L., Chen, J. M., He, H. L., M.: Direct effect of aerosols on solar radiation and gross pri- Wang, S. Q., Wang, H. M., Guan, D. X., Yan, J. H., Li, Y. N., mary production in boreal and hemiboreal forests, Atmos. Chem. Hao, Y. B., and Zhao, F. H.: Development of a two-leaf light Phys., 18, 17863–17881, https://doi.org/10.5194/acp-18-17863- use efficiency model for improving the calculation of terrestrial 2018, 2018. gross primary productivity, Agric. Forest Meteorol., 173, 28–39, Farquhar, G. D., Caemmerer, S. V., and Berry, J. A.: A biochemical- https://doi.org/10.1016/j.agrformet.2013.01.003, 2013. model of photosynthetic CO2 assimilation in leaves of C-3 Hemes, K. S., Verfaillie, J., and Baldocchi, D. D.: Wildfire- species, Planta, 149, 78–90, https://doi.org/10.1007/bf00386231, Smoke Aerosols Lead to Increased Light Use Efficiency 1980. Among Agricultural and Restored Wetland Land Uses in Cal- Fisher, J. A., Jacob, D. J., Wang, Q., Bahreini, R., Carouge, ifornia’s Central Valley, J. Geophys. Res.-Biogeo., 125, 21, C. C., Cubison, M. J., Dibb, J. E., Diehl, T., Jimenez, https://doi.org/10.1029/2019jg005380, 2020. J. L., Leibensperger, E. M., Lu, Z., Meinders, M. B. J., Hoesly, R. M., Smith, S. J., Feng, L., Klimont, Z., Janssens- Pye, H. O. T., Quinn, P. K., Sharma, S., Streets, D. G., Maenhout, G., Pitkanen, T., Seibert, J. J., Vu, L., Andres, R. van Donkelaar, A., and Yantosca, R. M.: Sources, distri- J., Bolt, R. M., Bond, T. C., Dawidowski, L., Kholod, N., bution, and acidity of sulfate–ammonium aerosol in the Kurokawa, J.-I., Li, M., Liu, L., Lu, Z., Moura, M. C. P., Arctic in winter–spring, Atmos. Environ., 45, 7301–7318, O’Rourke, P. R., and Zhang, Q.: Historical (1750–2014) anthro- https://doi.org/10.1016/j.atmosenv.2011.08.030, 2011. pogenic emissions of reactive gases and aerosols from the Com- Friedlingstein, P., O’Sullivan, M., Jones, M. W., Andrew, R. M., munity Emissions Data System (CEDS), Geosci. Model Dev., 11, Hauck, J., Olsen, A., Peters, G. P., Peters, W., Pongratz, J., Sitch, 369–408, https://doi.org/10.5194/gmd-11-369-2018, 2018. S., Le Quéré, C., Canadell, J. G., Ciais, P., Jackson, R. B., Alin, Jaeglé, L., Quinn, P. K., Bates, T. S., Alexander, B., and Lin, J.-T.: S., Aragão, L. E. O. C., Arneth, A., Arora, V., Bates, N. R., Global distribution of sea salt aerosols: new constraints from in Becker, M., Benoit-Cattin, A., Bittig, H. C., Bopp, L., Bultan, situ and remote sensing observations, Atmos. Chem. Phys., 11, S., Chandra, N., Chevallier, F., Chini, L. P., Evans, W., Florentie, 3137–3157, https://doi.org/10.5194/acp-11-3137-2011, 2011. L., Forster, P. M., Gasser, T., Gehlen, M., Gilfillan, D., Gkritza- Jing, X., Huang, J., Wang, G., Higuchi, K., Bi, J., Sun, Y., lis, T., Gregor, L., Gruber, N., Harris, I., Hartung, K., Haverd, V., Yu, H., and Wang, T.: The effects of clouds and aerosols on Houghton, R. A., Ilyina, T., Jain, A. K., Joetzjer, E., Kadono, K., net ecosystem CO2 exchange over semi-arid Loess Plateau Kato, E., Kitidis, V., Korsbakken, J. I., Landschützer, P., Lefèvre, of Northwest China, Atmos. Chem. Phys., 10, 8205–8218, N., Lenton, A., Lienert, S., Liu, Z., Lombardozzi, D., Marland, https://doi.org/10.5194/acp-10-8205-2010, 2010. G., Metzl, N., Munro, D. R., Nabel, J. E. M. S., Nakaoka, S.-I., Kanniah, K. D., Beringer, J., and Hurley, L.: Exploring the Niwa, Y., O’Brien, K., Ono, T., Palmer, P. I., Pierrot, D., Poul- link between clouds, radiation, and canopy productivity of https://doi.org/10.5194/acp-22-693-2022 Atmos. Chem. Phys., 22, 693–709, 2022
You can also read