Economic Case Study of Intensive Mango Systems
←
→
Page content transcription
If your browser does not render page correctly, please read the page content below
Economic Case
Study of Intensive
Mango Systems
A comparison of the profitability of
conventional (low, medium & high density)
and trellis (high density) mango canopy
systems in north Queensland based on early
trial results
D. Bennett & G. Dickinson
Department of Agriculture & Fisheries, Mareeba

Acknowledgements
This research funded by the CRC for Developing Northern Australia (CRCNA) is supported by the Cooperative Research
Centres Program, an Australian Government initiative. The CRCNA also acknowledges the support of its investment
partners: The Western Australian, Northern Territory and Queensland Governments.
This report is an outcome of the CRCNA project ‘Transforming Mango Futures’ (2018-2021) a collaboration between the
Department of Agriculture and Fisheries, Queensland (DAF), Manbulloo Ltd, Martos’ Mangoes and the Australian Mango
Industry Association (AMIA). The majority of management, growth and yield data used to develop this case study was
sourced from the large Planting Systems Trial at the DAF Walkamin Research Facility, established in 2013. This trial was
funded via the ‘Transforming subtropical and tropical tree productivity’ project (2013-2020), a collaboration between Hort
Innovation using the across industry R&D levy and co-investment from DAF, the Queensland Alliance for Agriculture and
Food Innovation and funds from the Australian government.

Additional information on management inputs, costs, projected yields and prices was provided by the four project partners,
mango growers, industry stakeholders and from published reports. We would also like to thank the businesses, Blue Sky
Produce, Blushing Acres, Tableland Fertilisers and Leonie Wittenberg Crop Monitoring for their assistance.
Many thanks also to our DAF colleagues Ian Bally, Paula Ibell, Stef De Faveri, James Drinnan, Ebony Faichney, Zac
Scobell, Kathy Grice, Mahmud Kare and Carole Wright for their contributions to this report including provision of data,
analysis of results and review of the final document. We would particularly like to thank Fred Chudleigh, Economist, DAF,
for his valuable assistance with the economic case study and training in the use of the DAF Economic Calculator.

Disclaimer
Any opinions expressed in this document are those of the authors. They do not purport to reflect the opinions or views of
the CRCNA or its partners, agents or employees.
The CRCNA gives no warranty or assurance and makes no representation as to the accuracy or reliability of any
information or advice contained in this document, or that it is suitable for any intended use. The CRCNA, its partners,
agents and employees, disclaim any and all liability for any errors or omissions or in respect of anything or the
consequences of anything done or omitted to be done in reliance upon the whole or any part of this document.

This work is licensed under a CC BY 4.0 license.
ISBN 978-1-922437-23-5

                                                            1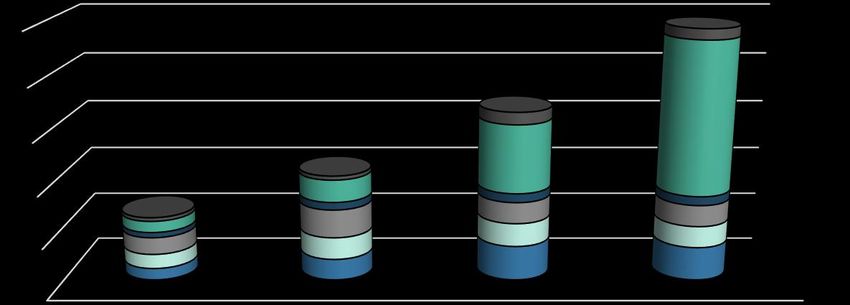
Table of contents
Acknowledgments................................................................................................................................Error! Bookmark not defined.
Table of contents .................................................................................................................................................................................. 1
Summary ................................................................................................................................................................................................ 4
Introduction ............................................................................................................................................................................................ 6
Methodology .......................................................................................................................................................................................... 7
      Economic spreadsheet tool and data sources ........................................................................................................................... 7
      Canopy system treatments............................................................................................................................................................ 7
      Whole-of-farm assumptions .......................................................................................................................................................... 7
      Modelling canopy size over orchard lifetime ............................................................................................................................... 8
      Revenue calculations .....................................................................................................................................................................9
      Establishment costs calculations ................................................................................................................................................ 10
      Variable production costs calculations ...................................................................................................................................... 10
            Nutrition.................................................................................................................................................................................... 10
            Pest, disease and weed management ................................................................................................................................ 11
            Irrigation management ........................................................................................................................................................... 12
Results.................................................................................................................................................................................................. 13
      Establishment costs ..................................................................................................................................................................... 13
      Variable production costs ............................................................................................................................................................ 14
            Nutrition.................................................................................................................................................................................... 14
            Insect management costs ..................................................................................................................................................... 15
            Disease management costs.................................................................................................................................................. 15
            Chemical use efficiency ......................................................................................................................................................... 16
            Weed management costs...................................................................................................................................................... 16
            Irrigation costs......................................................................................................................................................................... 17
            Pruning, training, bending costs ........................................................................................................................................... 18
            Picking costs ........................................................................................................................................................................... 18
            Packing costs .......................................................................................................................................................................... 19
      Total Variable Costs ..................................................................................................................................................................... 20
      Income............................................................................................................................................................................................ 22
            Yield and Saleable Fruit ........................................................................................................................................................ 22
            Gross Revenue ....................................................................................................................................................................... 22
Profitability comparison ...................................................................................................................................................................... 24
      Gross Margin ................................................................................................................................................................................. 24
      Cumulative Nett Cash Flow......................................................................................................................................................... 24
References .......................................................................................................................................................................................... 26
Appendix 1 ........................................................................................................................................................................................... 27
Appendix 2 ........................................................................................................................................................................................... 28

                                                                                                     1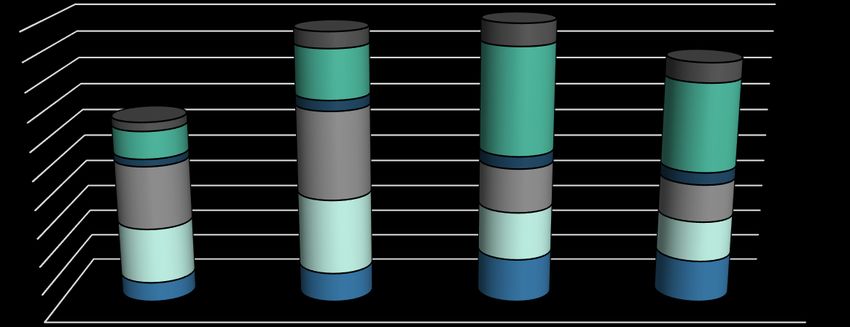
List of Tables
Table 1 Annual yields and gross margin .......................................................................................................................................... 5
Table 2 Key parameters and assumptions ....................................................................................................................................... 7
Table 3 Total field yield per tree (kg) and per hectare (tonnes) for each of the planting systems ......................................... 10
Table 4 Annual nutrient replacement .............................................................................................................................................. 11
Table 5 Spray program ..................................................................................................................................................................... 12
Table 6 Estimated irrigation rates .................................................................................................................................................... 12
Table 7 Establishment costs ............................................................................................................................................................ 13
Table 8 Costs of materials and labour for one hectare of trellis infrastructure .......................................................................... 14
Table 9 Chemical use efficiency ...................................................................................................................................................... 16

List of Figures
Figure 1. Maximum canopy volume per hectare ............................................................................................................................. 8
Figure 2. Maximum canopy surface area per hectare .................................................................................................................... 9
Figure 3. Establishment costs for each planting system .............................................................................................................. 13
Figure 4. Nutrition costs .................................................................................................................................................................... 14
Figure 5. Insect management costs ................................................................................................................................................ 15
Figure 6. Disease management costs ............................................................................................................................................ 16
Figure 7. Weed management costs ................................................................................................................................................ 17
Figure 8. Irrigation costs ................................................................................................................................................................... 17
Figure 9. Pruning, training, bending and hedging costs .............................................................................................................. 18
Figure 10. Picking costs .................................................................................................................................................................... 19
Figure 11. Packing costs .................................................................................................................................................................. 19
Figure 12. Composition of pre-harvest variable costs at year 5. ................................................................................................. 20
Figure 13. Composition of post-harvest variable costs at year 5. ............................................................................................... 20
Figure 14. Composition of pre-harvest variable costs at year 12................................................................................................ 21
Figure 15. Composition of post-harvest variable costs at year 12. ............................................................................................. 21
Figure 16. Estimated saleable fruit .................................................................................................................................................. 22
Figure 17. Gross revenue over mango tree life cycle ................................................................................................................... 23
Figure 18. Establishment costs and annual gross margin ........................................................................................................... 24
Figure 19. Cumulative nett cash flow .............................................................................................................................................. 25

                                                                                               2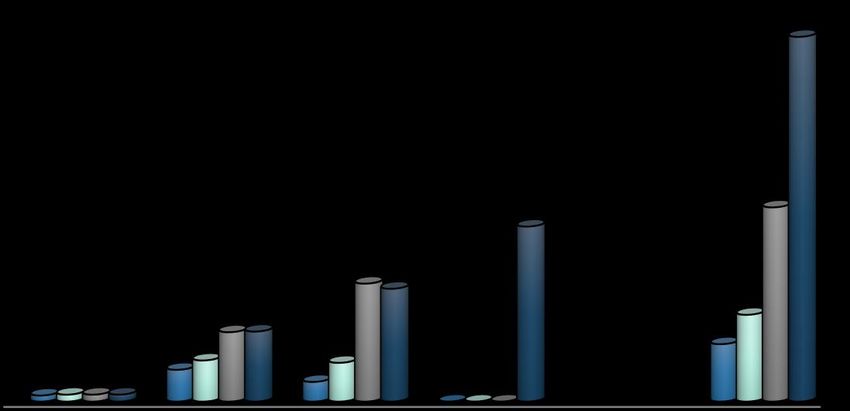
Acronyms
 AMIA      Australian Mango Industry Association

 APAL      Apple and Pear Australia Ltd

 CCA       Copper chrome arsenate (CCA) treated timber is wood that has been treated with a preservative
           containing copper, chromium, and arsenic

 CRCNA     Cooperative Research Centre for Developing Northern Australia

 DAF       Department of Agriculture & Fisheries (Qld)

 FORM      Fuel, oil, repairs, maintenance

 IRR       Internal Rate of Return

 KP        Kensington Pride mango variety

 ML        Megalitre

 NMBP      National Mango Breeding Program

 NPV       Net Present Value

 PST       Planting Systems Trial

 WRS       Walkamin Research Station

Project Partners

                                                         3
Summary
This economic case study compares discrete farm level investments in conventional low, medium and high density canopy
systems and a trellis high density canopy system for mango production in north Queensland. A key priority for the Australian
mango industry is to increase industry productivity through increased yields and reduced input costs. The adoption of high
density orchard systems by other tree crops has successfully improved the profitability of these industries and there is
potential for these systems to also improve profitability of the mango industry. Early results from the six-year old
Department of Agriculture and Fisheries (DAF) mango Planting Systems Trial (PST) at Walkamin have supported this
concept, with higher density planting systems producing higher yields per hectare sooner and with higher input efficiencies
than conventional planting systems.
This case study aims to determine whether the extra investment required to implement medium or high density mango
orchards is likely to return a higher gross margin, compared to conventional low density orchards, using the B74 (Calypso®)
variety. Data were sourced from the DAF Planting Systems Trial at Walkamin, researchers, growers, agribusinesses and
industry stakeholders. Profitability was assessed using gross margin. Three key outcomes were identified.
The first key outcome was the calculation of establishment costs/hectare for the four canopy systems. These costs/hectare
increased with increased planting density and with additional trellis infrastructure as follows; conventional low density
($10,491), conventional medium density ($15,853), conventional high density ($35,487) and trellis high density ($66,647).
The establishment costs incorporated land preparation (boom spraying, slashing, cultivation/ripping, levelling), irrigation
(pipes, sprinklers, connectors, materials, installation labour, proportion of pump and pump shed costs), planting (cost of
trees, pre-plant lime application and planting labour) and trellis infrastructure (materials and installation).
The second key outcome was that higher density orchards, achieve much higher annual gross margins/hectare (difference
between annual gross revenue and annual variable costs) than lower density orchards. (Note: the gross margin did not
include capital expenditure or fixed costs). These higher annual gross margins/hectare were clearly evident at age 6 years
based on the most recent data from the DAF Planting Systems Trial with results as follows; conventional low density
($15,560), conventional medium density ($34,205), conventional high density ($85,305) and trellis high density ($55,128).
These results were then modelled to estimate annual gross margins/hectare when orchards had reached their maximum
steady-state canopy size from age 11 years onwards. These figures were even more pronounced for the high density
systems at the maximum canopy size, with results as follows; conventional low density ($21,138), conventional medium
density ($42,738), conventional high density ($92,068) and trellis high density ($108,514).
A key driver of this increased profitability for the high density systems, is the proportionally higher and earlier fruit yields
per hectare that have been achieved with increasing intensification. Estimated fruit yields/hectare/year at maximum canopy
size were; conventional low (18.2 t), conventional medium (32.6 t), conventional high (58.7 t) and trellis high (65.9 t). Fruit
quality was not influenced by canopy system design, based on the early results from the Planting Systems Trial. A summary
of annual yields and gross margin/hectare for the four canopy systems at full production is presented in Table 1.
The third key outcome was that the cumulative nett cash flow/hectare (the accumulation of annual gross margin/hectare
each year) became positive across all four systems at a relatively young age (4 years for conventional high density, 5
years for conventional low and medium density and 6 years for trellis high density), but then rapidly accelerated in the
systems with increased planting density and intensification. Cumulative nett cash flow/hectare by age 11 years was
calculated as; conventional low density ($120,000), conventional medium density ($254,000), conventional high density
($617,000) and trellis high density ($495,000).
The adoption of higher density planting densities requires a higher level of investment during establishment and the first
10 years; however these are rapidly recouped by the higher revenues achieved by increased yield per hectare. Additional
benefits of high density systems also include improved cyclone resilience, spray efficiency and greater application for new
technologies such as automation and robotic harvesting.
Cautionary Note: The findings of this report rely greatly on the modelling estimates calculated from the early results (0-6
years) of the DAF Planting Systems Trial at Walkamin. It is possible that as these orchard canopy systems mature over
time, future yields may respond differently than has been predicted by this modelling. It is recommended that this
economics case study is updated as new data becomes available. Growers considering transitioning all or part of their
farm to a higher density planting system or developing a new farm at increased density should consider all factors specific
to their situation before progressing.
4Table 1. Annual yields and gross margin ($/ha) calculated at full production
Conventional Conventional Conventional Trellis high
Item Assumptions low density medium density high density density
207 trees/ha 408 trees/ha 1,242 trees/ha 1,188 trees/ha
Yield
Total yield (Tonnes/ha) Total tree yield 18.2 32.6 58.8 65.9
Harvested yield - HY (Tonnes/ha) 5% fruit left in paddock 17.3 31.0 55.9 62.6
Income ($/ha)
Premium $4.00/kg @ 77% of HY 53,300 95,505 171,893 192,958
Class 1 $2.00/kg @ 14% of HY 4,845 8,682 15,627 17,541
Class 2 $1.57/kg @ 4% of HY 1,087 1,947 3,505 3,934
Juice/processing $0.50/kg @ 4% of HY 346 620 1,116 1,253
Reject $0.00/kg @ 1% of HY 0 0 0 0
Total income ($/ha) 59,578 106,754 192,141 215,686
Variable costs ($/ha)
Nutrition 1,410 2,106 3,132 3,016
Pest management 3,984 5,415 3,478 2,913
Disease management 4,560 6,366 3,179 2,706
Weed management 526 754 876 876
Irrigation 634 1,161 1,576 1,404
Canopy management 1,990 3,587 7,706 6,346
Harvesting 2,933 4,694 8,449 9,485
Packing 11,726 20,806 37,245 41,782
Freight to market 4,391 7,867 14,160 15,895
Commissions & Levies 6,283 11,259 20,272 22,747
Total variable costs ($/ha) 38,437 64,015 100,073 107,170
GROSS MARGIN (Total income – Total variable costs) 21,138 42,738 92,068 108,514
5Introduction
Maintaining profitability in an environment of increasing costs is a key challenge facing the Australian mango industry. Low
and variable production continues to hamper competitiveness and has impacted on the expansion of exports. A key priority
for the Australian mango industry is to increase industry productivity per hectare through increased yields and reduced
costs (Hort Innovation, 2017). Production volumes average around 65,000 tonnes annually, the industry aspires to increase
annual production to over 82,000 tonnes by 2022 (Hort Innovation, 2017, 2020). To achieve these targets, improved
productivity is essential, however this is challenging with conventional planting densities of less than 300 trees per hectare.
Opportunities exist to improve productivity through intensification.
An intensification program within the apple and pear industry (Future Orchards®) initiated in 2006, has substantially
increased industry average production from 10-20 up to 35-55 tonnes/ha, with some orchards achieving over 100
tonnes/ha (Crawford, 2016; APAL, 2019). This success has been achieved through the adoption of new canopy systems
including trellising and non-trellis designs, which incorporate smaller trees, grown at higher densities, with narrow, more
open canopies. These systems increase canopy surface area per hectare and improve light interception and light
distribution, which in turn results in improved productivity.
In response to these national orchard system trends, the Queensland Department of Agriculture and Fisheries (DAF)
commenced the Small Tree High Productivity Initiative in 2012. This initiative aims to help transform tropical and sub-
tropical fruits from low-yielding, low density orchards into high yielding high density orchard systems. Under this initiative
and with funding support from Hort Innovation using the cross-industry R&D levy, a large, replicated, planting systems trial
(PST) was established at the DAF Walkamin Research Facility in 2013, incorporating three mango varieties grown at a
range of planting densities using conventional and trellis methods. Early results from this trial have been very promising,
and suggest mangoes have high potential for improved productivity when grown in higher density systems (Bally et al.,
2020).
One of the main challenges posed by intensifying mango trees is vigour control (Bally and Ibell, 2015; Menzel & Le
Lagadec, 2017). Most mango varieties grown in Australia are vigorous (particularly Kensington Pride) and if left unmanaged
can easily grow to heights in excess of 10m. The use of trellising and/or intensive branch training and pruning methods,
has been successfully used as a tool by the apple and pear industry to manage vigour (Crawford, 2016). These methods
may also enable mango orchards to be grown at higher densities and significantly improve productivity. Other expected
advantages of smaller trees grown at higher densities include; more efficient harvesting, better adaptation to mechanisation
and robotics, greater efficiency of pest and disease management (Bally and Ibell, 2015; Bally et al., 2020; Fealy, 2017;
Menzel & Le Lagadec, 2017) and greater cyclone resilience (Drinnan et al. 2018).
The Australian mango industry has experienced a slow shift towards increased planting density over the past 20 years.
Semi-dwarf varieties such as Calypso® and Keitt, have been commercially planted at densities up to 357 trees/ha and
R2E2 up to 555 trees/ha. A study by Drinnan et al. (2018) found that mangoes grown at Mareeba under a high-density
trellis system (666 trees/ha) also showed good applicability to this system.
Adopting a new orchard management system poses numerous risks, but of chief concern among growers are the economic
implications of this decision. High density systems, particularly trellis systems require significant upfront investment in
infrastructure and need additional labour for pruning and training. In new systems, these costs are challenging for growers
to accurately estimate, making it difficult to make informed decisions about moving to higher density designs.
This report is a case study of a range of intensive mango systems that will assist growers when establishing new mango
plantings to choose which orchard management design is most suitable to them. Study data was sourced from the DAF
Planting System Trial (PST), the Australian mango industry, growers, industry stakeholders and published reports. The
case study compares conventional mango planting systems at three different densities - low (207 trees/ha), medium (408
trees/ha) and high (1,242 trees/ha) and one trellised planting system at high density (1,188 trees/ha). The mango variety
B74 (Calypso®) has been selected as the focus variety for this study.
6Methodology
Economic spreadsheet tool and data sources
The economic analyses were conducted using an economics calculator file developed in Microsoft Excel by Fred
Chudleigh, DAF Economist. This DAF calculator tool was first developed in the 1990s and has been updated and adapted
regularly to conduct economic studies for a wide range of agricultural applications. The economics calculator file includes
multiple linked spreadsheets. These included individual input base costs (materials, labour, FORM etc), a calculator sheet
where establishment and annual variable costs were calculated based on assumed best-bet practices for each canopy
system, and gross revenue based on fruit yields, quality grades and price per grade for each year up to an orchard lifetime
of 30 years. This 30 year lifetime is equivalent to the approximate economic and investment life of many similar orchard
investments. These data were then used to calculate gross margin and cumulative nett cash flow per hectare for each
orchard management system over the orchard lifetime.
The expenditure and revenue figures produced within this case study were calculated from many different sources. Input
costs of materials, machinery and labour and recommended work/application rates (at 2020 dollar values) were collected
from; existing DAF economic records, the Planting Systems Trial, the Australian Mango Industry Association, mango
growers, private agricultural consultants and published reports. Data on fruit yields and quality, canopy surface area and
canopy volume per hectare for each of the four canopy systems were collected from the Planting System Trial to age 6
years. These data were then modelled to estimate expenditure and revenue figures from age 6 years onwards, based on
the assumption that fruit yields per hectare and most input costs would continue to increase proportionally with increase in
canopy size, until each canopy system grew to its maximum target dimensions. Once this target size was reached (between
10 to 11 years for the four systems), expenditure and revenue figures were assumed to remain constant.
Canopy system treatments
Four canopy management systems were investigated in this study. The tree and row configuration within these four orchard
management systems was based on a subset of those used within the DAF Planting Systems Trial at the Walkamin
Research Facility (WRS), established in 2013 (Bally et al., 2020). The inter- and intra-row tree spacings used were
conventional low (8 x 6 m = 207 trees/ha), medium (6 x 4 m = 408 trees/ha) and high (4 x 2 m = 1,242 trees/ha) density
and one trellised system at high density (4 x 2 m = 1,188 trees/ha).
The tree number/ha for each system was calculated by the number of trees which could be placed into a ‘standard’ 1
hectare block (72 m wide x 139 m long) which could practically fit these inter- and intra-row spacings. The trellis system
also required additional space within the ‘standard’ 1 hectare block for the establishment of tie-down anchors for the trellis
system, resulting in a small reduction in tree number/ha. The DAF Planting Systems Trial included three mango varieties;
B74 (Calypso®), Keitt and NMBP1243. The variety B74 (Calypso®) was chosen as the subject for this case study.
Table 2. Key parameters and assumptions used in the economic case study
Variety B74 (Calypso®)
Productive life of trees 30 years
Tree Inter-row
Orchard layout Trees/ha spacing spacing Rows/ha Trees/row
(m) (m)
Conventional low density 207 6 8 9 23
Conventional medium density 408 4 6 12 34
Conventional high density 1,242 2 4 18 69
Trellis high density 1,188 2 4 18 66
Whole-of-farm assumptions
The establishment figures include all costs required to establish the orchard blocks to the stage of tree planting and orchard
infrastructure construction. These costs include: Land preparation, irrigation materials and establishment, pre-plant
fertiliser and chemical application, trees, trellis materials and construction, labour, and machinery costs (e.g. FORM – fuel,
oil, repairs, maintenance). Production costs then accrue over the orchard lifetime. Variable costs (those costs that vary
with the level of production) in this case study include weed, insect and disease control, fertiliser, irrigation, training, pruning
7and thinning, picking and packing, freight to market, marketing and levy costs, labour and machinery costs. The machinery
operation costs were calculated using tractor size, FORM and work rate. Labour was also included in the costs for each
farm operation and was calculated using the work rate multiplied by an hourly rate of $27.00.
Capital costs such as land and buildings have not been included, nor have overhead costs such as rates, insurance, living
costs, interest and farm manager costs. These costs have been excluded from the case study as these have been
assumed to be approximately the same between the four management systems.
Modelling canopy size over orchard lifetime
Actual canopy architecture growth data from the Plating Systems Trial for ages 0 to 6 years were used in conjunction with
the target maximum canopy architecture size to predict annual increases in tree canopy surface area and tree volume for
the four canopy management systems (Figures 1 and 2). These parameters were then used to extrapolate actual data
from age 0 to 6 years for revenue (fruit yields) and variable costs (nutrition, insect, disease management, irrigation, pruning,
picking and packing) across all four canopy systems for the lifetime of the orchard.
Key growth assumptions made for these trees based on standard Calypso® growth rates were; (1) terminal top shoots will
produce approximately 60 cm vertical growth per year and (2) terminal side shoots will produce approximately 30 cm
horizontal growth per year. Key canopy management assumptions were made for these trees based on standard
commercial practices. For trees that have not reached mature size; half of annual growth will be pruned off every year (30
cm top or 15 cm each side). For trees that have reached mature size; (1) pruned canopy height is 3.1 m, (2) pruned canopy
width for low & medium density trees is 3.2 m, high density is 1.2 m and trellis is 0.5 m, (3) pruned intra-row width (between
trees in a row) for low density is 3.2 m, medium density is 2.8 m, high density is 1.6 m and trellis is 2 m (no gap), and (4)
canopy bottom height is 0.9 m for low, medium and high density and 0.3 m for the trellis system.
16,000
14,000
Canopy Volume/hectare (m3)
12,000
10,000
8,000
6,000
4,000
2,000
0
0 1 2 3 4 5 6 7 8 9 10 11 12 13 14 15
Year
Conventional Low Density Conventional Medium Density Conventional High Density Trellis High Density
Figure 1. Maximum tree canopy volume per hectare. Data in solid lines were based on data from the PST. Data in
dotted lines were estimated and assumed to hold steady at year 11 levels for the remaining life of the orchard.
830,000
25,000
Canopy Surface Area/hectare (m2)
20,000
15,000
10,000
5,000
0
0 1 2 3 4 5 6 7 8 9 10 11 12 13 14 15
Year
Conventional Low Density Conventional Medium Density Conventional High Density Trellis High Density
Figure 2. Maximum tree canopy surface area per hectare. Data from in solid lines were based on data from the PST.
Data in dotted lines were estimated and assumed to hold steady at year 11 levels for the remaining life of the orchard.
Revenue calculations
Annual revenue was calculated from actual and predicted yield and quality grade proportions, at average market prices
(2017-2020) per grade for Calypso® fruit. Total fruit yields (kg/tree and t/ha) were based on results from the four orchard
management systems within the DAF Planting Systems Trial for years 0 – 6 and estimated yield from 7 years onwards
(Table 3). Estimated yields were calculated by determining the difference between the orchard canopy surface area/ha at
age 6 years and the projected canopy surface area/ha at maximum canopy size (Figure 2). Maximum yield per hectare
was achieved at a tree age of 11 years for the conventional low density system and 10 years for the other three systems.
Yields from year 11 onwards have been maintained throughout the residual orchard lifetime. (Cautionary note. There is
some uncertainty that despite the trend of increasing high early yields of the high density systems from ages 0-6 years,
there is some suggestions that these trees could become crowded and less productive over time and yields may reduce,
however there is currently no documented information to support this theory).
Harvested fruit was estimated at 95% of total fruit yield, with a further 1% of harvested fruit rejected in the pack-line as
non-saleable. Saleable fruit grades and prices were then estimated, with fruit allocated to four categories (premium, 1st
class, 2nd class and processing) at proportions similar to Calypso® variety averages of 77%, 14%, 4% and 4%
respectively. Prices for these four grades were determined based on average industry figures over the past 3 years, for
Calypso® fruit at $4.00/kg, $2.00/kg, $1.57/kg and $0.50/kg respectively. It was assumed that there were no differences
in quality and therefore no difference in prices for each of the four planting systems. This is based on preliminary results
from the Planting System Trial that show no significant difference in quality between treatments.
9Table 3. Total field yield per tree (kg) and per hectare (tonnes) for each of the planting systems
Conventional low Conventional medium Conventional high
PST Trellis high density
Age density density density
year 1,188 trees/ha
207 trees/ha 408 trees/ha 1,242 trees/ha
Kg/tree t/ha Kg/tree t/ha Kg/tree t/ha Kg/tree t/ha
0 2013 0 0 0 0 0 0 0 0
1 2014 0 0 0 0 0 0 0 0
2 2015 0 0 0 0 0 0 0 0
3 2016 11.1 2.3 9.1 3.7 11.9 14.8 7.8 9.3
4 2017 37.1 7.7 35.2 14.4 27.1 33.7 28.2 33.5
5 2018 46.3 9.6 43.0 17.5 32.2 40.0 34.4 40.9
6 2019 58.0 12.0 58.6 23.9 43.1 54.2 35.3 41.9
7 2020 66.0 13.7 64.0 26.1 45.0 55.9 41.0 48.7
8 2021 73.0 15.1 69.0 28.2 46.5 57.8 46.0 54.7
9 2022 79.0 16.4 74.0 30.2 47.0 58.4 50.0 59.4
10 2023 85.0 17.6 79.0 32.2 47.3 58.8 55.5 66.0
11+ 2024 88.0 18.2 80.0 32.6 47.3 58.8 55.5 66.0
Note: Yield figures from 0-6 years are actual figures collected from the Planting Systems Trial, whereas yield figures from
year 7 onwards were estimated.
Establishment costs calculations
Establishment costs for a conventional mango farm comprises costs such as land preparation, purchase and installation
of irrigation equipment (including pump and associated infrastructure), pre-plant fertiliser and weed control operations, the
cost of trees and planting. Trellis orchards require the same range of establishment costs as conventional orchards, but
with the additional cost of the purchase and installation of the trellis infrastructure. The trellis design used in this case study
was the same as that used in the DAF Planting Systems Trial, with details as follows for establishment on the ‘standard’
one hectare block:
• 18 rows x 138 m long = 66 trees per row
• 4 m inter-rows and 2 m between trees = 1,188 trees per hectare
• 3 m tall trellises with 6 x wires per trellis spaced 0.5 m apart; starting at 0.5 m from the ground
Variable production costs calculations
Nutrition
Nutrition costs included the materials and application costs of fertilisers and the plant growth regulator paclobutrazol, based
on the requirements for growing B74 mango trees in the Mareeba/Dimbulah region. Fertilisers used in this case study
included Lime, Gypsum, Ozcal™, Organibor®, Nitrophoska® Special, Solubor®, and Potassium Sulphate (See Appendix
1). Lime (pre-plant application only) and Gypsum (annual applications) were applied by spreader. Ozcal™, Organibor®,
Nitrophoska® Special, and Potassium Sulphate were hand-applied to young trees (aged 0 to 4 years) and then by spreader
to older trees (4+ years). Solubor® was applied as a foliar spray by air-blast mister, 4 times a year, to trees from 2 years
onwards. Paclobutrazol was applied as a collar-drench using a quad-bike mounted sprayer from year 3 onwards.
Fertigation methods were not used in this case study.
Annual nutrient application rates (kg/ha) for young trees (0 to 3 years) were initially low and based on industry standards
(DPI, 1999). Once trees began producing commercial crops (> 4 years) the annual application rates were then based on
10estimates of nutrient removal from harvested fruit & fertiliser efficiency. Industry nutrition guidelines (AMIA, 2017)
recommended annual nutrient replacement requirements rates per ten tonnes of fruit removed for the key elements N, K,
Ca and B at 21.3, 21.5, 14.4 and 5.0 kg/ha/year. Actual and estimated annual fruit yields from the PST (Table 3) were
used to calculate these rates. The annual nutrient replacement rates for trees at maximum canopy size (age 11 years
onwards) in the four canopy systems are presented below in Table 4.
Table 4. Annual nutrient replacement (kg/element/ha) for the four planting systems at maximum canopy size (age 11+
years) based on fruit removal & fertiliser efficiency.
Conventional
Industry guidelines Conventional Low Conventional High Trellis High
Element Medium
(yield 10 t/ha) (yield 18.2 t/ha) (yield 58.7 t/ha) (yield 65.9 t/ha)
(yield 32.6 t/ha)
N 21.3 38.76 69.5 125.0 140.4
K 21.5 39.13 70.2 126.2 141.7
Ca 14.4 26.20 47.0 84.5 94.9
B 5.0 9.10 16.3 29.4 33.0
Pest, disease and weed management
Pest and disease management costs included the cost of chemicals and their application based on the requirements for
growing B74 mango trees in the Mareeba/Dimbulah region (See Appendices 1 & 2). Insecticides used in this case study
were; Trivor®, Transform™, Success®, Applaud®, ParaMite®, Oil and Vayego®. Fungicides used were; Kocide®,
Mancozeb, Octave® and Amistar®. An annual pest and disease management spray program was developed using these
chemicals (plus foliar applied boron for nutrition purposes) for both non-bearing trees (age 0 to 3 years) and bearing trees
(> 3 years). Non-bearing trees require greatly reduced pest and disease management compared with bearing trees and a
simple program of only four chemical sprays/annum (including Trivor®, Success®, Oil, Applaud®, Kocide®) was used
(data not presented). The full pest and disease management program for bearing trees (> 3 years) included 13 chemical
spray operations/annum and is presented in Table 5. This program comprised 13 foliar spray applications with a tractor
rear-mounted axial fan air-blast mister (approx. 2,000 litre capacity).
Foliar spray applications frequently combine compatible chemicals in the same spray mix to reduce mister usage and
associated costs (Table 5). Within these 13 spray applications; 11 included fungicides, 9 included insecticides and 4
included nutrients. In order to portion out the annual variable costs of the 13 foliar sprays conducted using the air blast
mister these were allocated relatively as follows; 6 fungicide applications, 5 insecticide applications and 2 nutrient
applications.
The calculation of annual foliar spray costs was conducted using chemical product costs, application costs (machinery and
labour) and an assumption that the optimum spray amount to effectively wet a tree canopy is 0.3 L spray/m 3 canopy
volume. Application rates per hectare at various canopy development stages were calculated using estimated row canopy
volume per hectare which included the spraying of voids between trees within the row (See Table 9). To reduce model
complexity, canopy growth was divided into three stages; early, mid and mature, with the volume figure for that stage used
to calculate spray volume. Canopy volume growth trends showed two distinct patterns between the four systems; (1) slower
early volume growth as shown in low and medium conventional systems and (2) fast early volume growth as shown by the
high density conventional and trellis systems. For the conventional low and medium density trees, early stage 0 to 7 years
used year 7 volume data, mid stage 8 to 10 years used year 9 volume data, and mature stage 11 years onwards used
year 11 data. For the conventional high density and trellis trees, early stage 0 to 6 years used year 3 volume data, mid
stage 7 to 9 years used year 8 volume data and mature stage 10 years onwards used year 10 volume data.
Weed management included the cost of herbicides (Roundup), their application (via quad bike-mounted sprayer), slashing
costs (tractor-mounted slasher) and associated labour. Weed control operations were highest for the first two years for all
four systems due to increased labour necessary for spot spraying. From year three onward, weed management costs
dropped due to the ability to quickly band spray under the larger trees.
11Table 5. Spray program for 13 insecticide, fungicide and nutrition applications required each season
Spray No. Fruit Week Month/s Phenology Fungicide Insecticide Nutrition
1 Jan/Feb Flushing - Trivor®, Success® -
2 Feb/Mar Flushing Kocide® Success®
3 Mar – June Dormancy Kocide® ParaMite® + Oil -
4 June - July Dormancy - Oil
5 0 Mid July Flowering starts Kocide® + Mancozeb Transform™ + Boron
Success®
6 2 Flowering Octave® + - Boron
Mancozeb
- 4 Mid Aug Flowering - - -
7 6 Fruit set Octave® + - Boron
Mancozeb
8 8 Mid Sept Fruit set Kocide® + Mancozeb Vayego® -
9 10 Fruit set Amistar® Applaud® + Vayego® Boron
10 12 Mid Oct Fruit development Kocide® + Mancozeb Applaud® -
11 14 Fruit development Mancozeb
12 16 Mid Nov Fruit development Amistar® Trivor® -
13 18 Fruit development Amistar® - -
20 Mid Dec Harvest - - -
Irrigation management
The irrigation rate per hectare for the four canopy management systems was calculated using the industry standard
information for a conventional low density mango orchard growing at Mareeba (mean annual rainfall 900 mm). In order to
extrapolate these data across the other three canopy systems, canopy surface area (m 2) was selected as the best
parameter for comparing relative plant water use for trees at different growth stages over the orchard lifetime (Table 6). A
multiplication factor was applied to determine irrigation rate (ML/ha) at four tree ages; 2, 7, 9 and 11 years. The estimated
irrigation rates for the four canopy systems are presented below in Table 6.
Table 6. Estimated irrigation rates (ML/ha) at four ages for the four canopy management systems.
Planting system 2 years 7 years 9 years 11 years
Conventional low 1.3 2.6 3.2 4.5
Conventional medium 2.8 5.9 7.2 8.3
Conventional high 4.5 8.5 10.9 11.1
Trellis high 4.3 7.3 9.3 10.0
12Results
Establishment costs
The land preparation costs per hectare for the four planting systems investigated were similar and ranged from $1,100/ha
for the low density conventional system up to $1,262/ha for the high density systems (Table 7 & Figure 3). The higher
costs for irrigation (equipment, materials and installation) and planting for the medium and high density systems were due
to the higher number of rows and trees per hectare (Table 7 & Figure 3). For trellised systems, establishment costs also
included the costs associated with establishing the trellising infrastructure which included items such as posts, wires and
tie-downs (Table 8).
Table 7. Establishment costs per hectare for the four planting systems
Planting system Land Prep. Irrigation Planting Trellising Total
Conventional low density $1,100 $5,800 $3,591 - $10,491
Conventional medium density $1,262 $7,513 $7,078 - $15,853
Conventional high density $1,262 $12,676 $21,549 - $35,487
Trellis high density $1,262 $12,792 $20,612 $31,981 $66,647
$70,000
$60,000
$50,000
$/hectare
$40,000
$30,000
$20,000
$10,000
$0
Land Irrigation Planting Trellising TOTAL
preparation
Conventional low density Conventional medium density Conventional high density Trellis high density
Figure 3. Establishment costs for each planting system: conventional low, medium, and high density and trellis high
density in $/hectare.
The configuration and materials selected for the trellis system (Table 8) are the same as the specifications designed to
withstand cyclonic winds in north Queensland (Drinnan, et al. 2018). The costs to establish the trellis infrastructure alone
was estimated at $31,981 per hectare. This is in addition to the typical establishment costs for a conventional farm (Table
7 & Figure 3).
13Table 8. Costs of materials and labour for one hectare of trellis infrastructure (current as of January 2020).
Cost Quantity per Quantity/ha Sub-Total
Item
($) row (18 rows) ($)
175mm x 4.8m CCA H5 Pine logs 98.50 12 216 21,276
2.65mm long life, grow wire (m) 140m x 6 wires (per m) 0.17 840 15,120 2,517
1360 long single plate 20mm high tensile rod anchor 30.45 2 36 1,096
40mm x 4mm long-life galvanised, barbed staples (6/post) 0.08 72 1,296 103
Medium gripple plus 2-3.25mm 2.60 12 216 561
Post installation (machinery and labour per hr) 195.00 1 18 3,510
Wire installation (labour per hr) 27.00 6 18 2,916
TOTAL 31,981
Variable production costs
Nutrition
Nutrition costs for the four orchard management systems are presented in Figure 4. These costs quickly increased for the
first four years for all systems due to the annual increase in the fertiliser rate required to support tree growth, and the higher
labour costs associated with hand application of fertiliser. For interim years 4 to 11, nutrition costs increased at a slower
rate, due to labour savings from use of a fertiliser spreader, and fertiliser rates only slowly increasing over time in response
to increasing yields. From peak production, years 11 onwards, fertiliser rates remained consistent for the remainder of the
productive life of the orchard. The conventional low density system had the lowest annual nutrition costs at $1,400/ha/year
at the time of peak production (Figure 4). The other systems had higher nutrition costs; however this was associated with
the higher fruit yields from these systems. The conventional medium density system had a nutrition cost of $2,106/ha/year,
the high density conventional system $3,132/ha/year and the high density trellis system $3,016/ha/year at peak production
(Figure 4). The nutrition costs for both high density systems were similar for the entire production period due to the similar
tree number and yield per hectare (Figure 4).
$3,500
$3,000
$2,500
$/hectare/year
$2,000
$1,500
$1,000
$500
$0
0 1 2 3 4 5 6 7 8 9 10 11 12 13 14 15 16 17 18 19 20
Year
Conventional low density Conventional medium density Conventional high density Trellis high density
Figure 4. Nutrition costs ($/ha/year). Includes labour, the cost of fertilisers and their application. Data from years 0 – 6
(solid lines) were based on data from the PST. Data from year 7 onwards (dotted lines) were estimated.
14Insect management costs
Insect management includes the cost of insecticides and their application. All insecticides were applied as a foliar spray
by air-blast mister as per the spray program in Table 5. Foliar application rates (L/ha) were based on canopy volume per
hectare and assumed any intra-row canopy voids were also sprayed.
Insect management costs are presented in Figure 5. These costs remained relatively low for the first three years prior to
the trees bearing fruit. For the following four years (years 3 to 7), costs increased as the complete spray program was
implemented to protect fruit. For conventional low and medium density systems for years 8 to 10, the costs increased in
line with increases in canopy volume. These systems were predicted to reach mature canopy volume from year 11
onwards, coinciding with the highest insect management costs for these systems. The trellis and conventional high
density systems were predicted to reach mature canopy volume by year 10, hence the maximum insecticide
management costs occurred a year earlier than the lower density treatments.
At peak production, insect management costs were $5,415 for the conventional medium density system, the highest of
all systems (Figure 5). The conventional low density system was the second most expensive at $3,984/ha/year. At
$3,478/ha/year, the conventional high density system was almost $2,000 less than the medium density system (Figure
5). The trellis high density system had the lowest insect management costs at $2,913/ha/year at peak production, which
is $2,500/ha/year less than the medium density system (Figure 5).
$6,000
$5,000
$4,000
$/hectare/year
$3,000
$2,000
$1,000
$0
0 1 2 3 4 5 6 7 8 9 10 11 12 13 14 15 16 17 18 19 20
Year
Conventional low density Conventional medium density Conventional high density Trellis high density
Figure 5. Insect management costs ($/ha/year). Cost of chemicals and their application (including labour) are included in
the calculation. Data from years 0-6 (solid lines) were based on data for the PST. Data from year 7 onwards (dotted
lines) were estimated.
Disease management costs
Disease management includes the cost of fungicides as well as their application. All fungicides were applied as a foliar
spray by air-blast mister as per spray program in Methodology section (Table 5). Application rates (L/ha) were based on
canopy volume per hectare and assumed any intra-row canopy voids were also sprayed. Disease management costs are
presented in Figure 6. As with insect management costs, disease management costs remained relatively low for the first
three years before increasing every three to four years in-line with increases in canopy volume.
At peak production, disease management cost of $6,366 for the conventional medium density system were the highest of
all systems (Figure 6). This was due to the medium density system having the highest canopy volumes (Figure 1). The
conventional low density system was the second most expensive at $4,560/ha/year. At $3,179/ha/year, the conventional
high density system cost half as much as the conventional medium density system (Figure 6). The trellis high density
system had the lowest disease management costs at $2,706/ha/year at peak production (Figure 6).
15$7,000
$6,000
$5,000
$/hectare/year
$4,000
$3,000
$2,000
$1,000
$0
0 1 2 3 4 5 6 7 8 9 10 11 12 13 14 15 16 17 18 19 20
Year
Conventional low density Conventional medium density Conventional high density Trellis high density
Figure 6. Disease management costs ($/ha/year). Cost of chemicals and their application (including labour) were
included in the calculation. Data from years 0 – 6 (solid lines) were based on data from the PST. Data from year 7
onwards (dotted lines) were estimated.
Chemical use efficiency
At maximum canopy size, the conventional and trellis high density systems had the greatest chemical application efficiency
as theoretically there were little to no voids between tree canopies within the row (Table 9). In these circumstances the
chemical is only applied to the tree canopy and not to open space between trees. Additionally, it is expected that improved
spray penetration would be achieved within the trellis system as the mature canopy width (0.5-1.1 m) is significantly less
than the conventional low density (3.2-3.8 m). The conventional low and medium densities had a chemical wastage of 37%
and 16% respectively, due to the voids between tree canopies. In chemical costs alone, this equated to a loss of
$3,161/ha/year and $1,885/ha/year, respectively (Table 9).
Table 9. Chemical use efficiency including costs of chemicals lost in mature systems with voids between trees within the
row. (Note. Row canopy volume/ha includes intra-row voids whereas actual tree canopy area/ha excludes intra-row
canopy voids).
Crop
Row canopy Tree canopy Amount of
Difference Loss protection
Planting system volume/ha volume/ha costs lost
(m3) (%) costs
(m3) (m3) ($/ha)
($/ha)
Convention Low 13,215 8,369 4,846 37 8,544 3,161
Conventional Medium 17,620 14,760 2,860 16 11,781 1,885
Conventional High 10,967 10,967 0 0 6,657 0
Trellis High 8,910 8,910 0 0 5,619 0
Weed management costs
Weed management costs are presented in Figure 7. Costs were highest for the conventional and trellis high density
systems (exactly the same) throughout the life of the orchard. These systems have more rows than the conventional low
and medium density systems, hence side-throw slashing and boom spraying costs would be higher for these systems.
16$1,200
$1,000
$/hectare/year
$800
$600
$400
$200
$0
0 1 2 3 4 5 6 7 8 9 10 11 12 13 14 15 16 17 18 19 20
Year
Conventional low density Conventional medium density Conventional high density Trellis high density
Figure 7. Weed management costs ($/ha/year). Cost of chemicals, their application (including labour) and slashing costs
are included in the calculation. Data from years 0-6 (solid lines) were based on data from the PST. Data from year 7
onwards (dotted lines) were estimated. Costs for conventional high density are the same as trellis high density, hence
only trellis high density costs are visible.
Irrigation costs
Irrigation costs cover the cost per megalitre of water used as well as the electricity costs for the pump. Application rates
(L/ha) were based on canopy surface area per hectare. Sprinklers were used and assumed to irrigate at a rate of 60
L/hour. Irrigation costs for the four planting systems are presented in Figure 8. As with insect and disease management
costs, irrigation costs increased every three to four years to coincide with increases in canopy volume. At full production,
the conventional high density had the highest irrigation costs at $1,576/ha/year, which was $173/ha/year more than the
trellis high density system (Figure 8). This was due to the greater canopy surface area and the extra trees per hectare of
the conventional high-density system, compared to the trellis system. The conventional medium density system had the
second-lowest costs at $1,160/ha/year. The conventional low density costs were less than half that of the conventional
high density irrigation costs ($634/ha/year), again mainly due to the lower canopy surface area for that system (Figure 8).
$1,600
$1,400
$1,200
$/hectare/year
$1,000
$800
$600
$400
$200
$0
0 1 2 3 4 5 6 7 8 9 10 11 12 13 14 15 16 17 18 19 20
Year
Conventional low density Conventional medium density Conventional high density Trellis high density
Figure 8. Irrigation costs which include the cost of water usage (per ML) and pump electricity charges. Data from years 0
– 6 (solid lines) were based on data from the PST. Data from year 7 onwards (dotted lines) were estimated.
17You can also read