Enhancing Knowledge-Transfer for Digital Exhibitions via Augmented Reality - TU Dresden
←
→
Page content transcription
If your browser does not render page correctly, please read the page content below
Enhancing Knowledge-Transfer
      for Digital Exhibitions via
           Augmented Reality

                   Bachelor Thesis
                   Thomas Bruhn

                      TU Dresden
              Faculty of Computer Science
   Institute of Software and Multimedia Technology
                 Chair of Media Design

     Professor: Prof. Dr.-Ing. habil. Rainer Groh
Supervisors: M. Sc. Lars Engeln, M. Sc. Robert Richter

                 September 27, 2018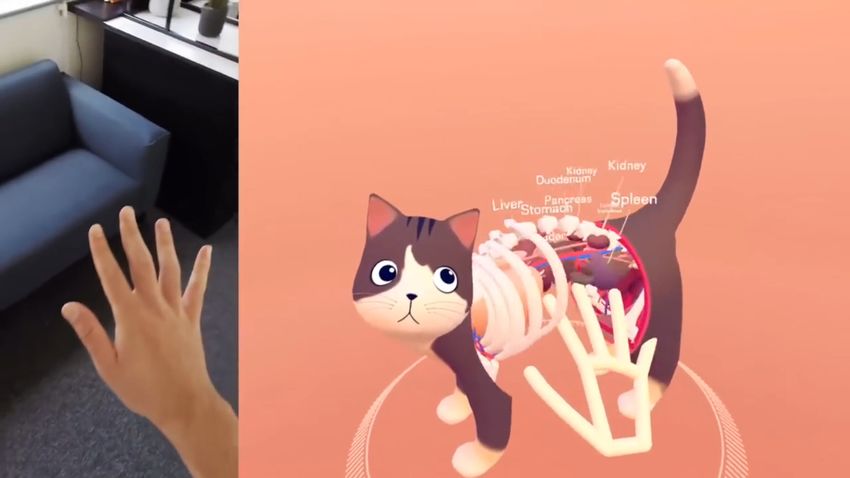
Declaration of Independent Work

I hereby declare that I completed this work on my own and have not used any resources
other than those noted.

Thomas Bruhn
Dresden, September 27, 2018

Abstract

   Exhibitions have an interest in utilizing the benefits AR has to offer regarding knowledge-
transfer and engagement of visitors. Interaction with existing applications for handheld
devices is mostly reduced to augmented browsing, where users are passive observers of the
augmented scene. Missing interaction guidelines and principles hinder the development
of more interactive handheld AR applications. Therefore, user- and interaction studies
during the development are needed. In this thesis, an interaction method to investigate
exhibits through handheld AR is established. The concept is based on a conducted user
study which aims to examine the natural behavior during exploration of unknown objects.
It intents to make the investigation of exhibits engaging and easy.

                                             4
Contents
1 Introduction 9
2 Theoretical Background 10
2.1 Augmented Reality . . . . . . . . . . . . . . . . . . . . . . . . . . . . . . . 10
2.1.1 Displays . . . . . . . . . . . . . . . . . . . . . . . . . . . . . . . . . 11
2.1.2 Tracking . . . . . . . . . . . . . . . . . . . . . . . . . . . . . . . . . 15
2.1.3 Interaction . . . . . . . . . . . . . . . . . . . . . . . . . . . . . . . 20
2.2 Augmented Reality in Education . . . . . . . . . . . . . . . . . . . . . . . 21
3 Related Work 25
3.1 Augmented Reality in the Context
of Museums and Exhibitions . . . . . . . . . . . . . . . . . . . . . . . . . . 25
3.2 User- & Interaction Studies . . . . . . . . . . . . . . . . . . . . . . . . . . 30
4 Study & Evaluation 34
4.1 Hypotheses . . . . . . . . . . . . . . . . . . . . . . . . . . . . . . . . . . . 34
4.2 Structure . . . . . . . . . . . . . . . . . . . . . . . . . . . . . . . . . . . . 35
4.2.1 Derivation . . . . . . . . . . . . . . . . . . . . . . . . . . . . . . . . 35
4.2.2 Objects . . . . . . . . . . . . . . . . . . . . . . . . . . . . . . . . . 37
4.3 Study Results . . . . . . . . . . . . . . . . . . . . . . . . . . . . . . . . . . 42
4.3.1 Script . . . . . . . . . . . . . . . . . . . . . . . . . . . . . . . . . . 42
4.3.2 Conclusion . . . . . . . . . . . . . . . . . . . . . . . . . . . . . . . 44
5 Analysis 46
5.1 Historical Acoustic-Phonetic Collection . . . . . . . . . . . . . . . . . . . . 46
5.2 Requirements for the Application . . . . . . . . . . . . . . . . . . . . . . . 47
5.3 Current State of Web-AR Technology . . . . . . . . . . . . . . . . . . . . 48
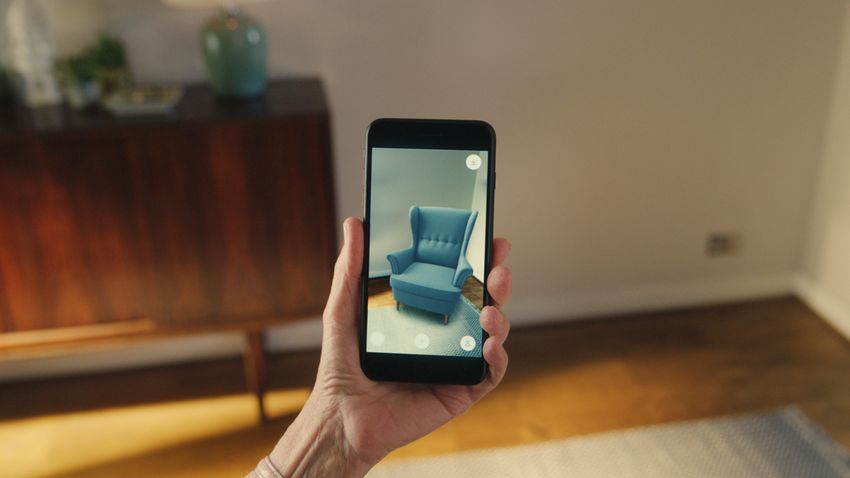
5.4 Cat Explorer . . . . . . . . . . . . . . . . . . . . . . . . . . . . . . . . . . 49
6 Concept 51
6.1 Interaction Design . . . . . . . . . . . . . . . . . . . . . . . . . . . . . . . 51
5
6.1.1   Exploration . . . . . . . . . . . . . . . . . . . . . . . . . . . . . . .     51
        6.1.2   Selection . . . . . . . . . . . . . . . . . . . . . . . . . . . . . . . . .   54
        6.1.3   Rotation . . . . . . . . . . . . . . . . . . . . . . . . . . . . . . . . .    55
  6.2   Interface Design & Mockup . . . . . . . . . . . . . . . . . . . . . . . . . .         56
        6.2.1   Exploration Sphere . . . . . . . . . . . . . . . . . . . . . . . . . . .      56
        6.2.2   Buttons . . . . . . . . . . . . . . . . . . . . . . . . . . . . . . . . .     57
        6.2.3   Display of Information . . . . . . . . . . . . . . . . . . . . . . . . .      58

7 Implementation                                                                              59
  7.1   Scope . . . . . . . . . . . . . . . . . . . . . . . . . . . . . . . . . . . . . .     59
  7.2   Development Environment . . . . . . . . . . . . . . . . . . . . . . . . . . .         59
        7.2.1   Website Setup . . . . . . . . . . . . . . . . . . . . . . . . . . . . .       60
        7.2.2   Development Software . . . . . . . . . . . . . . . . . . . . . . . . .        60
  7.3   Abstraction of the Interaction Method . . . . . . . . . . . . . . . . . . . .         63
        7.3.1   Translation of the Sphere . . . . . . . . . . . . . . . . . . . . . . .       63
        7.3.2   Magic Lens . . . . . . . . . . . . . . . . . . . . . . . . . . . . . . .      65
        7.3.3   Translation through the Sphere . . . . . . . . . . . . . . . . . . . .        66
        7.3.4   Selection of Objects . . . . . . . . . . . . . . . . . . . . . . . . . .      67

8 Conclusion                                                                                  70

                                               6
List of Figures

 2.1   Reality-Virtuality Continuum . . . . . . . . . . . . . . . . . . . . . . . . .        10
 2.2   See-Through Methods . . . . . . . . . . . . . . . . . . . . . . . . . . . . .         12
 2.3   AR displays categorized through display to eye distance . . . . . . . . . .           13
 2.4   Magic Leap HMD with controllers . . . . . . . . . . . . . . . . . . . . . .           14
 2.5   IKEA Place displays furniture into rooms of shoppers . . . . . . . . . . .            14
 2.6   Projective display for a rock climbing game . . . . . . . . . . . . . . . . .         15
 2.7   Transformation between CSs for registration         . . . . . . . . . . . . . . . .   16
 2.8   Typical markers for marker-based tracking . . . . . . . . . . . . . . . . . .         19
 2.9   Interest points of an outdoor scene, visualized with yellow crosses         . . . .   19
 2.10 HoloLens gestures      . . . . . . . . . . . . . . . . . . . . . . . . . . . . . . .   20
 2.11 Tangible user interface . . . . . . . . . . . . . . . . . . . . . . . . . . . . .      21
 2.12 Bernoulli blower with digital augmentation . . . . . . . . . . . . . . . . .           23

 3.1   AR application Archaic Gallery of the Acropolis Museum . . . . . . . . .              26
 3.2   Bone Hall exhibition . . . . . . . . . . . . . . . . . . . . . . . . . . . . . .      29
 3.3   Three Stages of technology after [Mog07, p. 12] . . . . . . . . . . . . . . .         31

 4.1   Representation of objects in the order of presentation to the participant .           36
 4.2   Objects and their possible representation visualized. Conducted cross-
       section is highlighted . . . . . . . . . . . . . . . . . . . . . . . . . . . . . .    37
 4.3   Pictures of the photographed object employed in the pilot study . . . . .             40
 4.4   Other objects of the Study. (a) haptic object, (b) digital object . . . . . .         40

 5.1   Interaction with cat in Magic Leep’s demo Cat Explorer . . . . . . . . . .            49

 6.1   General interaction method of Cat Explorer . . . . . . . . . . . . . . . . .          52
 6.2   Two of the occlusion-based interaction methods . . . . . . . . . . . . . . .          53
 6.3   Two interaction methods for 3D positioning in AR on handheld devices .                54
 6.4   Device Pose-based Selections – left: center-based selection, right: icon-
       based selection . . . . . . . . . . . . . . . . . . . . . . . . . . . . . . . . .     55
 6.5   Rotation of the scenes orientation along the x-axis by swiping . . . . . . .          56

                                             7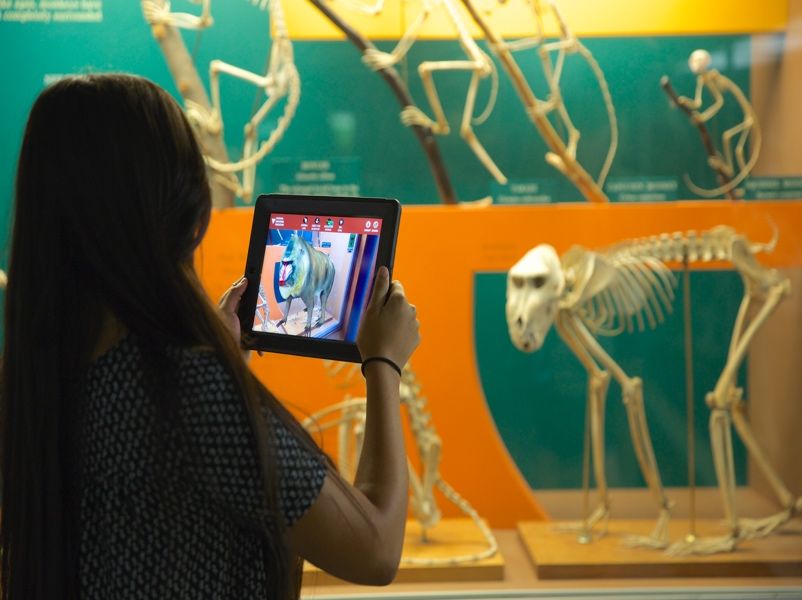
6.6   Display variations for the exploration sphere from left to right: opaque
      sphere, axis partly visible, center ball . . . . . . . . . . . . . . . . . . . . .   57
6.7   Display possibilities for the buttons from left to right: text stretching over
      the whole width, text in bottom corners, icons in bottom corners . . . . .           57
6.8   Display possibilities for the additional information from left to right: inte-
      grated in scene, full new site . . . . . . . . . . . . . . . . . . . . . . . . . .   58

7.1   Three.js scene graph . . . . . . . . . . . . . . . . . . . . . . . . . . . . . .     61
7.2   Basic three.js scene with a rotating cube . . . . . . . . . . . . . . . . . . .      62
7.3   An entity for a blue sphere emitting light in A-Frame        . . . . . . . . . . .   63
7.4   The boilerplate for a component in A-Frame . . . . . . . . . . . . . . . . .         64
7.5   Development of the clipping component . . . . . . . . . . . . . . . . . . .          66
7.6   Development of the movable component . . . . . . . . . . . . . . . . . . .           67
7.7   Global state for prototype, that tracks the selectable object . . . . . . . .        69

                                            8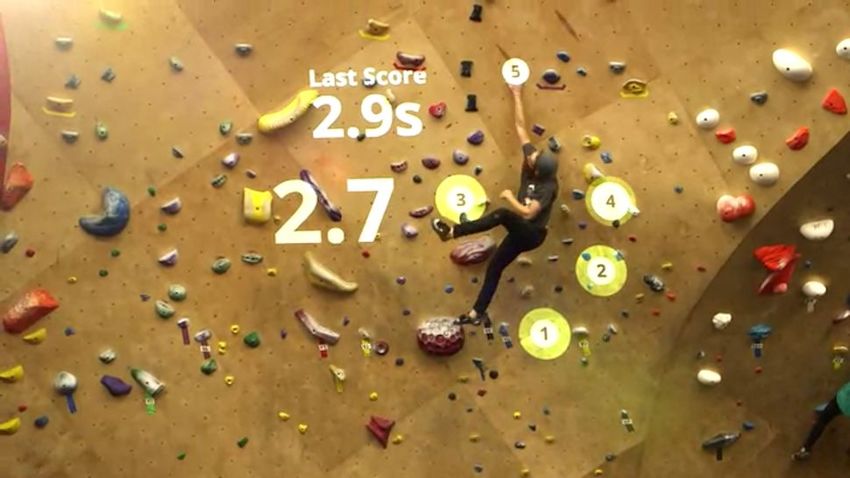
Chapter 1

Introduction

Augmented Reality (AR) technology is gaining popularity in the commercial field. Large
companies like Google, Apple, Microsoft and others are developing and releasing technol-
ogy for AR1 .
    A calculated estimate from ARTILLRY2 states that in 2020 over 2.5 billion smartphone
will support the AR kits from Google and Apple alone. With the growing accessibility
of AR, many people already experienced it through their smartphones or other devices.
Apps like Pokémon Go, Ikea Place or Amazons AR View are popular examples for this.
But placing virtual animals, furniture, or other household goods in users’ surroundings is
only a tiny portion of what AR potentially has to offer. A reason AR experiences at the
moment mostly rely on passive observation is because the interaction with AR is still a
complex topic and in need of more research [BKM09].
   As AR gains mainstream popularity and AR technology becomes more available, ex-
hibitions also experiment with this medium. However, availability and public recognition
are not the only reasons for exhibition to use AR. The medium is also proven to benefit
its users in the educational context – boosting learning achievements, engagement, and
motivation [AA17]. Secondly, where the exhibit lack interactivity, AR can step in and
produce a much more dynamic and personalized experience for visitors. Coexistence of
virtual objects and real environment is a attractive concept for exhibits.
    The Historical Acoustic-Phonetic Collection (HAPC) is one of the exhibitions aiming
to utilize the benefits of AR for enhancing their visitors experience. This thesis aims to
develop an application concept for the HAPC with. It begins with a technical introduction
of AR, its educational benefits, and research about the utilization of AR in exhibition.
Afterwards, a study is designed and conducted to base the application concept upon. The
study together with an analysis of the requirements form the foundation of the proposed
concept for which a prototype is developed.
   1 https://www.businessinsider.de/apple-google-microsoft-amazon-go-head-to-head-in-augmented-

reality-2017-9?r=US&IR=T accessed: 22.09.2017
   2 https://artillry.co/2017/10/12/arcore-arkit-4-25-billion-devices-by-2020/ accessed: 22.10.2018

                                                   9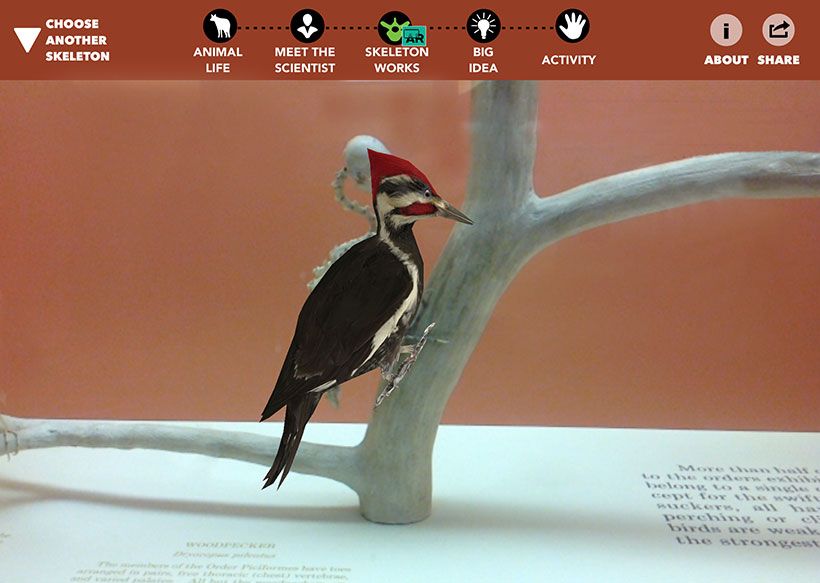
Chapter 2

Theoretical Background

2.1 Augmented Reality
The word augmented means to extend, increase or enlarge. Augmented Reality can be
loosely defined as the enhancement or enrichment of the real world with digital content.
With AR becoming more popular, confusion about the definition of AR and its distinction
from Virtual Reality (VR) from a consumer standpoint emerges.
   The Reality-Virtuality (RV) Continuum, developed by Paul Milgram et al. helps
to understand why it is difficult to restrict the concept of AR with a clear definition
[MTUK95]. As displayed in Figure 2.1, the opposites of the RV Continuum are the real
and the virtual environment. The real environment, on the left end, is defined as ”any
environment consisting solely of real objects, and includes whatever might be observed when
viewing a real-world scene either directly in person, or through some kind of a window,
or via some sort of a (video) display” ([MTUK95, p. 283]). The virtual environments, on
the right end, are defined as ”environments consisting solely of virtual objects, examples
of which would include conventional computer graphic simulations, either monitor-based
or immersive” ([MTUK95, p. 283]). The space in between these two is Mixed Reality
(MR), characterized by Milgram and Kishino in 1994 as any environment where real world
objects and virtual objects are presented at the same time on the same display [MK94].

                        Figure 2.1: Reality-Virtuality Continuum

                                 (See Figure 2 [AAS18])

                                            10
AR is the starting point of MR from the side of reality. On the other side Augmented
Virtuality (AV) is the starting point of virtuality. Milgram and Kishino define AV as an
MR experience that is predominantly virtual [MK94, p. 2]. An example of AV can be the
maintenance of a race car, where a virtual clone of an engine is displayed on a monitor
with additional information about the state of the real engine. AR on the other hand is
a MR experience that primarily consists of real world objects.
As noted by the Milgram and Kishino, it’s hard to define whether an experience is
either predominantly virtual or predominantly real [MK94].
For a definition of AR it is important that it does not note a specific output device nor
limit it to any of the senses, like only enhancing the visual sense for example. A popular
definition is proposed by Azuma [Bro97]. As stated in his article AR must feature the
following attributes:
• Blend together real and virtual objects
• Allow real time interaction
• Be registered in 3D
Combining these attributes with the distinction from AV—that AR must contain more
real world objects than virtual objects—produces a broad enough definition to include all
display- and augmentation forms.
2.1.1 Displays
As diverse as the possibilities of enhancing reality are, as diverse are the displays. In their
study of AR technologies, Van Krevelen and Poelman point out that the technological
requirements for AR are considerably larger than for VR, which led to the fact that VR
matured much faster than AR [vKR10]. Aural (sound), haptic (touch), olfactory (smell)
and gustatory (taste) displays are far less developed than visual displays. The following
Section will give an insight on the different display technologies, with focal point on the
visual domain, explaining display methods and spatial projection.
Methods of Augmentation
The objective of AR displays is to combine two sources: the real word and a computer
generated world – tricking the senses of users to think that these two sources are one
singular source. For an authentic visual augmentation the perspective and the viewing
direction regarding the digital objects and the real world must be as identical as possible.
Furthermore, the scale of digital object has to correspond to their coordinates in the real
world.
If the realization of this merge happens via a lens, the display is categorized as an
optical see-through (OST). OSTs merge a reflected virtual image between users and their
11(a) Video See-Through (b) Optical See-Through
Figure 2.2: See-Through Methods
(See Figure 11, 13 [Azu97])
environment. The lens is a thin, transparent parallel plate allowing users to still see their
surroundings. Whereas OSTs use a minimally obtrusive approach—leaving as much of
the real world as possible intact—video see-through displays (VST) block the view to the
real world to merge the two image sources together. Both methods are displayed in Figure
2.2. With VST users see their environment through a display and the merging happens
digitally on the given device.
VSTs are easier to realize than OSTs, because tracking plays a less significant role
[RF00]. When merging the two worlds VSTs can decide on a pixel-level where and how
to place digital objects, because they only work with images of the real world. OSTs
however, deliver better immersion because users perceives their environment naturally
and not through a camera.
Spatial projections use a different approach. While see-through displays rely on a
display to combine the real and the virtual world, spatial projections directly project
virtual images onto real world. Consequentially, users do not have to wear special gear,
hold any devices or have other intermediate objects between them and the two merged
worlds. The degree of immersion for spatial AR is especially variable, starting with 2-
dimensional projection on the surface of an object and also including the use of plasma
in the air to create virtual objects in true 3-dimensional free space [SKS+ 08].
All three visual display methods can optionally contain pose sensors that keep track
of the position of users in their environment. The Global Position System (GPS) for
example can be used to track where users are to let them experience AR depending on
their location. This method is widely used in tourism [TCD+ 00, HJG13, KKZ12]. An-
other example of pose sensors are the face tracking capabilities to determine the exact
location of users eyes. With face tracking capabilities, 2D displays are able to simulate a
3D experience – creating the illusion of depth on regular 2D displays.
12Figure 2.3: AR displays categorized through display to eye distance
(See Figure 2.18 [SH16])
Visual Displays
Visual AR displays can be categorized corresponding to their distance from eye to display,
as displayed in Figure 2.3. Schmalstieg and Höllerer distinguish devices between the Head-
, Body- and World space – leading to four different display classes [SH16].
Head-mounted displays—located in the Head space—are devices worn like glasses. One
of the worlds first HMDs for MR was constructed by Ivan Sutherland in 1968 [Sut68].
It was so heavy that it needed to hang from the ceiling in order for a person to wear
it. Thus it was nicknamed ”Sword of Damocles”. While it was predominantly VR, the
display was partially see-through and already included head tracking. Nowadays HMDs
got lighter and a lot more comfortable. An example for a current OST HMD is the Magic
Leap One1 , a commercial optical-see through HMD seen in Figure 2.4. Modern HMDs
are equipped with several sensors keeping track of the users orientation and movement as
well as optical sensors—like cameras and depth sensors—to track the environment around
the user. For interaction with the augmented world controllers with individual sensors
or gesture tracking is used. The scope of application is broad for HMDs. Examples
of HMD appliance are to assist in manufacturing processes [CM92] or the usage in the
medical context for the assistance of surgeons [LISD10] – both fields in which focussing
on a display in the room or having to hold a display in one’s hand are troublesome.
Because of the ubiquity of smartphones and tablets equipped with back-facing cameras,
they are popular devices for Handheld displays. The device’s screen is used as the mediator
between the real world and the digital objects – making it a VST display. OST is rather
rare for handheld devices. An example for a handheld OST display is the Magic Lens,
a mirror-like object with a small, inset surface presented in [BH06]. Handheld AR got a
lot of attention when PokemonGo launched in 2016 [Kam17]. Since then, many others
started integrating AR in their apps. NASA’s Spacecraft AR2 lets users place spacecrafts
1 https://www.magicleap.com/magic-leap-one accessed: 23.09.2018
2 https://play.google.com/store/apps/details?id=gov.nasa.jpl.spacecraftAR accessed: 21.09.2018
13Figure 2.4: Magic Leap HMD with controllers
Source: CNET, url: https://www.cnet.com/news/magic-leap-opens-creator-portal-gdc-2018/ accessed: 12.09.2018
Figure 2.5: IKEA Place displays furniture into rooms of shoppers
Source: Medium, url: https://medium.com/space10/assembling-ikeas-new-ar-app-without-a-manual-c74c09d0488d, accessed:
12.09.2018
in their true size in the users environment. The German television show Galileo enhances
their viewers experience with the Galileo AR3 app – synchronizing their content in the
TV-show with the app. In Figure 2.5 IKEA’s app IKEA Place4 is displayed. It lets users
place furniture directly into their home to experience what it would look like. With the
many potential consumers, handheld AR is especially interesting for businesses.
The display types is the World space have the potential for collaboration and shared
experiences between users. Stationary displays—like a computer with a webcam—are the
category in the World space, that still use conventional monitors and therefore correlates
with the fundamental functionality of the handheld displays. The difference is that the
monitor is stationary placed in the user’s environment, so they don’t have to hold it in
3 https://play.google.com/store/apps/details?id=de.prosiebensat1digital.galileoar accessed: 21.09.2018
4 https://play.google.com/store/apps/details?id=com.inter_ikea.place accessed: 21.09.2018
14Figure 2.6: Projective display for a rock climbing game
Source: Nerdist, url: https://nerdist.com/augmented-reality-rock-climbing-allows-you-to-be-in-a-video-game/, accessed:
12.09.2018
their hands anymore. A virtual mirror, for example, captures a video of the user, rotates
it on the vertical axis and can augment the scene before displaying it on a screen [SH16,
p. 72]. In this scenario users could try on digital apparel – like glasses, jewelry or clothes.
Projective displays—also known as spatial displays—project the digital objects directly
onto the real world. No monitor is used for projective displays – leading to a reduced
cognitive load of the users. The need to switch the attention between the monitor and the
real world disappears. An example for projective displays can be seen in Figure 2.6. It is
an indoor climbing game5 that uses a laptop and a projector to display courses and scores
on a boulder wall. Participants of the game try to complete the course in the quickest
possible time.
2.1.2 Tracking
Before an AR system is able to overlay digital objects correctly onto the real world, it
has to sense its environment. Tracking generally is the calculation of the current position
and/or orientation. As explained by Warren Robinett and Richard Holloway, the process
to display digital objects can be represented by a pipeline of transformations between
different coordinate systems (CSs) [RH95]. They explain the process for VR, but the
theory applies to AR as well. A CS can be fully specified through its origin, orientation
and its containing objects. CSs relevant to AR are:
• The (virtual) object coordinate system
• The world coordinate system
5 https://joinrandori.com/ accessed: 21.09.2018
15• The viewpoint coordinate system (Originally called room coordinate system by
Richard Holloway. Changed to viewpoint for clarity)
The transformations between these systems are the world-object transformation, and
the viewpoint-world transformation, which are visualized in Figure 2.7. The world-object
transformation determines the position, orientation, and size of each virtual object in the
world CS. The viewpoint-world transformation determines the relationship between the
world coordinates and the camera coordinates. The final transformation is the projective
transformation. It usually applies a viewport transformation to get the right aspect ratio
and then drops the z-axis of the CS for every display and camera.
This whole process is called registration. If the AR system has a static viewpoint,
registration only has to happen once and is called static registration. In the case that the
viewpoint is able to move around, dynamic registration is needed, which requires tracking
[SH16, p. 89].
Tracking describes the dynamical determination of spatial characteristics at runtime
[SH16, p. 85]. Tracking an object means to continuously measure the objects traits. In
the context of AR, objects that may be tracked are: The head of users, their eyes, the
camera, or the display. The abilities of tracking systems can be classified by the degrees
of freedom (DOF). 3DOF allows tracking the position of an object along the x, y, and
z axis of its environment. With 6DOF the system is able to track the position and the
orientation of the object. The orientation describes the relative position or direction of
an object without the environment as a dependency. It also has three angles: yaw, pitch,
and roll. Although 6DOF is the preferable method for AR systems, most tracking sys-
tems provide less. Therefore, tracking methods of more advanced AR systems generally
combine different tracking systems.
Figure 2.7: Transformation between CSs for registration
(See Figure 3.2 [SH16])
16Methods of Tracking
Prior to the selected tracking systems being discussed, general characteristic of tracking
systems are explained. Tracking systems use a large amount of different technologies and
approaches to create spatial data. In their survey about tracking technologies for virtual
environments Rolland, Baillot, and Goon defined different approaches for tacking which
are summarized in the following paragraph [RDB01]:
Mechanical Linking (ML) systems are reasonably the simplest approach for motion
tracking. These systems use mechanical links among the reference and the target, to
determine its position [Jau91]. An example can be a system consisting of a mechanical
articulated arm with multiple joins. As the arm is moved, the angles of the joins get
tracked and the position is calculated.
Time of Flight (TOF) systems calculate the distance of targets and reference objects,
through pulsating signals. Typically using three or more emitters on the target and three
or more receivers on the reference point [RDB01, p.3]. Advantages of TOF systems are
that they are small and lightweight. Disadvantages are that the accuracy of these systems
is dependent on the temperature, pressure, humidity, and turbulence of its surrounding
[RDB01, p. 4].
Phase Differences (PD) systems are related to the TOF systems. They have the same
composition, with 3 or more emitters and sensors on the target and reference point. The
difference from TOF is that PD emitters send a continuous signal. The receivers compare
the signals to a reference signal from which a relative motion can be calculated. The
continuous signal makes PD systems less sensitive to noise, but the relative calculations
lets errors increase over time. This method provides 6DOF of position and orientation.
The HMD build by Sutherland was working with a PD system [Sut68].
Inertial Sensing (IS) systems internally measure an object’s specific force or angular
rate. An example for an IS system is an accelerometer in smartphones, tracking the
acceleration of the users. These sensors are lightweight and—unlike the TOF systems—
not dependent on other references. As they have no association to their environment, IS
systems typically provide 3DOF of either orientation or position.
Spatial Scanning (SS) systems are optical trackers that use images acquired from a
camera to compute the orientation and/or position of the target object. They have a good
update rate, but rely heavily on the image quality. Subsequently noise, spurious light,
ambiguity of surface and occlusion aggravate the tracking process [RDB01, p.10].
Direct-Field Sensing (DFS) systems use gravitational or magnetic fields to determine
the position and orientation of an object. Magnetic trackers are low-cost, lightweight, and
compact. Named limitations are the small working volume, distortion of accuracy with
distance and that magnetic trackers are sensitive to metallic objects or electromagnetic
noise [RDB01, p.20]. Depending on the implementation they can provide between 1DOF
17(Compass) and 6DOF (Plohemus) [RDB01, p. 20].
Spatial data produced by the prior listed methods is either relative or absolute [SH16,
p. 93]. Absolute spatial data uses a defined CS that was set up beforehand. Relative data
means that it is taken from the difference of two absolute values in the CS – implying
that the CS is dynamically established and the spatial data is relative to a previously
measured position.
The coordinates of spatial data can be global or local [SH16, p. 92]. Global CSs, like
the Earth-centered Earth-fixed or the World Geodetic System define worldwide measure-
ments which use the earth as a reference point. Local CSs define a smaller CS with set up
by the user. In regards to AR, a global CS allows for more freedom of movement and the
use of global registered data (e.g., coordinates). Contrarily a local CSs—with its smaller
sensor infrastructure—will provide a better accuracy.
Sensor Tracking
For mobile devices, like smartphones, sensor tracking capabilities are common by now.
A tracking sensor, often installed inside smartphones, is the gyroscope [SH16, p. 103]. It
is an apparatus that supplies information about the orientation and change of position –
used for mobile gaming (i.e. steering in a racing app) or as a way of position tracking,
if the GPS fails. This is made possible with the measurement of the coriolis force of an
inner reference object. The gyroscope therefore is a local and absolute IS system.
GPS is another sensor tracking technique that uses satellites to triangulate the posi-
tion. Each satellite broadcasts its position together with information about the current
time. GPS devices are able to receive the data, and calculate the position through the
divergently arriving signals – making it absolute and global PD system.
Tracking sensors are utilized for AR, but lack accuracy for complex registration pro-
cesses of AR applications [SH16, p. 105]. For this, optical tracking is a good solution.
Optical Tracking
Digital cameras deliver a continuous amount of data. The individual information of
millions of pixels can also used for the registration tracking in AR. The objects tracked in
received images can be artificial features—meaning deliberately placed in the environment
for the purpose of tracking—or natural features. Features are unique conspicuous specks
inside images, used as a reference to calculate the position or orientation of the tracking
device. Optical tracking requires a reference model to compare the current received image
too. If the reference model is known prior to the beginning of tracking, the tracking
method is called model-based. If the reference model is build during the process of tracking,
the tracking method is called model-free [SH16, p. 106].
Artificial feature tracking is model-based and realized with markers. As seen in Fig-
18Figure 2.8: Typical markers for marker-based tracking
Source: A-Frame, url: https://aframe.io/blog/arjs/, accessed: 12.09.2018
Figure 2.9: Interest points of an outdoor scene, visualized with yellow crosses
Source: Codefluegel, url: https://codefluegel.com/en/beginners-guide-augmented-reality/natural-feature-tracking/, accessed:
12.09.2018
ure 2.8, markers are established patterns with high contrast. In an image processing
algorithm the marker and its edges get detected [CGP+ 15, p. 5]. With a digital model
of the marker and the perspective of the detected marker, the relative orientation and
position of the AR device can be calculated. Markers provide an easy and reliable track-
ing method for 3DOF. To reach 6DOF multiple markers can be used [SH16]. A problem
for marker-based tracking is the possible occlusion of markers with other objects. The
tracking process comes to a halt when the marker is not fully visible anymore.
Natural feature tracking—also known as marker-less tracking—requires better im-
age quality and more computational resources as marker-based tracking methods [SH16,
p. 112]. It can be model-based—having a 3D model of an object—but also allows model-
free tracking [NY99]. A frequently used natural features are interest points. Attributes
for potential interest points in images are that they are highly recognizable points on
objects, that remain stable from many vantage points. As seen in Figure 2.9, edges and
points with high contrast are selected.
19Figure 2.10: HoloLens gestures
Source: Fologram, url: https://learn.fologram.com/hc/en-us/articles/360000919873-Learning-to-use-Voice-Gestures-and-Gaze,
accessed: 12.09.2018
2.1.3 Interaction
In most examples mentioned above, users control the viewpoint and focus of augmented
scene. This passive interaction is called augmented browsing – putting the users in the
role of a passive observer. For more complex interaction with augmented scenes, the
display method and its possible input modalities need to be considered. The known UI
metaphors WIMP (windows, icons, menus, and pointing) do not apply very well to AR
systems [Poe10, p. 8]. The reason for this is that the interaction has to take place in 6DOF
and not on a 2D monitor anymore. The approaches to implement interaction in AR are
strongly diverse and explained in detail in [SH16, Chapter 8]. Generally, the interaction
methods rely on the previously explained tracking methods and can be categorized in
body tracking and tangible user interfaces.
Body Tracking
Many different parts of the body can be used as input for the AR scene. In the previously
mentioned example of a projective display in Section 2.1.1, the application tracks the
users’ body to see if they climbed in the correct order. Actually tracking the body as a
whole is rather unusual as it requires rich sensory input. For most application applying
tracking of the hand, arm, or head is enough. This can be realized by using sensor devices
to track the body part or through optical tracking.
Hand tracking is an especially interesting interaction technology as the hand is the
mainly relied upon tool for manipulating our environment. Together with the flexibility of
the fingers, hands have over 20 DOF and are seen as a potentially foundational interaction
technology for a wide range of application [SKR+ 15]. One of the use cases for hand
tracking is gestures [SH16, p. 282]. The HoloLens for example supports a set of gestures
to interact with the virtual elements in the AR scene (Figure 2.10). Developers can use
these predefined gestures as a way of input for interaction. A bloom gesture for example
can be used to create an object that could be selected via the tab gesture and repositioned.
20(a) all atoms are separate (b) bringing atoms together triggers the reaction
Figure 2.11: Tangible user interface
Source: YouTube, url: https://www.youtube.com/watch?v=Qi3h18wJJiI, time: (a)0:19 (b)0:21, accessed: 12.09.2018
Another example of body tracking is touch. It is especially common for handheld
devices, which are typically equipped with a touchscreen. Users author the position and
orientation of the FOV by moving the device and interact with these objects through the
touchscreen. Selection of an object is realized by touching it through the screen. A ray
detects which objects lies beneath the finger. A problem with touchscreens is that they
only register touch in 2D, where AR would require registration in all three dimensions
[SH16, p. 284].
Tangible User Interfaces
Tangible interfaces allow manipulation of digital objects through the physical environment
– giving physical forms to digital information [Ish08]. It distances itself from the classic
graphical user interfaces and aims to equalize interaction with digital environments and
interactions with the physical environment.
Markers can act as a simple, tangible representation of objects. The physical mark-
ers can be reorganized, relocated and reoriented to affect the digital object. In a demo
of Paradox Design & Development, seen in Figure 2.11, the results reaction of different
elements can be played through with markers [Dev17]. By moving the two markers rep-
resenting hydrogen close to a marker representing oxygen, the oxygen atom absorbs the
other two atoms – creating water.
2.2 Augmented Reality in Education
New ways of teaching and learning with AR have been recognized to a greater extent
by educational researchers. Murat Akçayir and Gökçe Akçayir state in their review of
21literature from 2007 until 2015 that since 2007 the number of studies regarding AR in
education steadily increased over time [AA17]. Their research includes 68 articles. The
reason for the growing interest in AR for educational purpose is the believe that ARs fea-
tures improve the learning process. Studies show enhancements in learning achievement,
learning motivation and improvement of the learners’ engagement in the specific topic
[Rei12, DDM09, YALE17].
Arindam Dey, Mark Billinghurst, Robert W. Lindeman et al. also conducted a liter-
ature review on AR in education, reviewing 32 articles published between 2003 and 2013
[BBFG14]. They found that the main application areas of AR in education are science
(40.6%) and engineering, manufacturing and construction (15.6%). Especially in science,
learners profit from the possibility of AR to visualize and manipulate complex spatial rela-
tionships [WLCL13]. Abstract concepts, or processes that are usually not visible without
expensive equipment can be visualized. Examples for this are magnetic fields, air-flow or
electric circuits.
Both literature studies categorized the target groups, in which AR studies were carried
out, regarding the learners’ level of education. The results of both literature studies were
6
similar, although the categorization differed. In [AA17], K-12 students are the most
preferred sample groups. 51% of the target groups in studies were in K-12 education. For
an explanation the review refers to Piaget’s stages of cognitive development, explaining
that early adolescents must see, hear, or in some other way use their senses to know
[ML13]. In [BBFG14] K-12 has been split up into primary- (18.75%), lower secondary -
(18.75%), and upper secondary education (12.50%), which sums up to 50%. The second
biggest group are university students, which are categorized as bachelor’s or equivalent
level (34.38% in [BBFG14]) and higher education (29% in [AA17]).
Studies have shown that AR benefits learners in multiple ways. [AA17] categorized
these benefits into three fields:
1. Learner outcome
2. Pedagogical contribution
3. Interaction
Learner outcome comprises learning achievement, motivation, and attitude towards
the topic. Pedagogical contributions include things benefiting the ongoing learning process—
making a dull topic interesting—like enhancing enjoyment and raising the level of engage-
ment. Interaction comprises of advantages connected to learners’ interactions, for example
with other students.
In the 62 articles the most dominant advantages of AR in educational settings are
enhancing learning achievement and enhancing learning motivation. 32% of the ana-
lyzed articles mention an enhancement of learning achievements. This means, the test
6 K-12 is a term used to indicate the education from kindergarten to 12th grade
22Figure 2.12: Bernoulli blower with digital augmentation
(See Figure 1 [YALE17])
subjects show improved performance in given tasks. 10% of the articles state that they
confirm a enriched motivation for the given tasks. Often noted pedagogical contributions
are enhancing enjoyment (9%) and raising the level of engagement (8%). These results
stem from multiple forms of evaluation, stretching from detailed evaluation frameworks
[MCJAAP+ 15] over observational studies, like the case-control study [CHP+ 15], to simple
written reflections and interviews from participants [LT13].
Susan Yoon, Emma Anderson, Joyce Lin et al. analyzed the use of AR to enable
conceptual understanding of challenging science content [YALE17]. Three exhibits were
augmented to visualize two airflows keeping a plastic ball afloat (Bernoulli-Effect), seen
in Figure 2.12. Students from 6th to 8th grade took part in a study to measure the
effect of AR. The results showed that ”[…] more AR condition students scored in the
higher levels of understanding.” [YALE17, p. 162] and participants under AR condition
scored significantly higher on a multiple choice test. The authors also noticed a higher
engagement in the AR environment. Two students ”tried to play a game”—a self-directed
experimentation, hence pedagogical contributions—where the students wanted to put the
ball and the airflow in a specific state [YALE17, p. 163].
Rafał Wojciechowski and Wojciech Cellary let students perform chemical experiments
in an AR environment [WC13]. The authors argue that because of the learning-by-doing
paradigm [Rei12] the best and most natural way of learning a task is trying to do it.
Evaluation results showed that the perceived enjoyment is a much more noteworthy fac-
tor than perceived usefulness [WC13, p. 583]. Enjoyment while learning influences the
23willingness of students to use the system during the learning process; while unfamiliar
with interface. The authors assume that, since the learners will become acclimated to
AR, the positive attitude of students to learning in AR environments will fade with time
[WC13, p. 583].
Matt Dunleavy, Chris Dede, and Rebecca Mitchell evaluate a story-driven, location
based AR game, played across the school campus [DDM09]. It teaches math, language,
arts, and scientific literacy skills. Evaluating three schools showed that students did
frequently feel overwhelmed and confused with the material and the applications com-
plexity [DDM09, p. 17]. Students state that they had problems simultaneously learning
the technology and solving problems. However, similar to the previous two examples,
students engagement is reported as really high [DDM09, p. 13]. Reasons for the strong
engagement noted by the students are: using handhelds and GPS to learn, collecting
data outside, distributed knowledge, and positive interdependence and roles in the game
[DDM09, p. 19].
In conclusion, positive effects like learner outcomes and pedagogical contributions lead
to greater attention and recognition towards AR in the context of education. It can be
said that AR holds great promises for enhancing student learning, but as the technology is
still evolving, developers are only starting to figure out effective instructional designs and
appropriate scopes of AR application. At the moment, these applications’ profit heavily
from the ”wow-effect” that the technology provides. It is strengthening the tolerance of
learners towards technical and design issues. Positive effects like these will abate through
the process of getting more familiar with the technology. Therefore, further research on
the restrictions of the technology and the usability of it are important.
24Chapter 3
Related Work
3.1 Augmented Reality in the Context
of Museums and Exhibitions
Augmentation in exhibitions is a common concept. Exhibits are frequently augmented
without any use of special technology. This is done with text, background music, audio
guides or images. Visitors profit from these augmentations, as they can provide additional
information like context or references to related objects. Now, where handheld devices
have enough computing power to create AR experiences, and research on the potentials
of AR have grown, museums start experimenting more with AR in the context of their
exhibitions; both inside and outside of the museum space. They, as an informal learning
environment, profit from the benefits AR provides for learners (stated in Section 2.2).
Even apart from the educational benefits, AR is an appealing medium for museums.
It can bridge the growing digital information with the physical. Furthermore, it can
do that while remaining separate; without interfering with the physical installation of
exhibits. A theoretical unlimited amount of information can be presented for visitors.
Consequentially, AR can enable a highly personalized experiences. Every interest and
preference of visitors can be fulfilled.
Museums use wearable, or handheld AR technologies. They develop application spe-
cially for their exhibitions or use existing software to create an AR experience. To get
an overview about the state of AR in exhibitions and museums, in the following selected
examples are presented and analyzed. The first two are examples specially developed for
the exhibitions, the last example uses a free app as a solution.
25Figure 3.1: AR application Archaic Gallery of the Acropolis Museum
(See Figure 1 [KPR+ 13])
Archaic Acropolis Gallery - Acropolis Museum
The Archaic Acropolis1 Gallery is a permanent exhibition of the Acropolis Museum. It
is a sunlight flooded open space, consisting of sculptures and marble with only little
information about them. Visitors are able to view the exhibits up close and from all sides.
The compositions and detailed surfaces of exhibits are in the focus of this exhibition.
Together with Fraunhofer IGD, and the University of Athens, the Acropolis Museum
designed personalized stories with handheld Augmented Reality [KPR+ 13]. They see AR
as a fitting way to provide contextual information about exhibits.
Their research focused on the problem that:
• Most AR applications aim to replace the landscape of existing digital mediators
• Many research projects propose well grounded ways to AR, but most leave AR’s
integration in the preexisting transmedia landscapes unaddressed
To engage visitors and enhance their learning outcome, a personalized interactive
storytelling application was developed. The research and development is carried out in the
context of the CHESS2 (Cultural Heritage Experiences through Sociopersonal interactions
and Storytelling) project. The application comprises several stories about war, sports,
mythology or the daily life of the archaic acropolis. From these categories visitors are
able to choose stories with regard to their interest. To advance in these stories required
visitors to locate specific exhibits and interact with these. An example is shown in Figure
3.1
The application is implemented with instantAR3 . instantAR was a former free aug-
mented reality browser for iOS and Android. It consisted of a WebKit based browser
component with a powerful, configurable tracking engine. Applications were written as
1 The greece archaic period refers to a period from the eighth century BC until 480 BC, in which great
achievements in the economy, art and intellectual life took place
2 http://www.chessexperience.eu/ accessed: 21.09.2018
3 http://instantar.org/ accessed: 22.10.2018
26websites, with HTML, CSS, Javascript and X3D. X3D is a ISO standard for the represen-
tation of 3D computer graphics with XML. The tracking method used for the application
creates and updates a map of its surroundings while simultaneously calculating its posi-
tion in said map. It was a combination of 3D-feature maps, which were matched with
predefined 3D models of objects inside the room.
Challenges and constraints the authors faced on a technical level are the time con-
suming production of media and assets and the feature detection. The primarily uniform
material and color of the room impedes the feature point detection. From feedback of
visitors, the following problems are recognized:
• more exhibit related information is desired by visitors
• confusion about whether the application is working or not
• large guided groups hinder the AR experience
Users wanted more exhibit related information. Balancing the story line with de-
scriptive annotation was hard. As a possible solution, leveraging the personalization is
proposed.
There was confusion about whether the application is working or not. The tracking
system required users to stand initially in a specific position. Combined with occurring
tracking problems this lead to a negative influence on the experience.
Other visitors were disrupted by users of the application and large guided groups
hinder the AR experience. The application required users to inspect exhibits through
their phones. On busy days the application users, as well as guided groups, are likely to
disturb each other. For a better coexistence between these groups, the authors propose
using a greater working distance of the tracking system along with a bigger flexibility
regarding the position of users.
In the succeeding paper [KES+ 14] about the application a user evaluation was dis-
cussed. The evaluation leads to conflict between attraction, interactivity and information:
”While it is AR’s wow-effect that attracts, our evaluation results show that
when it comes to mediation, users far too often struggle to cope with the system
and interactivity instead of focusing on the information and presentation in
AR.” [KES+ 14, p. 4]
This conclusion corresponds to the effect already mentioned in section 2.2. As a result
of missing interaction design concepts and standards, the occasional struggle to control
the application impedes the focus on the content.
27Bone Hall - Smithsonian Museum of Natural History
The Bone Hall in the Smithsonian Museum of Natural History inhabits close to 300
mounted skeletons [Ins18]. It first opened 1881, three centuries ago, and already had tens
of millions of visitors. Skeletons of mammals, birds, reptiles amphibians, and fishes are
displayed in characteristic poses and labeled filled with their specific scientific terminology.
Problems the exhibitions was facing were:
• a short mean dwell time of visitors
• not much engagement for visitors
The average visitor only spent 1:34 minutes inside of the exhibition [Din17, p. 4]. To
extend the dwell time and to make the experience of visitors more memorable and enjoy-
able, Smithonian4 developed a mobile app named ”Skin & Bones”. The app was released
2015 and is mentioned as ”[…] a great example of using AR app[s] for museum engagement
and as an educational tool.” by the Arts Management & Technology Laboratory [Din17,
p. 4].
The application brings the different fixed specimens to life through AR. When scanning
one of the 13 featured specimens with the mobile camera, a digital model of the specific
animal appears. This digital model superimposes the skeleton with fur, skin, or muscles
or demonstrated the movement of animals through animation. Although AR is the main
focus of the research project, the application provides additional textual and auditory
information as well as video. On each specimen information is categorized in the following
people , objects , physical activities and animals (AR being object). The application is
developed for iOS. Possessors of the app that are not able to visit the exhibition can
download a document from the website to use the app. The document contains images of
the featured exhibits, which act as markers and enable the use of AR.
The concept for the application emerged from the IPOP framework, as one of the
lead developers Diana Marques, explains in an interview [Jos18]. The acronym IPOP
stands for Ideas , People , Objects , Physical activities. It is a theory about experience
preferences, that was developed from observations and interviews from the 1990s until
2014 with visitors of the Smithsonian Institution museums in Washington, D.C. [PSH+ 14].
The framework states that anyone has different levels of interest in the four dimensions,
along with one dimension that is dominant. The framework aims to be predictive. As an
example, a person surveyed and categorized as a idea-person should consume idea content
the most. The framework did not prove to be predictive in the context of the mobile app,
but the authors said the app profited from the diverse content the framework specifies
[Jos18].
In her dissertation Diana Marques investigated the impact of AR on mobile devices
in museums [Mar17]. Two similar research apps were used, only one of them featured the
4 Group of museums and research centers administered in the Government of the United States
28(a) Inside the Bone Hall (b) Skin & Bones app
Figure 3.2: Bone Hall exhibition
Source: Diana Marques, url: http://www.dianamarques.com/portfolio/augmented-reality-app-skin-bones/, accessed: 12.09.2018
AR content which is evaluated in great detail. Overall the case study Skin & Bones shows
great results regarding AR in mobile apps.
• visitors that used AR had much better ratings of their overall visit experience
• mean dwell time increased from 1:34 min to 14:00 min (> 1,000% increase)
[Din17, p. 5]
The author mentions the ”honey pot effect” as a unexpected side effect, that has been
mentioned before but not investigated in depth [Mar17, p. 149]. Social interactions be-
tween visitors increased through the technology used. At the same time some participants
of the study felt social pressure when using the mobile app. They had the impression to
block the view and disturb other visitors. This is a conflict already described in Archaic
Acropolis Gallery.
While the scientific research shows great results, the percentage of visitors download-
ing the app is relatively small [Din17, p. 4]. This is explained through missing free WIFI
and not enough advertisement. Also the app was restricted to iOS, excluding anyone with
an android or windows phone.
The Crusader Bible - Blanton Museum of Art
The Blanton Museum of Art, as a university museum, is known to apply new technolo-
gies in their exhibition [Din17, p. 5]. For their exhibit ”The Crusader Bible: A Gothic
Masterpiece”, they used the Layer5 app. The Crusader Bible is a medieval manuscripts
that contains illustrations and miniatures of old testament events. It is said to ”[…] rank
as one of the incomparable achievements of French Gothic illumination” [Mus18b] Each
plate has descriptive text in Persian, Judeo-persian, and Latin. To give visitors who are
5 https://www.layar.com/ accessed: 22.10.2018
29not able to read any of these languages a chance to gain a deeper understanding about
the exhibits, English translations are desirable. Layer was used to translate the plates
without occluding the exhibition space. The Director of Digital Adaptation of the Blanton
Museum of Art called the project a success.
Layar is a commercial solution for creating a personalized AR experience. It provides
customers with predefined interactive media objects allowing them to overlay desired
objects with videos, text, audio, and images. Furthermore, it can link to websites, provides
social buttons, buttons to buy products, lets users vote via polls and much more. Users
have to download the official Layar app, available for both Android and iOS, to experience
the created scene. Exhibitions use the Layer app as an easy way to create AR experiences
[Mus18a, V2L18, Nex18].
”The app definitely added an additional layer of interpretation that would
have been almost impossible to deliver via traditional labels. Given the subject
matter of the exhibition, visitors were more eager than usual to engage with
the narrative of the works themselves, and the app enabled them to do that.”
[Din17, p. 5]
Apart from that, not much information about the results the app archived are avail-
able. Since the use-case—simple overlay of text—is not complex, further research did not
seem necessary.
In conclusion for the three examples, AR shows a lot of potential to further augment
the exhibition spaces of museums. This potential origins from the positive effects also
mentioned in Section 2.2. It increases the interest and engagement of visitors, which
benefits the knowledge transfer. In most cases the AR applications have been passive
and did not grant much interaction methods. A reason for this could be missing design
concepts and interaction standards for the AR applications. Noticeable is also the social
pressure arising between the visitors who use the application and those how do not, if the
application requires visitors to stand in specific places, and the lower user numbers when
restricting the application to one operating system.
3.2 User- & Interaction Studies
As visualized in Figure 3.3, the development of a technology can be split into three stages:
(1) enthusiasts-, (2) professional-, and (3) consumer stage [Mog07, p. 12] . The first stage
is the enthusiast stage. Excited about the technology, the enthusiasts do not care about
the difficulty of a technology or cost. In the professional stage the number of people
interested in the technology increases. It is the stage where those who buy the technology
are often not the ones who actually use it. In the professional stage the main interest in
30Figure 3.3: Three Stages of technology after [Mog07, p. 12]
the technology is the price, the performance and the support. Office equipment in the
early stages of computing is an example for this. The final stage is the consumer stage,
where non-experts use the technology to pursue their everyday life. The user’s interest
in the technology itself declines. It now lies in what the technology can do for the users.
The acceptance to spent a lot of time learning to use the technology declines as well. If
it is hard to use, people will not purchase it.
Although AR has been researched for 50 years [Sut68], it is still an emerging and
developing technology. It has now surpassed the first stage and starts to be utilized in
a professional manner. Liddles three stages indicate the growing requirement of easy
interaction with the technology as it gains popularity. Already in 2005 J. Edward Swan
II and Joseph L. Gabbard amplified the need to further develop AR systems from a
technology-centric medium to a user-centric medium [SG05]. To further progress as a
technology—and eventually get to the consumer stage—more research about the use of
AR from the perspective of users is required.
A literature research of AR articles from 1992 until 2004 shows that only ~3 percent of
articles focus on human-computer interaction (HCI) [GI08]. Most of the former research
done for AR focuses on engineering challenges associated with developing AR hardware
and software. In current AR research the user is usually not part of the design process
[DBLS18, p. 5].
HCI is a multidisciplinary field that researches the design of interfaces between hu-
mans and computers [AZ13, Chapter 2]. This kind of research is important for emerging
technologies, where clear standards or guidelines for interfaces are yet to be developed.
Research about the interaction with the technology is needed. Especially in the case
of MR, where the technology alters the way humans perceive the interaction space and
the way of interacting itself. Developed style guides and design metaphors, resulting from
the research, would help designers by providing best practices and rules to base their
interfaces on.
The deficiency of HCI research in the context of AR is noticeable in the presented
31examples of Section 3.1 and 2.2. The examples show that AR application that are
interactive—rather than only consisting of passive reading or hearing—quickly leave users
feel overwhelmed by information. Not enough familiarity with and missing guidance of
the systems interface can lead to confusion or frustration, therefore to a more negative
experience of AR itself. Furthermore, it increases user errors and accidents, reducing trust
in the technology and negatively affecting study results.
So what can be done to improve from this state?
More user-based studies and research in the context of interaction are needed. Joseph
L. Gabbard and J. Edward Swan II argue that user-based studies are an important tool
for emerging technologies [GI08].
”[…] the most effective user interfaces for emerging technologies will be grounded
on user-based studies that aim to understand fundamental perceptual and cog-
nitive factors, especially for those technologies that fundamentally alter the
way humans perceive the world (for example, VR, AR, etc.).” [GI08, p. 513]
The development and design of user interfaces is part of usability-engineering (UE).
UE deals with findings from the field of research of HCI, which find their practical use
in UE. The findings of HCI research are decisive for the success of the UE process and
therefore crucial for a good interface design.
In cases of interface design for traditional technology—like mobile phones or desktops—
the UE process can adopt rules from many abundant low level- and general studies in the
context of that technology. For interface design in AR it is hard to find universal and low
level studies to build an application’s interface upon. Consequently, user-based studies in
the UE process and during the development of AR applications are important. Important
as a reference for the application that is being developed as well as for future application
to build their interface upon.
Arindam Dey, Mark Billinghurst, Robert W. Lindeman et al. show that while the
publication of scientific articles about AR has grown over 500% since 2005, the fraction
of articles with user-studies stayed relatively low at 10% [DBLS18].
In regards to the study types the authors found that pilot studies were rarely used
(19% reported) and even more rarely documented (You can also read