EPIFAUNAL COMMUNITY RESPONSE TO ICEBERG-MEDIATED ENVIRONMENTAL CHANGE IN MCMURDO SOUND, ANTARCTICA
←
→
Page content transcription
If your browser does not render page correctly, please read the page content below
Vol. 613: 1–14, 2019              MARINE ECOLOGY PROGRESS SERIES
                                                                                                 Published March 21
https://doi.org/10.3354/meps12899               Mar Ecol Prog Ser

                                                                                                   OPEN
                                                                                                   ACCESS
FEATURE ARTICLE

                  Epifaunal community response
           to iceberg-mediated environmental change
                  in McMurdo Sound, Antarctica
                        Stacy Kim1,*, Kamille Hammerstrom1, Paul Dayton2
                    1
                      Moss Landing Marine Labs, 8272 Moss Landing Rd., Moss Landing, CA 95039, USA
       2
        Scripps Institution of Oceanography, UC San Diego, 9500 Gilman Drive #0227, La Jolla, CA 92093-0227, USA

ABSTRACT: High-latitude marine communities are
dependent on sea ice patterns. Sea ice cover limits
light, and hence primary production and food supply.
Plankton, carried by currents from open water to
areas under the sea ice, provides a transitory food
resource that is spatially and temporally variable.
We recorded epifaunal abundances at 17 sites in
McMurdo Sound, Antarctica, over 12 yr, and found
differences in communities based on location and
time. The differences in location support patterns
observed in long-term infaunal studies, which are
primarily driven by currents, food availability, and
larval supply. The temporal differences, highlighting
2004 and 2009 as years of change, match the altered
persistence of sea ice in the region, caused by the
appearance and disappearance of mega-icebergs.                Benthic communities in Antarctica show temporal shifts in
The temporal changes were driven by changes in                response to changes in sea ice and planktonic food supply.
abundance of species that filter feed on large partic-        Zyzzyzus parvula is one key species.
ulates. The shift in current patterns that occurred due                                              Photo: Rob Robbins
to mega-icebergs decreased the normal food supply
in the region. In addition to the decrease in food
availability, we suggest that the reduced light result-
                                                              icant ecological impacts (Doney et al. 2012). Climate
ing from thicker-than-normal sea ice resulted in a
                                                              change is not limited to increasing temperature, and
shift to smaller phytoplankton. A change in food
quality as well as quantity may have influenced the           ecologically, the most important environmental change
temporal change in epifaunal communities.                     in polar regions is in sea ice (Hoegh-Guldberg &
                                                              Bruno 2010). Rapid warming and ice loss have been
KEY WORDS:         Long-term · Decadal · Benthic ·            occurring in the Arctic and the western Antarctic
Megafauna                                                     (Schofield et al. 2010, Maksym et al. 2012). In con-
                                                              trast, the Ross Sea, Antarctica, has been affected by a
                                                              surface cooling trend due to increased winds and the
                 1. INTRODUCTION                              resulting expansion of sea ice (through 2014). A shift
                                                              in upper atmosphere circulation driven by the ozone
  Polar regions are responding to climate change              hole has resulted in increased westerly winds, more
faster than other regions of our planet (Baettig et al.       sea ice formation in polynyas, and greater sea ice
2007, IPCC 2014), and climate change has had signif-          extent during winter/spring (Cavalieri & Parkinson
                                                              © The authors 2019. Open Access under Creative Commons by
*Corresponding author: skim@mlml.calstate.edu                 Attribution Licence. Use, distribution and reproduction are un-
                                                              restricted. Authors and original publication must be credited.
                                                              Publisher: Inter-Research · www.int-res.com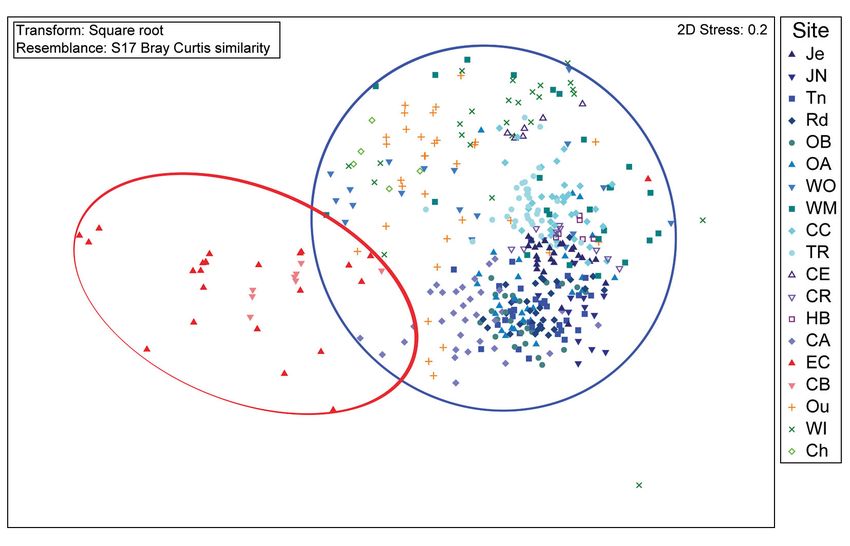
2                                          Mar Ecol Prog Ser 613: 1–14, 2019

2008, Holland & Kwok 2012, Lee & Feldstein 2013).            The Ross Sea is the most productive region of the
In the Ross Sea area, the sea ice season has length-         Southern Ocean, producing > 200 g C m−2 annually
ened by 2 mo, and on the regional scale within               (Smith et al. 2006b). The McMurdo Sound benthos is
McMurdo Sound, the sea ice is refreezing earlier,            nutritionally dependent on primary production from
although it is also retreating further (Kim et al. 2018).    the Ross Sea (Barry & Dayton 1988), with the annual
   The influence of sea ice has for many years pro-          phytoplankton bloom reaching McMurdo Station by
vided a working hypothesis on the underlying factors         local advection and seeding under the sea ice. Cur-
that control the ecosystem function of the high              rents carry plankton southward along the east side of
Antarctic benthos (Dayton & Oliver 1977, Gutt 2001,          the Sound, under the permanent Ross Ice Shelf (Fig. 1).
Norkko et al. 2007, Lohrer et al. 2013), but the chang-      Flow then turns and moves northwards on the west
ing climate is modifying the distribution of ice, and        side of the Sound, but the planktonic community is
consequently light. For the benthos, the amount of           depauperate, and oligotrophic conditions predomi-
light for production is limited by the duration and          nate (Barry & Dayton 1988). On the western side of
thickness of ice and the amount of snow cover pres-          the Sound the sea ice breaks out infrequently, and
ent over it (Eicken 1992, Gomez et al. 2009, Massom          the thickness of the multiyear ice limits light and also
& Stammerjohn 2010). In addition to the productivity         in situ production (Stockton 1984, Dayton et al. 1986,
dynamics, the shallow waters (< 30 m) in some loca-          Kim et al. 2018). The dramatic difference between
tions are regularly physically disturbed due to anchor       planktonic and benthic production in the eutrophic
ice formation, and larger disturbance events ex-             eastern and oligotrophic western Sound has signifi-
tending to greater depths due to icebergs (Lenihan           cant impacts on the structure of the benthic inverte-
& Oliver 1995, Gutt 2001, Brown et al. 2004). In             brate communities (Dayton & Oliver 1977, Dayton et
McMurdo Sound in particular, the sea ice is fast for         al. 1986).
most of the year, and reduces both light availability           Starting in 2000−2001, the oceanographic condi-
and nearshore scouring due to pack ice or growlers.          tions in McMurdo Sound were modified (Arrigo &
Antarctic marine community structure is thus a func-         van Dijken 2003) following calving of the massive
tion of ice and light dynamics (Barnes 1999, Smale           B-15 iceberg and grounding of a portion of it approx-
2007).                                                       imately 100 km northeast of McMurdo Station. This
   Although global changes in the habitat are occur-         mega-iceberg blocked the Sound entrance and dis-
ring, much benthic work in McMurdo Sound has                 rupted both inflowing currents carrying plankton
focused on direct human impacts (Lenihan et al.              from the open Ross Sea, and outflowing sea ice that
1990, 1995, 2003, Lenihan 1992, Lenihan & Oliver             normally allowed increased light levels and trig-
1995, Conlan et al. 2004, 2010). Anthropogenic dis-          gered a bloom of in situ producers during the sum-
turbances are small scale, localized, and well known         mer (Arrigo et al. 2002, Hunt & Hosie 2003, Seibel &
(Dayton & Robilliard 1971, Lenihan et al. 1990, Con-         Dierssen 2003, Remy et al. 2008). The effect of these
lan et al. 2004). Local contamination is intense, but        icebergs was a 40−70% reduction in phytoplankton
overall, the benthic habitat of McMurdo Sound is             production in 2000−2001 and 2002−2003 in the Ross
among the least human-disturbed in the world (Day-           Sea to the north of McMurdo Station, which resulted
ton et al. 1974, Dayton & Oliver 1977 and references         in changes in zooplankton composition (Arrigo et al.
therein). With this low level of small-scale distur-         2002, Arrigo & van Dijken 2003, 2004, Seibel &
bance, McMurdo is well positioned as a prime loca-           Dierssen 2003). The annual summer sea ice break-up
tion for long-term ecological research on decadal            did not reach McMurdo Station between 2000 and
patterns and regime shifts. Regime shifts described          2008, resulting in a massive thickening of the sea ice
in the literature are usually defined on the basis of        (up to 9 m) with associated light reduction, reduced
key species (Francis et al. 1998, Chavez et al. 2003).       light penetration, and reduced access to primary pro-
Very few studies have shown how an entire commu-             duction (both local and advected).
nity responds, although this may be done best in the            During this time there was also a shift in the ben-
benthos (Dayton & Tegner 1984, Tegner et al. 1996,           thic infaunal community, with the abundances of
Tunberg & Nelson 1998).                                      common species decreasing, although no species were
   In McMurdo Sound, an overarching influence on             lost (Conlan et al. 2010, Thrush & Cummings 2011). It
benthic communities is the pattern of current flow           is evident that infaunal individuals are able to sur-
that dictates whether the pelagic food supply from           vive for an extended period of time with low food
the Ross Sea is periodically ample, or meager and            input in the form of photosynthetic production, but it
analogous to the deep sea (Dayton & Oliver 1977).            remains questionable whether they can reproduce

Kim et al.: Antarctic epifaunal changes                                    3

                               Fig. 1. McMurdo Sound, Antarctica, showing study sites

successfully. Antarctic benthic organisms are gener-         tems into much more stable phase shifts (Pauly et al.
alist feeders, with many species switching between           1998, Scheffer et al. 2001). Regime shifts or any large
suspension and deposit feeding (Dayton et al. 1974,          ecosystem phase shift can be a result of the inter-
1994 and references therein, Slattery et al. 1997).          actions of many ecological processes (e.g. compe-
Some taxa that are typically suspension feeders have         tition, disturbance, dispersal; Dayton et al. 1999,
developed adaptations that allow them to feed on the         Thrush et al. 2009). Alternatively, local-scale pro-
sediment surface; they are able to take advantage            cesses may involve simple feedback loops that build
of the short, rich seasonal plankton bloom but are           on each other to produce large-scale shifts (Dayton et
also able to persist on alternative, lower-value food        al. 1999). In various habitats, data have been col-
sources (sensu the ‘food bank,’ Mincks et al. 2005,          lected for decades, and the potential for understand-
Smith et al. 2006a). Thus, the community may be              ing large-scale and long-term processes is exciting.
slow to respond, with individuals persisting for their       One of the challenges that plague such efforts is
(long) Antarctic lifetimes but not replacing them-           incompatibility of data sets in space and/or time
selves in the population, and a slow decline may be          (Bramer 2013). Long-term data sets that have main-
the precursor to a catastrophic population crash.            tained standardized approaches or that have up-
   In a broad perspective, ecologists are working to         graded techniques and completed necessary com-
better understand large-scale and long-term natural          parative studies to preserve continuity are rare
processes, in part to interpret anthropogenically            (Turner et al. 2014, Priscu 2016). Here we present a
driven changes. However, it is difficult to differenti-      standardized long-term data set of the epifaunal ben-
ate alterations due to natural long-term changes,            thic communities in McMurdo Sound, Antarctica,
such as regime shifts, from those induced by cumula-         and evaluate ecological changes with respect to the
tive anthropogenic changes that may drive ecosys-            local climatology.
4 Mar Ecol Prog Ser 613: 1–14, 2019
2. MATERIALS AND METHODS lines for >10 m, reorienting between transects to not
stray too far from the dive hole. To quantify common
2.1. Sites, sampling and taxonomy species, we used 10 replicate still images, and
cropped each image to cover 1 m2. To quantify rare
Nineteen sites in McMurdo Sound, Antarctic (Table species, we used 3 replicate video transects encom-
1, Fig. 1), were sampled between 2002 and 2014, passing 10 m2 each. For the buried species Laternula
though not all sites were sampled in each year due to elliptica, we made in situ counts in 6 replicate 0.5 ×
logistical constraints (Table 2). Each site encompassed 0.5 m (0.25 m2) areas. Species that could not be
at least 20 linear m at 18 m water depth, and was sep- counted as individuals were not quantified (e.g. some
arated from adjacent sites by 30 m or more. Sample hydroids, bryozoans, and sponges). Two 3.1 cm dia-
images were collected by SCUBA divers during the meter, 5 cm deep cores were collected: one for grain
austral spring between September and November size analysis, which was refrigerated until processing;
each year (Fig. S1 in the Supplement at www.int- and one for carbon and nitrogen analysis, which was
res.com/articles/suppl/m613p001_supp.pdf). Still and frozen until analysis. Infaunal core samples were also
video cameras incorporated laser scaling systems collected, and results were published by Conlan et al.
so images were a consistent size and taken at a consis- (2004, 2010); the most recent samples are still being
tent height above the seafloor. Still cameras differed processed and identified.
between years as technology changed; original cam- Organisms visible in each quadrat or transect were
eras used film with a Nyquist limit of approximately identified to the lowest possible taxonomic category
50 lines pairs mm−1, which is equivalent to a pixel size and enumerated. Taxonomy follows that of the World
of approximately 9 µm, and the most recent digital Register of Marine Species (WoRMS, www.marine-
camera images had a pixel size of 350 µm. While species.org/about.php). Individual taxa were counted
recording video transects, divers swam in straight in either quadrats or transects, depending on abun-
Table 1. Locations of sampling sites in McMurdo Sound, Antarctica (see also Fig. 1)
Site Latitude Longitude Habitat description
(South) (East)
Cape Armitage 77° 51.310’ 166° 40.070’ Spicule mat over medium sediments. Very abundant shell debris (Limatula). High light.
Strong currents.
Jetty 77° 51.065’ 166° 40.057’ Fine sediments. High light.
Jetty North 77° 51.080’ 166° 39.985’ Fine sediments. Low organics. Construction activities added gravel-to-cobble debris.
Road 77° 51.008’ 166° 39.708’ Coarse sediments. Grain size decreased after 2003. Construction activities added a
small amount of gravel-to-cobble debris. Spicule mat in 2004.
Transition 77° 50.993’ 166° 39.633’ Medium sediments. Grain size decreased after 2003. Construction activities added a
large amount of gravel-to-cobble debris. Spicule mat in 2014.
Outfall South B 77° 50.933’ 166° 39.400’ Medium sediments. Grain size decreased after 2003. Construction activities added a
large amount of cobble-to-boulder debris. Shell debris (Laternula).
Outfall South A 77° 50.923’ 166° 39.352’ Medium sediments. Grain size decreased after 2003. Construction activities added a
moderate amount of cobble-to-boulder debris. Shell debris (Laternula).
Outfall 77° 50.888’ 166° 39.243’ Fine sediments after 2002. High organics from decomposing sewage.
WQB Outer 77° 50.833’ 166° 38.907’ Thin layer of coarse sediments over frozen sill. Fine organic sediments periodically
added from outfall. Strong currents, some ice scour (e.g. broken Laternula shells).
WQB Middle 77° 50.778’ 166° 39.155’ Chemically contaminated fine sediments. Sand-to-gravel debris periodically added by
construction activities. Dead Laternula in situ.
WQB Inner 77° 50.722’ 166° 39.348’ Chemically contaminated fine sediments. Construction activities added gravel-to-cobble
debris after 2003.
Cinder Cones 77° 48.007’ 166° 40.320’ Coarse sediments. Grain size decreased after 2002. Some ice scour (e.g. seafloor
scarring). Some shell debris (Laternula).
Turtle Rock 77° 44.640’ 166° 46.183’ Coarse sediments on steep slope. Grain size decreased after 2002. Organic input from
local seal colony decreased over time. Shell debris common (Laternula).
Cape Evans 77° 38.498’ 166° 25.118’ Coarse sediment with cobble-to-boulders. High light, encrusting corallines. Some ice
scour (e.g. icebergs present).
Cape Royds 77° 33.464’ 166° 10.084’ Medium sediments with sand-to-cobble. Low organics. Heavy ice scour (e.g. broken
Laternula shells).
Horseshoe Bay 77° 31.564’ 166° 11.986’ Medium sediments with sand-to-gravel. Low organics. Some shell debris (Laternula).
Cape Chocolate 77° 55.922’ 164° 35.555’ Fine sediments with sand-to-gravel. Echinoderm ossicle debris.
Explorers Cove 77° 34.573’ 163° 31.640’ Fine sediments. Low organics.
Cape Bernacchi 77° 31.743’ 163° 47.068’ Fine sediments. Low organics.Kim et al.: Antarctic epifaunal changes 5
Table 2. Number of epifaunal imagery samples collected in McMurdo Sound from 2002 through 2014. The first value is the num-
ber of replicate still images, and the second value is the number of replicate video transects. Blanks: no images taken that year
Site 2002 2003 2004 2007 2008 2009 2010 2011 2012 2014
Cape Armitage 10/3 10/3 10/3 10/3 10/3 10/3 10/3 10/3 10/3 10/3
Jetty 10/0 10/3 10/3 10/3 10/3 10/3 10/3 10/3
Jetty North 10/3 8/3 10/0
Road 10/3 10/3 10/3 7/3 10/3 10/3 10/3 10/3 10/3 10/3
Transition 10/3 10/3 10/0 6/3 10/3 10/3 10/3 10/3 10/3 10/3
Outfall South B 10/1 10/3 10/2 10/3 10/3 10/3 10/3 10/3 10/3
Outfall South A 10/0 10/3 10/2 10/3 10/3 10/3 10/3 10/3 10/3
Outfall 10/3 10/2 10/0 10/3 10/3 10/0 10/3 10/3 10/3
WQB Outer 10/3 0/1 10/2 10/3 10/3 9/0 10/3 10/3
WQB Middle 10/3 0/1 10/2 10/3 10/3 10/0 10/3 10/3
WQB Inner 10/3 0/2 10/2 10/3 10/3 10/0 10/3 10/3 10/3
Cinder Cones 10/3 0/4 11/0 10/3 10/3 10/0 10/3 10/3 10/3 10/3
Turtle Rock 10/3 10/3 10/0 10/3 10/3 10/0 10/3 10/3 10/3
Cape Evans 10/0
Cape Royds 10/0
Horseshoe Bay 10/0
Cape Chocolate 10/0
Explorers Cove 10/0 0/3 10/2 10/3 10/3 8/0 10/3
Cape Bernacchi 10/3 0/2 10/3
dance; we used a comprehensive and consistent spe- Because all samples analyzed tend to log-normal
cies list, and for each site/year, we first analyzed grain size distributions in the 0.04 µm to 2 mm spec-
quadrats, and subsequently transects, limiting the trum, geometric rather than arithmetic statistics were
species list for transects to those that had not been applied to the values obtained by the logarithmically
found in quadrats. The counts were area-adjusted spaced size channels of the particle sizer.
and combined into a single megafaunal data set, For total organic carbon (TOC) and nitrogen analy-
available at the Biological and Chemical Oceanogra- sis, frozen samples were thawed at room tempera-
phy Data Management Office (BCO-DMO; https:// ture and stirred, and approximately 5 g equivalent
www.bco-dmo.org/dataset/745874/data). dry weight subsamples were treated with 5−10 ml of
0.5−1.0 M reagent-grade H2SO4 as needed to remove
all inorganic carbon. Samples were then dried at
2.2. Environmental parameters 60−70°C, visually inspected to ensure complete re-
moval of any carbonate shell fragments, and homo-
Sediment grain size analyses were carried out with genized in a ball-mill. A modification of the high-
a Beckman-Coulter LS 13 320 laser particle size ana- temperature combustion method, using a Wheatstone
lyzer attached to an aqueous module equipped with a bridge current differential, was used in a 440 Ele-
pump and a built-in ultrasound unit. The measured mental Analyzer (Control Equipment). Combustion
size distributions were analyzed from 0.04 µm to 2 mm. was at < 800°C, below the CaCO3 decomposition
Measurements of such a wide particle size range are temperature. The manufacturer’s suggested proce-
possible because the particle sizer is composed of 2 dures were followed on duplicate or triplicate 5−
units: a laser beam for conventional (Fraunhofer) dif- 10 mg aliquots, with sample variance >10% leading
fraction (from 0.4 µm to 2 mm) and a polarized inten- to re-homogenizing and re-running the analysis.
sity differential scatter (PIDS) unit, which measures Calibration was with known standards using ace-
particles based on the Mie theory of light scattering tanilide or L-cystine every 20−30 machine sample
(0.04 µm; Beckman Coulter 2003). The sediment sam- runs, with ± 2% acceptable limits, and detection lim-
ples were dispersed in de-ionized water, and increas- its were 0.2 µg mg−1 carbon and 0.01 µg mg−1 nitro-
ing amounts of the sediment solution were added to gen, dry weight. Quality control was maintained by
the aqueous module of the particle sizer until obscura- analysis of National Research Council of Canada
tion values of 8−12% and PIDS obscuration values of Marine Sediment Reference Material BCSS-1 at the
48−52% were obtained. Data interpolation and statis- beginning and end of each sample analysis set. All
tical analyses were obtained with the laser particle analyzed values were within the suggested criteria
sizer proprietary software (Beckman Coulter 2003). of ± 0.09% carbon, ± 0.008% nitrogen. Sediment data6 Mar Ecol Prog Ser 613: 1–14, 2019
(physical and chemical) are available at the BCO- To determine which species characterized groups
DMO (https://www.bco-dmo.org/dataset/746035/data). and were responsible for differences between groups,
Data on wind velocity and air temperature were we used the SIMPER routine. Analysis was done at
obtained from the University of Wisconsin-Madison the genus/species level rather than aggregating to
Antarctic Meteorological Research Center Program family, as is common for macrofaunal data sets,
(ftp://amrc.ssec.wisc.edu/pub/mcmurdo/climatology/). because in this study, depth was not a variable and
Because sea ice formation and cover is influenced sediment grain size was a measured parameter, so
by conditions during the previous months, data from genus or species replacement within the same family
the summer−winter months (December−September) was not a likely complication.
prior to sample collection were used, e.g. meteoro- To examine changes over years, we used 1-way
logical data from December 2010 through September (year) permutational multivariate analyses of vari-
2011 were paired to biological data from September ance (PERMANOVAs) within each site, with PERM-
2011 to November 2011. ANOVA pairwise comparisons where appropriate.
To determine which of the measured environmen-
tal parameters (sediment characteristics, wind veloc-
2.3. Statistical analysis ity, air temperature) matched observed biotic pat-
terns, we ran the BIO-ENV routine on normalized
We used multi-dimensional scaling (MDS) to pro- environmental parameters, removed correlated fac-
vide a clear graphical display of the similarities (and tors (mode and median grain size, which were corre-
differences) between all sites and times. Abundances lated with mean grain size), and used the BEST
were square root transformed to balance the effects match procedure to determine which environmental
of abundant and moderately abundant species. Bray Euclidian distance resemblance matrices generated
Curtis similarities were then calculated, and similar- from subsets of environmental variables showed the
ity profile analysis (SIMPROF; PRIMER version 6) highest rank-based matrix correlation with the epi-
was used to distinguish groupings by dendrogram. faunal sample Bray-Curtis similarity matrix.
Fig. 2. Multi-dimensional scaling plot showing clustering of sites (see Fig. 1a for site locations). The main cluster (blue circle)
includes sites on the east side of McMurdo Sound. Sites on the west side (red ellipse) group together. In this 2-dimensional
representation, not all clusters are clearly distinct; the site Outfall ( ) is separate (‘Organic’ group), and the site WQB Inner (
) is separate (‘Chemical’ group), as is the Temporal group (see Section 3.1 for full description). Note that the 3-dimensional
stress was an acceptable value at 0.15, although here the easier to visualize 2-dimensional representation is shown. Open sym-
bols indicate sites that were only sampled once. Je: Jetty, JN: Jetty North, Tn: Transition, Rd: Road, OB: Outfall South B, OA:
Outfall South A, WO: Winter Quarters Bay (WQB) Outer, WM: WQB Middle, CC: Cinder Cones, TR: Turtle Rock, CE: Cape
Evans, CR: Cape Royds, HB: Horseshoe Bay, CA: Cape Armitage, EC: Explorers Cove, CB: Cape Bernacchi, Ou: Outfall,
WI: WQB Inner, Ch: Cape ChocolateKim et al.: Antarctic epifaunal changes 7
Table 3. Results of SIMPER analysis showing dominant taxa at each grouping of sites (East, West, Organic, Chemical, and
Temporal), up to a cumulative 90% similarity. Avg.: average, Abun.: abundance, Sim.: similarity, SD: standard deviation,
Contrib.: contributed, Cum.: cumulative. The average similarity within the East grouping was 44.50, West: 41.91, Organic:
28.95, Chemical: 59.77, and Temporal: 54.38
Assemblage Species Avg. Abun. (# m–3) Avg. Sim. Sim./SD Contrib. % Cum.%
East Laternula elliptica 5.69 27.86 1.77 62.60 62.60
Odontaster validus 2.83 9.32 0.76 20.93 83.53
Parborlasia corrugatus 0.92 3.01 0.69 6.77 90.30
West Adamussium colbecki 2.45 28.67 1.38 68.42 68.42
Ophionotus victoriae 0.97 10.95 0.85 26.12 94.54
Organic Sterechinus neumayeri 1.90 13.24 0.85 45.74 45.74
Parborlasia corrugatus 0.89 7.23 0.61 24.96 70.70
Flabegraviera mundata 0.65 3.03 0.41 10.48 81.17
Trematomus bernacchii 0.57 2.93 0.32 10.13 91.30
Chemical Odontaster validus 1.76 54.51 3.26 91.20 91.20
Temporal Laternula elliptica 6.44 19.25 3.29 35.39 35.39
Zyzzyzus parvula 3.75 8.25 1.21 15.16 50.56
Alcyonium antarcticum 2.91 8.14 2.10 14.96 65.52
Edwardsia sp. 1.97 2.58 0.60 4.75 70.27
Pycnogonoidea 1.39 2.49 0.78 4.58 74.85
Isotealia antarctica 0.95 1.90 0.88 3.49 78.34
Sphaerotylus antarcticus 1.08 1.86 0.74 3.43 81.77
Parborlasia corrugatus 1.03 1.85 0.77 3.39 85.16
Sterechinus neumayeri 0.86 1.48 0.67 2.73 87.89
Odontaster validus 0.82 1.44 0.74 2.65 90.53
3. RESULTS able between years in SIMPROF results, but gener-
ally grouped with East side sites in the cluster analysis.
3.1. Statistical groupings
Five large groupings were distinguished by SIM- 3.2. Taxonomic drivers
PROF, as displayed by MDS (Fig. 2, see also Fig. S2).
The groupings confirmed spatial differences estab- Taxa contributing to the SIMPROF groupings
lished by previous studies (Dayton & Oliver 1977, (Table 3, see also Fig. S3) and the differences be-
Conlan et al. 2004, 2010) of sites on the west side of tween them (Table 4) were determined by SIMPER
the Sound, sites near a sewage outfall, sites near a analysis. Between the East side group and the Or-
chemical dumpsite, and sites on the east side of the ganic group (Outfall site), differences were due to the
Sound. The largest was comprised of East side sites clam Laternula elliptica, the seastar Odontaster validus,
Jetty, Jetty North, Transition, Road, Outfall South B, and the urchin Sterechinus neumayeri, with the first
Outfall South A, Winter Quarters Bay (WQB) Outer, 2 defining the East side assemblage, and S. neumay-
WQB Middle, Cinder Cones, and Turtle Rock. Two eri characteristic of the Organic group. The Chemical
of the West side sites (Explorers Cove and Cape group (WQB Inner site) was characterized by rela-
Bernacchi) formed another distinct group. The Out- tively high proportion of O. validus, and differed
fall site was a distinct group, which we designated as from the East side group in L. elliptica and O. validus.
‘Organic.’ WQB Inner was another group of a single Comparing the East and West side groups, differ-
site, designated as ‘Chemical.’ The fifth group was ences were due to L. elliptica, O. validus, and the
temporally separated, including sites along the front scallop Adamussium colbecki, with A. colbecki char-
of McMurdo Station (Road, Transition, Outfall South acterizing the West side assemblage. The later Tem-
A, Outfall South B) after 2004, designated as ‘Tempo- poral group differed from the East side group in the
ral.’ Sites that were sampled only once generally hydroid Zyzzyzus parvula, L. elliptica, the soft coral
formed their own small SIMPROF groups, though on Alcyonium antarcticum, O. validus, and Edwardsia
a grosser scale in the cluster analysis, Cape Choco- sp., with the first 3 characteristic of the Temporal
late clustered with WQB Inner; and Cape Evans, group. Additional species (other than group-defining
Cape Royds, and Horseshoe Bay clustered with the species) that contributed to differences were Parbor-
other East side sites. Cape Armitage was highly vari- lasia corrugatus between Organic and Chemical,8 Mar Ecol Prog Ser 613: 1–14, 2019
Table 4. Results of SIMPER analysis showing contributions of taxa to differences between groupings of sites (East, West, Organic,
Chemical, and Temporal), up to a cumulative 50% dissimilarity. Avg. diss.: average dissimilarity, AA: average abundance, 1 or 2
indicates the group, noted in the comparison column, SD = standard deviation, Contrib.: contributed, Cum.: cumulative
Comparison Avg. diss. Species AA 1 AA 2 Diss./SD Contrib.% Cum.%
East (1) vs. West (2) 95.77 Laternula elliptica 5.69 0.18 1.94 32.15 32.15
Odontaster validus 2.83 0.09 1.04 16.06 48.21
Adamussium colbecki 0.03 2.45 1.33 15.11 63.31
East (1) vs. Organic (2) 83.24 Laternula elliptica 5.69 0.33 1.77 34.25 34.25
Odontaster validus 2.83 0.35 1.02 17.13 51.38
Sterechinus neumayeri 1.00 1.90 1.06 11.70 63.08
East (1) vs. Chemical (2) 80.84 Laternula elliptica 5.69 0.00 2.10 44.04 44.04
Odontaster validus 2.83 1.76 1.28 19.46 63.51
East (1) vs. Temporal (2) 67.43 Zyzzyzus parvula 0.19 3.75 1.49 13.51 13.51
Laternula elliptica 5.69 6.44 1.37 12.63 26.15
Alcyonium antarcticum 0.16 2.91 2.18 10.27 36.42
Odontaster validus 2.83 0.82 1.04 9.09 45.51
Edwardsia sp. 0.60 1.97 0.93 7.72 53.23
Organic (1) vs. Chemical (2) 85.43 Odontaster validus 0.35 1.76 1.59 25.24 25.24
Sterechinus neumayeri 1.90 0.11 1.17 22.94 48.18
Parborlasia corrugatus 0.89 0.37 0.98 12.89 61.08
Organic (1) vs. West (2) 94.68 Adamussium colbecki 0.19 2.45 1.42 23.56 23.56
Sterechinus neumayeri 1.90 0.00 1.11 17.77 41.33
Ophionotus victoriae 0.07 0.97 1.03 10.58 51.91
Organic (1) vs. Temporal (2) 86.91 Laternula elliptica 0.33 6.44 2.59 21.52 21.52
Zyzzyzus parvula 0.07 3.75 1.54 12.68 34.21
Alcyonium antarcticum 0.04 2.91 2.38 9.94 44.15
Edwardsia sp. 0.16 1.97 0.91 6.43 50.58
Chemical (1) vs. West (2) 95.39 Adamussium colbecki 0.05 2.45 1.73 32.55 32.55
Odontaster validus 1.76 0.09 2.13 26.12 58.67
Chemical (1) vs. Temporal (2) 92.27 Laternula elliptica 0.00 6.44 3.08 23.47 23.47
Zyzzyzus parvula 0.00 3.75 1.57 13.35 36.82
Alcyonium antarcticum 0.00 2.91 2.48 10.49 47.31
Edwardsia sp. 0.05 1.97 0.90 6.64 53.94
West (1) vs. Temporal (2) 97.23 Laternula elliptica 0.18 6.44 2.88 20.40 20.40
Zyzzyzus parvula 0.03 3.75 1.56 11.86 32.26
Alcyonium antarcticum 0.02 2.91 2.47 9.31 41.58
Adamussium colbecki 2.45 0.02 1.43 7.69 49.26
Edwardsia sp. 0.00 1.97 0.89 5.97 55.23
Ophionotus victoria between West and Organic, and Table 5. One-way PERMANOVA results for community
Edwardsia sp. between Temporal and Organic, and differences between years, within each site
Temporal and Chemical.
Site Pseudo-F p
Cape Armitage 6.2317 0.001
3.3. Temporal patterns Jetty North 11.1500 0.001
Jetty 8.4097 0.001
Road 5.0034 0.001
A subtler temporal pattern of change that was not
Transition 4.9325 0.001
obvious in the SIMPROF and cluster analysis showed Oufall South B 4.3032 0.001
in the results of PERMANOVAs, with 2004 and 2009 Outfall South A 4.0254 0.001
standing out as years of change. At all sites, com- Outfall 4.5410 0.001
WQB Outer 4.2014 0.001
munities were significantly different between years
WQB Middle 2.6553 0.004
(Table 5). Post hoc pairwise comparisons were done WQB Inner 2.6185 0.001
to determine which years were different; following Cinder Cones 9.6984 0.001
Anderson et al. (2008) we leave the p-values uncor- Turtle Rock 4.8926 0.001
Explorers Cove 2.8135 0.001
rected but recognize only those differences that are Cape Bernacchi 3.2670 0.022
significant for the majority of years. At 6 sites (Jetty,Kim et al.: Antarctic epifaunal changes 9
Table 6. Significant PERMANOVA pairwise test results. Bold indicates significant differences in the majority of comparisons
at the p < 0.05 level. Dashes indicate comparisons that could not be made because years were not sampled; blanks are where
years cannot be compared to themselves
Site − Year 2002 2003 2004 2007 2008 2009 2010 2011 2012 2014
Cape Armitage − 2009 0.011 0.015 0.098 0.028 0.242 0.036 0.017 0.013 0.012
Jetty North − 2004 0.019 0.013 − − − − − − −
Jetty − 2004 − − 0.013 0.011 0.013 0.017 0.012 0.015 0.008
Transition − 2004 − – 0.015 0.013 0.016 0.009 0.011 0.009 0.018
Outfall South A − 2002 0.016 0.040 0.012 0.012 0.016 0.012 0.013 0.012 −
Outfall − 2004 0.012 0.022 0.039 0.013 0.267 0.018 0.017 0.027 −
Outfall − 2009 0.012 0.018 0.267 0.179 0.098 0.023 0.016 0.036 −
WQB Outer − 2009 0.029 − 0.253 0.029 0.035 0.013 − 0.027 −
WQB Middle − 2004 0.100 0.325 0.106 0.112 0.041 0.116 − 0.099 −
WQB Inner − 2009 0.083 0.133 0.074 0.030 0.068 0.020 0.011 0.016 −
Cinder Cones − 2004 0.921 0.027 0.023 0.044 0.012 0.009 0.013 0.009 0.015
Turtle Rock − 2004 0.494 0.011 0.195 0.014 0.163 0.021 − 0.191 0.013
Turtle Rock − 2009 0.834 0.012 0.163 0.601 0.019 0.171 − 0.726 0.012
Explorers Cove − 2002 0.010 0.082 0.032 0.025 0.550 0.025 − − −
Explorers Cove − 2009 0.550 0.012 0.177 0.309 0.038 0.083 − − −
Jetty North, Transition, Outfall, Cinder Cones, and the East side sites (Jetty, Jetty North, Transition,
Turtle Rock), communities in 2004 were different Outfall, Cinder Cones, and Turtle Rock). A similar
from other years (Table 6, see also Table S1). At 4 shift in infaunal communities was observed by Con-
sites (Cape Armitage, Outfall, WQB Outer, and WQB lan et al. (2010) that began in 2003, and correlated
Inner), communities in 2009 were different from with the initiation of wastewater treatment at
other years. Four sites (Road, Outfall South B, WQB McMurdo Station in January 2003. However, Conlan
Middle, and Cape Bernacchi) had no significant pair- et al. (2010) distinguished between sewage-impacted
wise comparisons despite overall test significance. and non-impacted infaunal communities and noted
Communities in 2002 were significantly different at that changes occurred in both, suggesting that the
2 sites (Outfall South A and Explorers Cove). larger-scale phenomenon of mega-icebergs blocking
McMurdo Sound, which began in 2000, also influ-
enced the change. The mega-icebergs changed the
3.4. Environmental parameters current pattern and provision of planktonic food to
McMurdo Sound (Arrigo et al. 2002, Arrigo & van
Measured environmental conditions did not gener- Dijken 2003), and also decreased the incident light
ally correlate with community structure. Results of by preventing movement of sea ice, which thickened
BEST analysis indicated that none of the measured into multi-year ice, further lowering productivity
factors, i.e. sediment grain size, sediment TOC, sedi- (Thrush & Cummings 2011). The epifaunal commu-
ment N, wind, or air temperature, was strongly cor- nity difference we observed occurred 1 yr later than
related with the spatial or temporal distribution of the infaunal shift (sensu Thrush & Cummings 2011).
benthic communities. The best variable combination It is possible that the larger epifaunal animals have
had fairly low correlation (ρ = 28%), and was pri- sufficient food stores to delay the impacts of starva-
marily driven by the percentage of sediment in the tion, and also that enough of them are mobile, includ-
64−500 µm range, along with TOC, skewness, kur- ing the key species Odontaster validus and Sterechi-
tosis, and to a lesser extent percent sediment in the nus neumayeri, so that they can rapidly move into or
< 63 µm range. out of an area as conditions change. Under low light
conditions, the echinoderms may have migrated to
shallower depths where there was better growth of
4. DISCUSSION benthic diatoms, and returned once the sea ice and
light had normalized. The sessile species Zyzzyzus
4.1. Temporal patterns parvula, Laternula elliptica, and Alcyonium antarcti-
cum also contributed to the shift in 2004. The tempo-
The main temporal change observed was a differ- rary loss of the highly mobile and predatory species
ence in 2004, which occurred at some, but not all, of (O. validus and S. neumayeri) may have eliminated a10 Mar Ecol Prog Ser 613: 1–14, 2019
recruitment filter that allowed the 3 sessile species to
establish populations (sensu Dayton et al. 2016b).
In 2009, the epifaunal communities were different
from other years at the chemically and organically
contaminated sites, i.e. WQB Inner and Outfall,
respectively, and Cape Armitage and WQB Outer.
Additionally, at Turtle Rock and Explorers Cove, com-
munities in 2009 may also have differed, although a
low number of pairwise comparisons were signifi-
cantly different (3/8 years and 2/6 years, respectively;
Table 6). The mega-icebergs cleared McMurdo Sound
in 2005, but the sea ice in the Sound did not clear
completely until 2008. We hypothesize that this latter
epifaunal difference was also due to the movement of
the mega-icebergs and clearing of the sea ice. Rather
than the negative mechanism of motile species leav-
ing due to lack of food, it may have been a positive
mechanism with the same motile species moving to
areas of high food concentrations (Kim et al. 2007).
While Thrush et al. (2006) concluded that iceberg
disturbance, light availability, and advection of plank-
tonic food (proximity to open water), control benthic
communities in McMurdo Sound, we note that ice
disturbance and food availability may be inter-
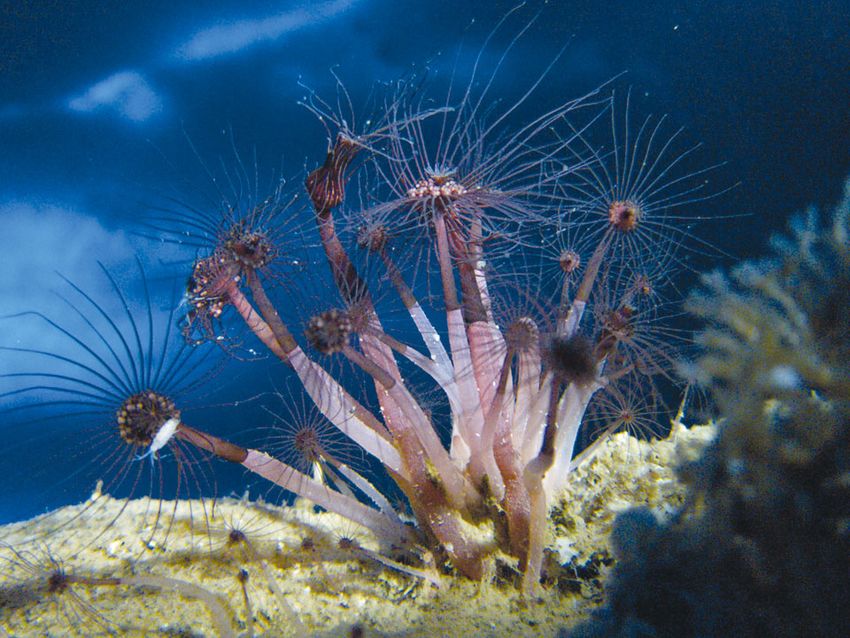
Fig. 3. Comparative abundance of epifauna in each spatially
twined. At Cinder Cones, we observed large ‘falls’ of separated group, for each year sampled. Species were sepa-
Beggiatoa extending from a substantial ice distur- rated into feeders on (A) large particulates or (B) small par-
bance in shallow water that had moved sediment and ticulates. Table S2 in the Supplement lists feeding type des-
killed infauna in 2009, creating a food source for ignations. Abundances of all species within a feeding type
were summed, and because overall abundances varied sig-
scavengers like O. validus and S. neumayeri (Thurber nificantly between sites, these values were standardized by
et al. 2017, S. Kim unpubl. data). Other benthic the total for all years. To calculate the comparative abun-
studies in McMurdo Sound (Norkko et al. 2007) also dance at all sites within a group, standardized abundances
found that the type of food available and utilized were summed relative to the number of sites. Sites that were
sampled in 2 or fewer years were not included. Years that
(detrital or fresh) was dependent on ice cover.
were not sampled are indicated by values of −0.01
The only other year of community differences (2002
at Outfall South A and Explorers Cove) was after
mega-iceberg emplacement, and may indicate a The spatially widespread nature of the shifts,
more rapid community response at these particular encompassing the East and West Sound, further sup-
sites. Dayton et al. (2016b) reported a massive sponge ports a causal factor on the scale of the mega-ice-
recruitment event on artificial substrates that encom- bergs influencing food availability. Dayton et al.
passed both the east and west sides of McMurdo (2019) hypothesized that there has been an addi-
Sound in 2002−2004. Interestingly, equivalent recruit- tional shift in the size of food particulates, driven by
ment did not occur on natural substrates, possibly increased glacial melt and nutrient input. The more
prevented by a larval filter (Dayton et al. 2016b). frequently collected epifaunal data from our study
Although we have no data prior to 2002, the changes suggest that the community shift was temporary. For
we observed through 2004 support the occurrence of the East side group, animals that feed on large partic-
an ecological shift in the same time frame. The tem- ulates were less abundant in 2003−2010, and more
poral shifts observed here may predict spatial differ- abundant in 2002 and 2011−2014, while small par-
ences at other (more southern) locales with more ice ticulate feeders were the opposite, with higher abun-
cover/less light availability (sensu Cummings et al. dances in 2010−2012 and lower abundances in
2018). Extensive regional studies (Cummings et al. 2002−2009 and 2014 (Fig. 3, Table S2). Both the
2006, 2018, Lohrer et al. 2013) have shown that dif- Organic and Chemical groups followed the same
ferences in sea ice cover, through light availability, general pattern. In the West side group, the pattern
impact the spatial distribution of benthic communities. was not clear. Animals that feed on small particulatesKim et al.: Antarctic epifaunal changes 11
Table 7. Comparison with species abundances (# m–2, mean ± SE) dances were low in 2002, 2003, and 2007. A.
from Dayton et al. (2019) in earlier years. For Odontaster validus:
antarcticum distribution was similar; it was
initial = 1967, this study = 2002−2014; for Adamussium colbecki
and Laternula elliptica: initial = 1977, this study = 2002−2010 found on hard substrates, not at chemically con-
taminated sites, and increased in latter years.
Both of these species feed on large particulates,
Species (site) Initial 2010 This study
and their increase is further suggestive of com-
Odontaster validus 13.00 ± 2.89 2.80 ± 0.48 3.11 ± 3.38 munity recovery from the lean mega-iceberg
(Cape Armitage) years. We note that a complicating factor is the
Adamussium colbecki 7.70 ± 3.04 1.27 ± 0.56 5.93 ± 9.56 past and ongoing release of gravel- to boulder-
(Explorers Cove) sized sediments from activities at McMurdo
Laternula elliptica 22.64 ± 11.47 0.00 ± 0.00 0.38 ± 0.49 Station. In the early 1960s, all of the station
(Explorers Cove)
front sites were entirely fine sediments, but
now they include varying levels of added
coarse debris (S. Kim et al. unpubl. data). These
were very abundant in 2008, and less so both before provide substrate for settlement of sessile organisms
and after. This supports the mega-icebergs, which and may lead to increases in abundances over time;
were also temporary, as the main causal factor, al- however, the majority of the additional sediment was
though there appears to be a 3−6 yr lag in the system, added prior to 2002 at Outfall South B, Transition,
at least for the epifauna. Outfall South A, Jetty North, Road, and Jetty (in
decreasing order of disturbance). WQB Middle and
Inner are more strongly and recently impacted be-
4.2. Species contributions cause of their proximity to the ice pier, where terres-
trial sediments are used annually for construction
The species characteristic of the East side grouping and maintenance. WQB Inner is additionally impacted
were O. validus and L. elliptica. Abundances of O. by clearing of drainage ditches around McMurdo,
validus were overall much higher at Cinder Cones which leads to heavy runoff of melt-water transport-
and Turtle Rock, as well as at Cape Evans and Horse- ing fine sediments to the site. However, the extreme
shoe Bay; the latter 2 were sampled only once each. chemical contamination of these sites may prevent
These 4 sites are all at the northern end of McMurdo settlement and survival of many organisms.
Sound, although O. validus were not abundant at S. neumayeri, which was characteristic of the
Cape Royds, the other northern site. O. validus were Organic group (Outfall site), also had high abun-
additionally found at 1 West side site, Cape Choco- dances at Turtle Rock, but was low at WQB Inner,
late, but not at Explorers Cove or Cape Bernacchi. An WQB Middle, and WQB Outer, as well as the West
extremely opportunistic motile species, O. validus side sites Cape Bernacchi and Explorers Cove, and in
is very patchily distributed depending on local food 2003. Like other echinoderms, S. neumayeri is sensi-
sources. L. elliptica was present only in very low tive to chemical stressors but not to organic con-
numbers at both Organic and Chemical sites, as well tamination (Lenihan et al. 2003), and is widely op-
as at all West side sites. One commonality between portunistic and motile and consequently patchily
these sites is the presence of stressors, either contam- distributed. A. colbecki, characteristic of the West side
inants or lack of food; L. elliptica may be more sensi- community, generally increased during the 2003−
tive than other species. We can also make compar- 2004 time frame. These scallops are quite motile and,
isons with earlier data collected at Cape Armitage in like O. validus and S. neumayeri, may track local
1967, and Explorers Cove 1974−1979 (Table 7). Day- food resources such as the outflow of phytoplankton-
ton et al. (2019) noted a decrease in 3 important spe- rich water from the nearshore freshwater moat at
cies, O. validus at Cape Armitage and L. elliptica and Explorers Cove (Dayton et al. 2019). Dayton et al.
Adamussium colbecki at Explorers Cove, between (2019) noted a decrease in A. colbecki between the
initial sampling years and 2010. Our data confirm 1970s and 2010; however, the abundance of A. col-
that the decrease is persistent in O. validus and L. becki was highly variable between 2002 and 2010
elliptica, and occurred before 2002. (Table 7), suggesting that the previously noted de-
The Temporal group key species were Z. parvula crease is not a long-term pattern. An apparent re-
and A. antarcticum. Z. parvula was abundant at sites cruitment event of this species also occurred on the
that had occasional chunks of hard substrate, but east side in 2008, or earlier enough that the bivalves
not if there was chemical contamination. Abun- were visible in images in 2008.12 Mar Ecol Prog Ser 613: 1–14, 2019
4.3. Environmental and spatial details the community change was not entirely due to tran-
sient mobility. We have shown that Antarctic epi-
If difference in available food was the mechanism faunal communities, so long considered stable on
of change, we might expect to observe correlations century scales, are dynamic on the time scale of years.
with sediment TOC, which we did not. However, our
samples were collected early in the spring, before the
Acknowledgements. Numerous people contributed to this
annual bloom, and may not fully reflect seasonal food
paper over the many years of data collection and analysis,
availability. and we are grateful to all of them. Key people we want to
Sites that were sampled only once confirmed the thank include John Oliver, Jim Oakden, Dan Malone, Jen
overall spatial pattern of community differences. East Fisher, Rusty Fairey, Clint Collins, and D. J. Osborne. We
are also indebted to the many McMurdo Station support
side sites were generally similar to sites in the same
personnel, especially Rob Robbins and Steve Rupp. Finan-
spatial area. However, Cape Chocolate on the west cial support was provided by ABA, CC&R, the David and
side of the sound was not like other West side sites Judy Zaches Foundation, and NSF grant numbers OPP-
and instead was similar to the chemically contami- 0126319, OPP-0619622, OPP-0944557, ANT-0842064, and
nated site WQB Inner. Cape Chocolate extends past ANT-0944747. Any opinions, findings, and conclusions or
recommendations expressed in this material are those of the
a small island at the southern end of Salmon Bay, a authors and do not necessarily reflect the views of the NSF.
location that underwent a massive flood and sedi-
ment deposition event sometime between 1990 and
2010 (Dayton et al. 2016a). It is possible that the LITERATURE CITED
resemblance between the sites is because both were
Anderson MJ, Gorley RN, Clarke RK (2008) PERMANOVA+
severely disturbed, although the mechanisms of dis- for PRIMER: guide to software and statistical methods.
turbance were different. Primer-E, Plymouth
Arrigo KR, van Dijken GL (2003) Impact of iceberg C 19 on
Ross Sea primary production. Geophys Res Lett 30:1836
Arrigo KR, van Dijken GL (2004) Annual changes in sea-ice,
4.4. Summary chlorophyll a, and primary production in the Ross Sea,
Antarctica. Deep Sea Res II 51:117–138
In eastern McMurdo Sound, a community change Arrigo KR, van Dijken GL, Ainley DG, Fahnestock MA,
took place in 2004, and a less widespread one in Markus T (2002) Ecological impact of a large Antarctic
iceberg. Geophys Res Lett 29:1104
2009. We suggest this was due to the temporary pres- Baettig MB, Wild M, Imboden DM (2007) A climate change
ence of mega-icebergs at the mouth of McMurdo index: where climate change may be most prominent in
Sound, in support of conclusions made previously by the 21st century. Geophys Res Lett 34:L01705
Conlan et al. (2010, for infauna) and Dayton et al. Barnes DK (1999) The influence of ice on polar nearshore
benthos. J Mar Biol Assoc UK 79:401–407
(2019). The mega-icebergs entered the Sound in
Barry JP, Dayton PK (1988) Current patterns in McMurdo
2000 and left in 2005; thus, on the east side of the Sound, Antarctica and their relationship to local biotic
Sound, there appears to be a lag of 4 yr between a communities. Polar Biol 8:367−376
shift in food resources and detectable change in the Beckman Coulter (2003) LS 13 320 particle size analyzer
epifaunal community. The shift was earlier on the manual PN 7222061A. Beckman Coulter, Inc., Miami, FL
Bramer M (2013) Principles of data mining. Springer Pub-
westside, already underway between 2002 and 2003, lishing Company, London
suggesting the community in this food-poor region is Brown KM, Fraser KP, Barnes DK, Peck LS (2004) Links be-
more immediately responsive to changes in food tween the structure of an Antarctic shallow-water com-
availability. West side sampling ceased in 2010 and munity and ice-scour frequency. Oecologia 141:121−129
Cavalieri DJ, Parkinson CL (2008) Antarctic sea ice varia-
we did not see a change between 2009 and 2010; it is
bility and trends, 1979–2006. J Geophys Res Oceans 113:
possible that the West side community is not only C07004
quicker to starve to but also slower to recover. Chavez FP, Ryan J, Lluch-Cota SE, Ñiquen M (2003) From
The community shifts may be due to a difference in anchovies to sardines and back: multidecadal change in
the Pacific Ocean. Science 299:217−221
quality of food (size of particulates) as well as quan-
Conlan KE, Kim SL, Lenihan HS, Oliver JS (2004) Benthic
tity. Several key species in this system are mobile and changes during 10 years of organic enrichment by
quickly respond to shifting food sources. This leads to McMurdo Station, Antarctica. Mar Pollut Bull 49:43−60
patchy distributions and high variability. Key species Conlan KE, Kim SL, Thurber AR, Hendrycks E (2010) Ben-
also generally feed on large particulates (among thic changes at McMurdo Station, Antarctica following
local sewage treatment and regional iceberg-mediated
other things) and were less abundant at 18 m depth productivity decline. Mar Pollut Bull 60:419−432
during the iceberg years. A concomitant increase in Cummings V, Thrush S, Norkko A, Andrew N, Hewitt J,
sessile, small-particulate feeders demonstrates that Funnell G, Schwarz AM (2006) Accounting for local scaleKim et al.: Antarctic epifaunal changes 13 variability in benthos: implications for future assessments Climate change 2014 — impacts, adaptation and vulnera- of latitudinal trends in the coastal Ross Sea. Antarct Sci bility: regional aspects. Cambridge University Press, 18:633−644 Cambridge Cummings VJ, Hewitt JE, Thrush SF, Marriott PM, Halliday Kim SL, Thurber A, Hammerstrom K, Conlan K (2007) NJ, Norkko AM (2018) Linking Ross Sea coastal benthic Seastar response to organic enrichment in an oligotro- communities to environmental conditions: documenting phic polar habitat. J Exp Mar Biol Ecol 346:66−75 baselines in a spatially variable and changing world. Kim S, Saenz B, Scanniello J, Daly K, Ainley D (2018) Local Front Mar Sci 5:232 climatology of fast ice in McMurdo Sound, Antarctica. Dayton PK, Oliver JS (1977) Antarctic soft-bottom benthos in Antarct Sci 30:125−142 oligotrophic and eutrophic environments. Science 197: Lee S, Feldstein SB (2013) Detecting ozone- and greenhouse 55−58 gas-driven wind trends with observational data. Science Dayton PK, Robilliard GA (1971) The benthic community 339:563−567 near McMurdo station. Antarct J US 6:54–56 Lenihan HS (1992) Benthic marine pollution around McMurdo Dayton PK, Tegner MJ (1984) Catastrophic storms, El Niño, Station, Antarctica: a summary of findings. Mar Pollut and patch stability in a southern California kelp commu- Bull 25:318–323 nity. Science, 224:283–285 Lenihan HS, Oliver JS (1995) Anthropogenic and natural Dayton PK, Robilliard GA, Paine RT, Dayton LB (1974) disturbances to marine benthic communities in Antarc- Biological accommodation in the benthic community at tica. Ecol Appl 5:311–326 McMurdo Sound, Antarctica. Ecol Monogr 44:105–128 Lenihan HS, Oliver JS, Oakden JM, Stephenson MD (1990) Dayton PK, Watson D, Palmisano A, Barry JP, Oliver JS, Intense and localized benthic marine pollution around Rivera D (1986) Distribution patterns of benthic micro- McMurdo Station, Antarctica. Mar Pollut Bull 21:422–430 algal standing stock at McMurdo Sound, Antarctica. Lenihan HS, Kiest KA, Conlan KE, Slattery PN, Konar BH, Polar Biol 6:207−213 Oliver JS (1995) Patterns of survival and behavior in Dayton PK, Mordida BJ, Bacon F (1994) Polar marine com- Antarctic benthic invertebrates exposed to contaminated munities. Am Zool 34:90−99 sediments: field and laboratory bioassay experiments. Dayton PK, Tegner MJ, Edwards PB, Riser KL (1999) Tempo- J Exp Mar Bio Ecol 192:233–255 ral and spatial scales of kelp demography: the role of Lenihan HS, Peterson CH, Kim SL, Conlan KE and others oceanographic climate. Ecol Monogr 69:219−250 (2003) Variation in marine benthic community composi- Dayton PK, Hammerstrom K, Jarrell SC, Kim S, Nordhausen tion allows discrimination of multiple stressors. Mar Ecol W, Osborne DJ, Thrush SF (2016a) Unusual coastal flood Prog Ser 261:63−73 impacts in Salmon Valley, McMurdo Sound, Antarctica. Lohrer AM, Cummings VJ, Thrush SF (2013) Altered sea ice Antarct Sci 28:269−275 thickness and permanence affects benthic ecosystem Dayton P, Jarrell S, Kim S, Thrush S, Hammerstrom K, Slat- functioning in coastal Antarctica. Ecosystems 16:224−236 tery M, Parnell E (2016b) Surprising episodic recruitment Maksym T, Stammerjohn SE, Ackley S, Massom R (2012) and growth of Antarctic sponges: implications for eco- Antarctic sea ice — a polar opposite? Oceanography 25: logical resilience. J Exp Mar Biol Ecol 482:38−55 140−151 Dayton PK, Jarrell S, Kim S, Parnell P, Thrush S, Hammer- Massom RA, Stammerjohn SE (2010) Antarctic sea ice strom K, Leichter J (2019) Benthic responses to an Ant- change and variability−physical and ecological implica- arctic regime shift: food particle size and recruitment tions. Polar Sci 4:149−186 biology. Ecol Appl 29:e01823 Mincks SL, Smith CR, DeMaster DJ (2005) Persistence of Doney SC, Ruckelshaus M, Duffy JE, Barry JP and others labile organic matter and microbial biomass in Antarctic (2012) Climate change impacts on marine ecosystems. shelf sediments: evidence of a sediment ‘food bank’. Mar Annu Rev Mar Sci 4:11−37 Ecol Prog Ser 300:3–19 Eicken H (1992) The role of sea ice in structuring Antarctic Norkko A, Thrush SF, Cummings VJ, Gibbs MM, Andrew ecosystems. In: Hempel G (ed) Weddell Sea ecology. NL, Norkko J, Schwarz AM (2007) Trophic structure of Springer, Berlin, p 1–13 coastal Antarctic food webs associated with changes in Francis RC, Hare SR, Hollowed AB, Wooster WS (1998) sea ice and food supply. Ecology 88:2810−2820 Effects of interdecadal climate variability on the oceanic Pauly D, Christensen V, Dalsgaard J, Froese R, Torres F (1998) ecosystems of the NE Pacific. Fish Oceanogr 7:1−21 Fishing down marine food webs. Science 279:860−863 Gómez I, Wulff A, Roleda MY, Huovinen P and others (2009) Priscu JC (2016) Unraveling ecosystem responses to climate Light and temperature demands of marine benthic change on the Antarctic continent through long-term microalgae and seaweeds in polar regions. Bot Mar 52: ecological research. Bioscience 66:799−800 593–608 Remy JP, Becquevort S, Haskell TG, Tison JL (2008) Impact Gutt J (2001) On the direct impact of ice on marine benthic of the B-15 iceberg “stranding event” on the physical communities, a review. Polar Biol 24:553−564 and biological properties of sea ice in McMurdo Sound, Hoegh-Guldberg O, Bruno JF (2010) The impact of climate Ross Sea, Antarctica. Antarct Sci 20:593–604 change on the world’s marine ecosystems. Science 328: Scheffer M, Carpenter S, Foley JA, Folke C, Walker B (2001) 1523−1528 Catastrophic shifts in ecosystems. Nature 413:591−596 Holland PR, Kwok R (2012) Wind-driven trends in Antarctic Schofield O, Ducklow HW, Martinson DG, Meredith MP, sea-ice drift. Nat Geosci 5:872−875 Moline MA, Fraser WR (2010) How do polar marine eco- Hunt BP, Hosie GW (2003) The Continuous Plankton Re- systems respond to rapid climate change? Science 328: corder in the Southern Ocean: a comparative analysis of 1520−1523 zooplankton communities sampled by the CPR and verti- Seibel BA, Dierssen HM (2003) Cascading trophic impacts of cal net hauls along 140° E. J Plankton Res 25:1561–1579 reduced biomass in the Ross Sea, Antarctica: Just the tip IPCC (Intergovernmental Panel on Climate Change) (2014) of the iceberg? Biol Bull (Woods Hole) 205:93−97
You can also read