Equity Valuation Coca-Cola Company - Maximilian Stuerner - Repositório ...
←
→
Page content transcription
If your browser does not render page correctly, please read the page content below
Equity Valuation
 Coca-Cola Company

 Maximilian Stuerner

 Dissertation written under the supervision of
 Prof. António Borges de Assunção,
 with the collaboration of industry expert
 José Tudela Martins

Dissertation submitted in partial fulfilment of requirements for the MSc in
 Finance, at the Universidade Católica Portuguesa, 6thJanaury 2021.
Equity Valuation – Coca-Cola Católica-Lisbon School Maximilian Stuerner | 2021

Abstract

Title: Equity Valuation – Coca-Cola Company

Author: Maximilian Stuerner

This dissertation covers the equity valuation of The Coca-Cola Company, the largest non-
alcoholic beverage company in the world. The main objective of this thesis is to provide an
investment recommendation based on the estimated equity value of the company. Throughout
the paper, all major issues are addressed in order to provide an accurate valuation. First,
different valuation approaches are explored, followed by an overview of the company and the
external environment. Finally, the forecasting assumptions are shown and concluded with a
comparison of the result of this thesis with the Deutsche Bank report. In addition to the DCF
valuation approach, the relative valuation was chosen to test the assumptions and compare
them to the current market values. Finally, through both increasing and gradual cost efficiency
as well as through revenue growth in growing markets and segments, a buy recommendation
is given, based on the DCF approach of $61.28 per share.

Keywords: The Coca-Cola Company, Beverages, Equity Valuation, Discounted Cash Flow,
Relative Valuation

 1
Equity Valuation – Coca-Cola Católica-Lisbon School Maximilian Stuerner | 2021

 Resumo

ítulo: Avaliação de Acções - Coca-Cola Company

Autor: Maximilian Stuerner

Esta dissertação cobre a avaliação patrimonial da The Coca-Cola Company, a maior empresa
de bebidas não-alcoólicas do mundo. O principal objectivo desta tese é fornecer uma
recomendação de investimento baseada no valor estimado do capital próprio da empresa. Ao
longo do documento, todas as questões principais são abordadas, a fim de fornecer uma
avaliação precisa. Em primeiro lugar, são exploradas diferentes abordagens de avaliação,
seguidas de uma visão geral da empresa e do ambiente externo. Finalmente, os pressupostos
de previsão são mostrados e concluídos com uma comparação do resultado desta tese com o
relatório do Deutsche Bank. Para além da abordagem de avaliação DCF, a avaliação relativa
foi escolhida para testar os pressupostos e compará-los com os valores de mercado actuais.
Finalmente, tanto através do aumento e da eficiência gradual dos custos como através do
crescimento das receitas em mercados e segmentos em crescimento, é dada uma
recomendação de compra, com base na abordagem DCF de $61,28 por acção.

Palavras-chave: The Coca-Cola Company, Bebidas, Avaliação de Acções, Fluxo de Caixa
Descontado, Avaliação Relativa

 2
Equity Valuation – Coca-Cola Católica-Lisbon School Maximilian Stuerner | 2021

 Acknowledgements

An important period of my life is now coming to an end. During this time, especially in the
last few years, I have been able to grow as a professional, but above all as a person. I wouldn't
be able to do it without the help of the people I would like to thank now. I would like to thank
my parents, my brother and my friends for all their support and understanding. There will be
new stages to come, with new challenges to overcome, and I am sure that I can count on every
one of you. Finally, I would like to thank José Tudela Martins and Prof. António Borges de
Assunção, who supervised and reviewed my master’s thesis. I would like to express my
sincere gratitude for their helpful suggestions and constructive criticism during the
preparation of this thesis.

 3
Equity Valuation – Coca-Cola Católica-Lisbon School Maximilian Stuerner | 2021

 List of Abbreviations

APV – Adjusted Present Value

CAGR – Compounded Annual Growth Rate

CAPEX – Capital Expenditures

CAPM – Capital Asset Pricing Model

CSD – Carbonated Soft Drinks

D&A – Depreciation and Amortization

DCF – Discounted Cash Flow

EBIT – Earnings Before Interest and Taxes

EBITDA – Earnings Before Interest, Taxes, Depreciation and Amortization

EV – Enterprise Value

FCFE – Free Cash Flow to Equity

FCFF – Free Cash Flow to Firm

ITS – Interest Tax Shields

PER – Price-Earnings-Ratio

PP&E – Property, Plants and Equipment

ROA – Return of Assets

ROE – Return on Equity

ROIC – Return on Invested Capital

RTD – Ready-To-Drink

TCCC – The Coca-Cola Company

TV – Terminal Value

WACC – Weighted Average Cost of Capital

WC – Working Capital

 4
Equity Valuation – Coca-Cola Católica-Lisbon School Maximilian Stuerner | 2021

Contents
Introduction ................................................................................................................................ 7
1. Literature Review ................................................................................................................... 8
1.1 Valuation Approach ........................................................................................................ 8
 1.2 Discounted Cash Flow Valuation ................................................................................ 9
 1.2.1 Free Cash Flow to the Firm (FCFF) ................................................................... 10
 1.2.2 Weighted Average Cost of Capital – WACC .......................................................... 11
 1.3 Adjusted Present Value (APV) ....................................................................................... 14
 1.4 Relative Valuation .......................................................................................................... 15
2. Company Analysis ............................................................................................................... 18
 2.1 Coca-Cola Company Overview ...................................................................................... 18
 2.2 Stock and Dividend Performance ................................................................................... 20
 2.3 Operating Segments ........................................................................................................ 21
 2.4 Strategy ........................................................................................................................... 24
3. Industry Analysis.................................................................................................................. 25
 3.1 Macroeconomic Situation ............................................................................................... 25
 3.2 Industry Overview and Coca-Cola’s Market Positions .................................................. 26
4. Valuation of Coca-Cola ........................................................................................................ 30
 4.1 Operating Revenue ......................................................................................................... 31
 4.2 Operating Expenses ........................................................................................................ 37
 3.3 Gross Intangible Assets and Property, Plant, and Equipment (PP&E) .......................... 40
 4.4 Depreciation and Amortization ...................................................................................... 41
 4.5 Capital Expenditure (Capex) .......................................................................................... 42
 4.6 Working Capital ............................................................................................................. 43
 4.7 Tax Rate .......................................................................................................................... 44
 4.8 Weighted Average Cost of Capital (WACC) ................................................................. 45
 4.8.1 Cost of Debt ............................................................................................................. 45
 4.8.2 Cost of Equity .......................................................................................................... 46
 4.8.3 Weights of Equity and Debt ..................................................................................... 48
 4.9 Terminal Growth Rate .................................................................................................... 49
 4.10 Enterprise Value (EV) .................................................................................................. 50
 4.11 Additional Items ........................................................................................................... 51
 4.12 Equity Value ................................................................................................................. 51
 4.13 Sensitivity Analysis ...................................................................................................... 52
 4.14 Relative Valuation ........................................................................................................ 53

 5
Equity Valuation – Coca-Cola Católica-Lisbon School Maximilian Stuerner | 2021

5. Results Comparison with the Investment Bank Report ....................................................... 55
Conclusion ................................................................................................................................ 57
List of Figures .......................................................................................................................... 58
Appendices ............................................................................................................................... 60
References ................................................................................................................................ 71

 6
Equity Valuation – Coca-Cola Católica-Lisbon School Maximilian Stuerner | 2021

Introduction

The main purpose of this dissertation is to estimate the target price per share of The Coca-
Cola Company (TCCC), an American beverage company listed on the New York Stock
Exchange and the world’s leading player in the non-alcoholic beverage industry, in order to
provide an investment recommendation to current and potential investors in the company.

TCCC was founded in 1892 in the United States in Atlanta, Georgia, and has since grown to
become the largest non-alcoholic beverage company in the world, dominating the carbonated
soft drink industry. However, the ongoing COVID-19 pandemic has directly affected global
consumption of the industry (especially out-of-home consumption) due to the closing of sites
like bars and restaurants, causing a sharp decline in revenue across the industry. Nevertheless,
Coca-Cola was already facing immense challenges in recent years as consumer behavior has
shifted towards healthier beverages and slower growth in developed markets has burdened the
company`s revenue growth. Coca-Cola has therefore made efforts to overcome these
challenges while capitalizing on potential opportunities. Indeed, in recent years, the company
has become more cost-efficient by refranchising a large part of its bottling operation to
increase profitability and unblock resources to support growth.

The structure of this dissertation is organized into four major sections. The first section
includes the Literature Review, which details the most important valuation methods and their
applicability. The second section presents a company and industry overview, analyzing the
market and Coca-Cola’s characteristics that build the foundation for the company valuation.
The third section delivers the company valuation using the discounted cash flow method
complemented by a relative valuation. Finally, the results of this dissertation are compared
with those of the Deutsche Bank report, with the different assumptions and results obtained in
both valuations discussed in detail.

 7
Equity Valuation – Coca-Cola Católica-Lisbon School Maximilian Stuerner | 2021

1. Literature Review

1.1 Valuation Approach

The field of valuation has been established in business administration as an interdisciplinary
subject area uniting a number of different business management disciplines, such as
accounting, finance, and investment theory. According to Damodaran (2006), “valuation can
be considered the heart of finance.” The aim of a business valuation is to determine the
individual value of a company or a company unit and to provide information about both how
valuable a company is in the present and will be in the future. In portfolio management, for
example, a valuation attempts to find undervalued companies to invest in, thereby realizing
the true value of the company’s stock. Nevertheless, the success of a manager's financial
decision to launch a new product or invest in projects depends on their ability to correctly
evaluate the value of the decision and thus create value for the company. Copeland, Koller,
and Murrin (2000) also underlined that “all management decisions, either explicitly or
implicitly, are based on some valuation model.” In this dissertation, valuation is used to make
an investment decision (buy, hold, or sell) for TCCC.

Furthermore, any asset can be valued, but new assumptions and different valuation methods
must be made for each asset individually based on their own characteristics (Damodaran,
2002). Many assumptions that have to be made in valuation methods can be subjective; as
such, despite the many methods available, valuation is not an exact science but rather the
opinion of the valuer (Fernandez, 2013). Accordingly, a valuation for the same asset can
produce a variety of results due to the assumptions made by the valuer (Young et al., 1999).

However, over the last decades analysts have agreed on several methods available to evaluate
companies. Some methods require more data or are generally more complex than others, as
individual industry sectors and companies have their own characteristics that need to be
reflected. Therefore, there is no valuation method that fits every company perfectly. Instead,
one must decide which method is most suitable on a case-to-case basis. Nevertheless,
Damodaran (2006) and Fernandez (2007) pointed out that company valuation methods can be
divided into four main groups: all discounted cash flow methods (DCF methods), asset-based
valuation (balance-sheet-based methods), relative valuation (income-statement-based
methods) and contingent claim valuation.

 8
Equity Valuation – Coca-Cola Católica-Lisbon School Maximilian Stuerner | 2021

Discounted cash flow methods “seek to determine the company’s value by estimating the cash
flows it will generate in the future and then discounting them at a discount rate matched to the
flows’ risk” (Fernandez, 2013). This has become a commonly used valuation method for
corporate assets. The second group, asset-based valuation methods, determines the value of
the company by focusing on the company’s net asset value, which is calculated by subtracting
total liabilities from total assets (Fernandez, 2013). The third valuation method, relative
valuation, estimates the company’s value “based upon how similar assets are currently priced
in the market“ (Damodaran, 2013). Finally, the fourth one, contingent claim valuation, values
assets that share similar option characteristics and can be estimated through option pricing
models (e.g. Black and Scholes).

Given the overall characteristics of Coca-Cola, the DCF method is the most suitable approach
because it is based on detailed estimates of the company’s cash flows and assumptions and is
the most reliable and accurate method for making investment decisions. Furthermore, the
assumptions for DCF are easier to predict for larger, established companies like Coca-Cola
that have a steadier growth history and a stable capital structure on which to base these
projections. In addition to the DCF method, this valuation analysis is supplemented by the
relative valuation method to test and compare the viability and consistency of the DCF
valuation. To better understand the selected valuation methods and their underlying variables,
they are described in detail in the next section.

1.2 Discounted Cash Flow Valuation

Among all valuation methods, the DCF method has proven to be the strongest and most
popular practice for the valuation of corporate assets over the last twenty years. In simple
terms, this approach consists of a relationship between the present value and the expected
future value of corporate assets. Therefore, “the analyst’s task is first, to forecast expected
future cash flows, period by period; and second, to discount the forecasts to present value at
the opportunity cost of funds” (Luehrman, 1997) by adjusting timing and risk. The standard
DCF model, which is used in this dissertation, is illustrated in the following equation
(Fernandez, 2007)

 9
Equity Valuation – Coca-Cola Católica-Lisbon School Maximilian Stuerner | 2021

 1 2 3 +
 = + 2
 + 3
 + ⋯+
 1 + (1 + ) (1 + ) (1 + )

 (1 + )
 =
 ( − )

Where

CFi = Cash flow generated by the company in period n
g = Expected constant growth rate after the year n

VRn = Residual value of the company in the year n
k = Discount rate of the cash flow’s risk

The equation indicates two different time horizons. While, the left side of the equation is a
growth period for an explicitly chosen number of years, the right side shows an indefinite
time horizon with constant growth rate after year n. The indefinite time period is called
terminal value (TV) in the free cash flow to firm (FCFF) model (Fernandez, 2007).

Expected future cash flows as well as discount rates require certain assumptions that have a
significant impact on the outcome and accuracy of the valuation. The principle is similar for
all variations of the DCF approach. The main differences between the models are the discount
rates, cash flow components, and respective tax effects. This dissertation discusses the most
widely used DCF models, namely FCFF, free cash flow to equity (FCFE) and adjusted
present value (APV). Additional models include the dividend discount model (DDM) and
excess return-based models like economic value added or dynamic return on equity which
“focus on the capital stock and the spread between the return and the cost of capital” (Young,
et al., 1999)

1.2.1 Free Cash Flow to the Firm (FCFF)

There are two types of free cash flow measures used in the valuation: FCFE and FCFF; “The
first is to value just the equity stake in the business, while the second is to value the entire
business” (Damodaran, 2006). In the FCFF model, the value of the company is determined by
discounting the expected cash flows to the firm at the weighted average cost of capital

 10
Equity Valuation – Coca-Cola Católica-Lisbon School Maximilian Stuerner | 2021

(WACC) because it is necessary to consider the entire capital structure of the firm to calculate
its enterprise value (EV). In contrast, in the FCFE model, the value of equity is determined by
discounting the expected cash flow to equity at the cost of equity because FCFE involves only
the amount left for equity investors. Hence, FCFE calculates the equity value instead of EV
(Damodaran, 2006).
The cash flows of the FCFF are calculated before debt payments but after reinvestment needs
and taxes and are therefore available to all investors of the company, while the cash flows of
the FCFE are calculated after taxes, reinvestments needs, and debt and are available to
common equity shareholders of the company. The FCFF and the FCFE can be calculated as
follows:

FCFF = EBIT*(1 – Tax Rate) + Depreciation – CAPEX – Δ Working Capital

FCFE = Net Income +Depreciation-CAPEX- Δ Working Capital- (New debt issued – Debt
repayments)

FCFF DCF:

 = ∑
 +
 (1 + ) (1 + )
 =1

 (1 + )
 =
 ( − )

1.2.2 Weighted Average Cost of Capital – WACC

In addition to determining future free cash flows, the next step of the FCFF model is to
discount the cash flows using the WACC. The WACC is determined according to the
proportions of equity and debt in the company's total capital. Therefore, the WACC is
estimated by weighting the cost of debt (kd) and the cost of equity (ke) according to the firm’s
capital structure (Fernandez, 2013). In general, the formula of the WACC is given by:

 11
Equity Valuation – Coca-Cola Católica-Lisbon School Maximilian Stuerner | 2021

 = ∗ + + ∗ + ∗ (1 − )

where (E/D+E) and (D/D+E) are the weights of a company’s equity and debt of the EV. The
marginal tax rate is replicated as (T), and both the expected bankruptcy costs and the tax
benefits of debt are implied in the formula.
The prerequisite for successfully applying WACC is that the capital structure remains the
same for the forecasted period. However, in some cases, the capital structure could also
change during the forecast period. Although the WACC can be used in these situations and
the rate can be adjusted each year, the process is challenging and more complex. Luehrman
(1997) also emphasized that "the more complicated a company’s capital structure, tax
position, the more likely it is that mistakes will be made" while calculating the WACC.

1.2.2.1 Cost of Equity

As part of the WACC, the cost of equity is often used by managers to make investment decisions
because the cost of equity represents the return that shareholders demand as compensation for
holding the asset and bearing its risk (Luehrman, 1997).
The most widely used approach to estimate expected returns and determine the cost of equity
is the capital asset pricing model (CAPM), which links two concepts: risk and time value of
money (Luehrman, 1997). In general, the formula is given by

E(Ri) = Rf + βi * (Rm – Rf)

where the expected return equals the risk-free rate (Rf) plus the beta of the asset (βi)
multiplied by the market risk premium (Rm – Rf). To calculate the cost of equity, the three
components of the model—the risk-free rate, beta, and market risk premium—have to be
estimated (Damodaran, 2002).
The risk-free rate stands for the interest an investor would expect from a risk-free
investment, such as highly liquid, long-term government bonds with a maturity of 10 years
(Koller et al., 2005). Traditionally, US treasuries for international companies or German
 12
Equity Valuation – Coca-Cola Católica-Lisbon School Maximilian Stuerner | 2021

treasuries for European companies have been used as a proxy for the risk-free rate due to their
low default risk and high liquidity. Government bond yields should always be used in the
same currency as the company's cash flow to estimate the risk-free rate. In this manner,
inflation is consistent between cash flow and the discount rate.

The second component of the CAPM formula, the market risk premium or equity risk
premium, equals the difference between the expected return of the market and the risk-free
rate. The market risk premium provides a measure of the additional return that market
participants demand for the additional risk in comparison to a risk-free investment. The most
common way to calculate the market risk premium is by “looking at the historical premium
earned by stocks over default-free securities over long time periods” (Damodaran, 2008). The
actual returns achieved with stocks are estimated and compared with the actual returns of a
default-free security. The difference achieved between the returns thus represents the
historical risk premium on an annual basis.

Finally, a stock return is dependent on beta, which is a measure of systematic risk and
“measures how much the stock and entire market move together” (Koller et al., 2005). The
most common method to estimate the beta for listed companies is the historical market beta
method. It uses linear regression of historical stock returns against the returns of the selected
market index (e.g. S&P 500). After computing the regression, the beta is then represented by
the slope coefficient. The principle is as follows: if a stock has a beta of 1, its volatility
matches that of the market. If the beta is lower than 1, the stock is less volatile than the
market. If the beta is higher than 1, it is more volatile than the market. Beta is calculated
solely based on the past performance of a stock by considering its historical volatility
compared to the broader market.

However, the historical beta is only conditionally suitable for forward-looking company
valuations; this problem can be minimized by using the adjusted beta instead of the
(measured) raw beta. The so-called Blume adjustment (Blume, 1975) is the most commonly
used adjustment. The time instability and regression tendency of the beta factor towards 1 is
approximated in the Blume adjustment by the following equation:

Adjusted Beta = 1/3 +2/3* raw beta

 13
Equity Valuation – Coca-Cola Católica-Lisbon School Maximilian Stuerner | 2021

1.2.2.2 Cost of Debt

The second component in the WACC approach is the cost of debt. “The cost of debt measures
the current cost to the firm of borrowing funds to finance projects” (Damodaran, 2012).
According to Koller et al. (2005), the yield to maturity (YTM) of the company on its long-
term debt should be used to approach the cost of debt. The YTM approach is a suitable proxy
for companies when the investment grade debt is rated higher than BBB as this ensures that
the probability of default is significantly low. The YTM should be calculated directly from the
price of the bonds outstanding and the promised cash flows if the company has publicly
traded debt. If this is not the case or the debt trades rarely, using the company's debt rating to
calculate the YTM is recommended (Koller et al., 2005).

1.3 Adjusted Present Value (APV)

The APV model is an alternative DCF model to the FCFF-based approach and is preferably
used for companies with very complex or fluctuating capital structures. Adjusted present
value separates the effects of debt financing, namely tax shield and bankruptcy costs, from the
value of an operating asset, while WACC captures these effects in the discount rate
(Damodaran, 2006). Hence, in the APV model, the value of an asset is estimated by
presupposing that the company is all equity-financed and then adding back the tax shield and
bankruptcy costs from debt financing at a later point. This statement is proven in the
following formula:

Value of the Firm = Vu + PVtx + PVbc

where Vu is the value of the unlevered firm, PVtx the present value of the interest tax shield,
and PVbc the present value of bankruptcy costs. Consequently, the value of the company can be
estimated in three steps. The first step is to estimate the value of a purely equity-financed firm.
This value is based on the expected cash flow discounted at the unlevered cost of equity
(Damodaran, 2006).
 (1 + )
 =
 (ρ − g)

 14
Equity Valuation – Coca-Cola Católica-Lisbon School Maximilian Stuerner | 2021

The next step is to calculate the tax benefit, which “is a function of the tax rate and interest
payments of the firm and is discounted at the cost of debt to reflect the riskiness of this cash
flow” (Damodaran, 2006).

 ( ∗ ∗ )
 =

However, the correct approach for calculating the tax benefit could be an issue as its estimation
raises questions about the right choice of the discount rate (Damodaran, 2006). While Myres
(1974) and Cooper and Nyborg (2006) claimed that debt and tax savings are perfectly correlated
under the scenario of a constant level of debt and, as such, the cost of debt should be used as
the discount rate, Fernandez (2004) estimated the benefit of debt as the difference between the
unlevered firm and the levered firm rather than by the present value of tax shields associated
with interest.

The third and last step is to calculate the present value of the expected cost of bankruptcy
because an increase of debt levels not only leads to a benefit of debt but also to a higher expected
cost of bankruptcy (Damodaran, 2006).

 PV of Expected Bankruptcy cost = Probability of bankruptcy * PV of bankruptcy cost

A major problem of the APV model is that neither bankruptcy cost nor the probability of
bankruptcy can be determined directly. According to Opler and Titman (1994), estimating the
cost of bankruptcy is difficult because it implies indirect and direct costs due to financial
distress, which ultimately lead to the loss of customers or suppliers. One possibility to indirectly
calculate bankruptcy probability consists of estimating the probability of bankruptcy by bond
ratings, as in the WACC approach (Damodaran, 2006).

1.4 Relative Valuation

Whereas the DCF valuation is still concerned with determining the value of assets based on
expected future growth, cash flows, and associated risk, the objective of relative valuation is
 15
Equity Valuation – Coca-Cola Católica-Lisbon School Maximilian Stuerner | 2021

to value assets based on the current valuation of similar assets in the market. Relative
valuation complements DCF valuation by stress testing projected cash flow, highlighting the
differences between the company's performance and that of its peers, and presenting key
industry drivers (Koller et al., 2005).

There are two important steps in the relative valuation. The first step is to find comparable
assets (peer groups). In order to include the right companies in the peer group, one should
analyze if comparable companies operate in the same industry; are of similar size; and have
similar expected growth rates, return on invested capital (ROIC), and a comparable capital
structure. Therefore, companies which are operating in the same industry and have similar
performance characteristics should be evaluated with similar multiples (Goedhart et al.,
2005).

In a second step the most suitable multiples need to be defined. Multiples can be divided into
three different groups based on EV, growth-related values, and the equity of the company
(Fernandez, 2001). Forward-looking multiples should be used because one-time effects are
not included. The most used multiples are the equity-based price-to-earnings ratio (PER) and
the enterprise value-based EV to EBITDA (Goedhardt et al., 2005).

The PER “can be estimated using current earnings per share, which is called a trailing PE, or
an expected earnings per share in the next year, called a forward PE” (Damodaran, 2012). The
PER formula is given by

 =

and indicates how often the profit is included in the current price of a share or after how many
years the profit has repaid the price of the share.

However, using the PER can lead to a misleading valuation since the PER is affected by the
capital structure. A suitable alternative for this is to use the EV/EBITDA multiple as this is
less susceptible to a change in capital structure because the EV already includes debt and
equity (Goedhart et al., 2005).

The enterprise value must be adjusted for non-operating items such as excess cash, which
would otherwise lead to a major distortion of the multiple. Other frequently used multiples in
relation to EV are EV/EBIT or EV/Sales. The EV/EBITDA formula is given by

 16
Equity Valuation – Coca-Cola Católica-Lisbon School Maximilian Stuerner | 2021

 =
 , ,

 17
Equity Valuation – Coca-Cola Católica-Lisbon School Maximilian Stuerner | 2021

2. Company Analysis

2.1 Coca-Cola Company Overview

TCCC, founded in 1886, is an American beverage company that offers more than 500 brands
in more than 200 countries and is headquartered in Atlanta, GA, USA. With 86,200
employees worldwide, Coca-Cola is currently the world market leader in non-alcoholic
beverages and has been listed on the New York Stock Exchange since 1919 and in the S&P
500 since 1957 under the trading symbol KO. Currently, 69.1% of the 4.297 million
outstanding shares are in free float, while the remaining shares are mostly held by institutional
shareholders; among these, Berkshire Hathaway and the Vanguard Group are the major
shareholders, owning 9.3% and 7.5% of shares, respectively.1

The company’s total revenue in 2019 was $37.266 million and derived from seven operating
segments: North America (30.9 % of total revenue), Bottling Investments (19.3%), Europe,
Middle East and Africa (18.3%), Asia Pacific (13.8%), Latin America (10.7%), Global
Ventures (6.7%), and Corporate (0.2%). The geographical regions focus on the sale of
concentrates, while the sale of finished bottles is reflected in the Bottling Investments
segment.
Over the last five years, revenue has decreased by 16%, mainly as a result of the refranchising
of the Bottling Investments segment.

1
 Source: Bloomberg
 18
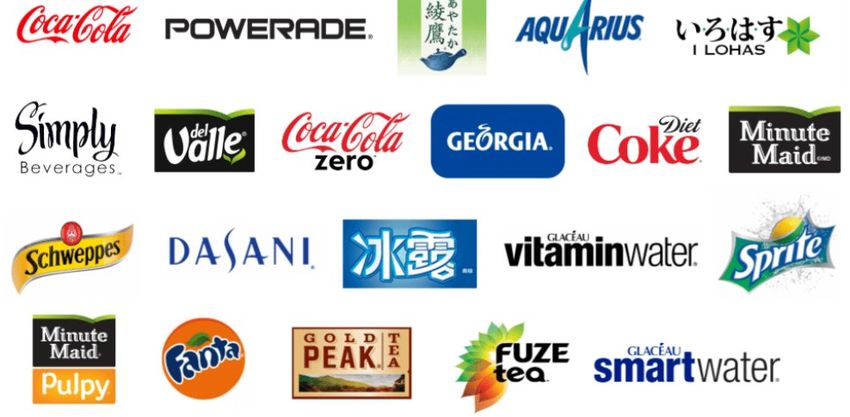
Equity Valuation – Coca-Cola Católica-Lisbon School Maximilian Stuerner | 2021

Figure 1: Coca-Cola Total Revenue; Source: Annual Reports

Within each segment, Coca-Cola sells different beverage categories directly and indirectly:
carbonated soft drinks, water, sports drinks, juice, milk and vegetable drinks, tea and coffee,
and energy drinks. The Coca-Cola trademark (includes Coca-Cola Zero and Diet Coke) is by
far the most popular drink and accounts for approximately 37% of the company’s total
revenue. Nevertheless, Coca-Cola has a very diversified brand portfolio of 21 brands that are
worth a minimum of $1 billion each.

Figure 2: The Coca-Cola Company’s Most Popular Brands; Source: Coca-Cola Website

 19
Equity Valuation – Coca-Cola Católica-Lisbon School Maximilian Stuerner | 2021

TCCC is a major participant in the Coca-Cola ecosystem, where it is directly or indirectly
engaged in every stage of the value chain. TCCC directly participates in the procurement,
marketing, and manufacturing of its products as well as holds stakes in and indirectly works
with independent partners that package and distribute those products. However, over the last
four years, TCCC has refranchised a large part of its bottling operations to further improve its
operating margins. Overall, TCCC still represents the world’s largest beverage distribution
system and owns one of the most comprehensive bottling systems globally.

2.2 Stock and Dividend Performance
TCCC is one of the most well-known dividend payers on the entire stock market. TCCC has
paid a quarterly dividend without interruption since 1920, and it has paid increasing dividends
every year for the last 58 years; this plugs TCCC in a group of 57 stocks in the S&P 500, the
so-called dividend aristocrats (companies with an increasing dividend policy for 25
consecutive years qualify as a dividend aristocrat). This status is a valuable quality feature for
Coca-Cola and underlines the robustness of this stock and its reliable business model.
In February 2020, Coca-Cola announced that it was increasing its quarterly payment by 2.5%
from $0.40 to $0.41, representing an annual dividend of $1.64 in 2020 and a current yield of
approximately 3.38%.2 In addition, the dividend yield is almost twice the average dividend
paid by other soft drink stocks and significantly higher than the 2% average current yield of
the broader S&P 500 Index and Dow Jones 30 Index.

Figure 3: Comparison of the Dividend Yield in %; Source: Bloomberg

 7
 6
 5
 4
 3
 2
 1
 0
01.01.2000 01.01.2005 01.01.2010 01.01.2015 01.01.2020

 Coca Cola S&P 500 Dow Jones 30

2
 Source: Coca-Cola website
 20
Equity Valuation – Coca-Cola Católica-Lisbon School Maximilian Stuerner | 2021

The total return price of Coca-Cola more than doubled in the last 20 years and showed a
steady growth after the financial crisis in 2009 until the COVID-19 pandemic in 2020. In
comparison with the mentioned indices, the stock of Coca-Cola nearly matched the S&P 500
and slightly underperformed compared to the Dow Jones 30 in the last 20 years, which
worsened during the pandemic. From the top price at approximately $60 at the end of
February 2020, the stock price decreased 38% as a result of the global lockdown and the
connected slump in out-of-home consumption. Due to emerging hope for a vaccine and the
anticipated end of the pandemic, the share price recovered from its low and increased by 37%
to $52.60 on November 17, 2020.

Figure 4: Total Return Comparison in %; Source: Bloomberg

 400
 350
 300
 250
 200
 150
 100
 50
 0
 -50
 -100
 01.01.2000 01.01.2005 01.01.2010 01.01.2015 01.01.2020

 Coca Cola S&P 500 Dow Jones 30

2.3 Operating Segments

In general, TCCC generates net operating revenue through international and domestic
concentrates as well as through finished product operations. The concentrate operations are
defined by selling syrups, concentrates, and certain finished beverages to authorized bottling
partners. To be able to produce and distribute finished beverages, the bottling partners
combine the concentrates with sweeteners or water (still or carbonated), depending on the
product. The bottling partners and some company-owned bottling firms manufacture, market,

 21
Equity Valuation – Coca-Cola Católica-Lisbon School Maximilian Stuerner | 2021

and distribute the finished beverages to vending partners and customers, who ultimately sell
the beverages to consumers. The finished product operations generate revenue by selling
finished nonalcoholic beverages directly to retailers or distributors.

Figure 5: % of Total Net Operating Revenue Related to Concentrate Operations and Finished Product
Operations; Source: Annual Report 2019

The two operations are included in the operating structure of the company, which is the basis
for its internal financial reporting.

The operational set-up of Coca-Cola is divided into four geographical segments (Asia Pacific;
North America; Latin America; and Europe, Middle East, and Africa) and three functional
segments (Global Ventures; Bottling Investments; and Corporate, which focuses on strategic
initiatives, governance, and the simplification and standardization of transaction processes).

The geographic operating segments gain a large part of their revenue from the production and
sale of beverage concentrates and syrups. In some cases, revenue can also be generated from
the sale of finished beverages.

The Global Ventures segment was founded in 2018 and focuses on globally scaling
acquisitions and associated brands. Thus, the financials of acquired companies like Costa
Coffee, the smoothie brand Innocent, the tea brand Doğadan and Coca-Cola’s investment in
the energy drink brand Monster Beverages are included in this segment.

The Bottling Investments segment is composed of the consolidated or company-owned
bottling operations. After the refranchising of large parts of this segment, the current sites of
bottlers only exist in Asia and Africa. Consolidated or company-owned bottling operations
derive most of their revenue from the sale of finished beverages.3

3
 Source: Annual Report 2019 Coca-Cola
 22
Equity Valuation – Coca-Cola Católica-Lisbon School Maximilian Stuerner | 2021

Figure 6: Revenue Distribution by Segments; Source: Annual Reports

Figure 6 shows that the share of the Bottling Investments segment of total revenue has been
drastically decreasing over the last few years. This decrease is related to the extensive
refranchising of Coca-Cola’s bottling operations, which converted company-owned bottling
plants to new franchisees and ultimately outsourced the revenue. Since the bottling business is
associated with up to five times more revenue per beverage sold than the concentrates, any
impact on the bottler's sales has an amplified effect on Coca-Cola's overall revenue. However,
the associated costs of refranchising were also high, and the refranchising therefore had a
much smaller impact on the company's bottom line. The refranchising was completed in the
beginning of 2019, and the segment is no longer expected to be further reduced.

Over the last four years, North America was the segment with the most significant growth at
17% between 2016 and 2019, followed by Latin America with 8%; this was mainly due to the
fact that, as a result of the refranchising in the two segments, some revenue streams from the
Bottling Investments segment were reclassified under these areas. The remaining segments
did not show significant growth during the last four years. The Corporate segment is not
illustrated as it only contributes between 0.2% and 0.3% of the total revenue.

 23
Equity Valuation – Coca-Cola Católica-Lisbon School Maximilian Stuerner | 2021

2.4 Strategy

The Coca-Cola Company has announced strategic steps to reorganize and further enable the
Coca-Cola system to become more efficient and more consumer-centric through a portfolio of
drinks positioned to grow in a more rapidly changing marketplace.

The first step in achieving these goals is to prioritize fewer but larger and stronger brands to
target each of the different consumer needs. Of the 400 master brands (describes an
overarching brand under which various products are sold) owned by TCCC, more than half
are brands from a single country, with little to no scale. The combined total sales of these
brands are only approximately 2% of Coca-Cola’s total sales. These brands are not only
growing more slowly than the company average but also still require significant resources and
investment to maintain their growth. Dismantling the brands has the advantage that Coca-Cola
can redirect resources to the brands that have the greatest future opportunities. Therefore,
TCCC will try to expand leadership in the geographical segments with a focused brand
portfolio because the large and stronger brands have both higher scale and profitability
compared to a single-country brand.

In terms of marketing effectiveness and efficiency, several areas will be targeted to improve
operations. Coca-Cola is striving to bring marketing more into the digital age as new
technologies allow data to be collected and evaluated faster, and it is easier to focus more on
the impact of messages and their alignment within market execution plans through targeted,
event-driven initiatives.

Coca-Cola's system is moving further away from a complicated organizational structure led
by 17 operating units to a network model led by only seven operating units. The operating
units will be strongly interlinked with each other, have a uniform structure, and focus on
eliminating resource duplication and faster scaling of new products.

The new operating model is leaner, more agile, and faster, and Coca-Cola expects to decrease
structural costs and clear resources to support growth. Hence, the organization is well
positioned for the future and poised to emerge stronger from the pandemic and to return
quickly to the growth path of 2019.

 24
Equity Valuation – Coca-Cola Católica-Lisbon School Maximilian Stuerner | 2021

3. Industry Analysis

3.1 Macroeconomic Situation

The year 2020 was marked by the spread of the COVID-19 virus and the associated
challenges for individuals and the economy. The lockdowns in March 2020, which were
enforced almost worldwide to stop the increased incidence of infection, caused immense
damage to individual companies and the global economy. Stock indices around the world
plummeted (e.g. S&P 500 -34%), consumption and production of goods and services were
severely restricted, and forecasts for economic growth had to be massively revised
downwards.4

As a consequence of these events, macroeconomic factors such as real gross domestic product
(GDP) had the largest drop ever recorded. For example, the GDP in the US declined in the
second quarter of 2020 by 9.5% and in the European Union by 12.1% with comparison to the
previous year.5 This economic downturn prompted economic policymakers worldwide to
resort to extraordinary measures to cushion the economic consequences of the COVID-19
pandemic. Central banks, including the European Central Bank (ECB) and the US Federal
Reserve (Fed), have implemented extensive measures to strengthen the liquidity supply of the
banking system and to increase lending. Due to the economic aid packages and the decreased
incidence of the virus over the summer months, the economy—and thus also the stock
indices—recovered in the third quarter.

The real GDP increased in the third quarter of 2020 by 7.4% in the US and 11.6% in the
European Union compared with the previous quarter.6 These positive developments can be
explained by a recovery in domestic demand as well as an increase in goods and services
exports. Furthermore, the stock indices also rose sharply from their COVID-19 lows in March
2020 (e.g., the S&P 500 increased by more than 50%).7 The recovery in the stock markets
was mainly driven by technology and "stay at home" (e.g., delivery and streaming services)
stocks as the need for greater digitalization benefited these companies.

4
 Source: Bloomberg
5
 Source: OECD, 2020
6
 Source: OECD, 2020
7
 Source: Bloomberg
 25
Equity Valuation – Coca-Cola Católica-Lisbon School Maximilian Stuerner | 2021

Nevertheless, the pandemic situation has remained prevalent, and the impact of increasing
numbers of infections worldwide is already visible in the fourth quarter. Since neither
politicians nor pandemic experts know exactly how long the pandemic will last or how long it
will take to effectively implement the vaccine, it is difficult to forecast the economic
performance of the individual countries in the near future. Given the current situation in the
fourth quarter wherein restaurants, bars, and events are closed, Coca-Cola is facing a drop in
sales and consumption around the world. The sales of the non-alcoholic beverage industry are
expected to have fallen between 15-20% in 2020. While the first half of 2021 is expected to
still be negatively affected by the pandemic, 2022 is anticipated to return to 2019 levels of
consumption.8

3.2 Industry Overview and Coca-Cola’s Market Positions

TCCC belongs to the non-alcoholic beverage industry, which had a market size of $1.130
billion in 2019 and which is assumed to reach $1.443 billion by 2025 with a compounded
annual growth rate (CAGR) of 4.1%.9

Based on product type, the market can be split into carbonated drinks (carbonated soft drinks
[CSD], diet, and low-sugar drinks), bottled water, juices, energy drinks, ready-to-drink (RTD)
coffee and tea, and sport drinks. Carbonated drinks are the most important category and
account for 39% of the industry, with a global turnover of $437 billion in 2019 that is
dominated by the CSD sub-segment (e.g. Fanta, Sprite, and Trademark Cola) with a size of
$328 billion (75% category’s total turnover).

8
 Source: Bloomberg
9
 Source: Bloomberg
 26
Equity Valuation – Coca-Cola Católica-Lisbon School Maximilian Stuerner | 2021

Figure 7: Historical Beverage Segments Revenue in Billions; Source: Bloomberg

According to Figure 7, next to carbonated drinks, bottled water (26%) and juices (13%) were
the most important categories in 2019. Over the last four years, the growth of carbonated
drinks stagnated (CAGR of 1.1%), driven by a shift in consumers’ behavior. Consumers are
gradually reducing the intake of CSDs due to growing awareness of the harmful effects of
high sugar consumption, the trend to diet, and lower calorie varieties of carbonated drinks.
While the share of CSDs has stagnated in recent years, diet and zero-sugar drinks have grown
at double-digit rates, thus generating the slight growth in carbonated drinks revenue10.
The healthier segments of bottled water (CAGR of 9.5%) and RTD coffee and tea (CAGR of
7.5%) were able to significantly increase their share of total sales over the last four years.
These drinks are enjoying increasing popularity among health-conscious consumers and have
become an important trend in the market.

This trend towards healthier beverages will continue and is thus reflected in the expected
growth for the individual categories over the next five years. According to Bloomberg
forecasts (Figure 8), the bottled water and RTD tea and coffee segments are expected to be the
fastest-growing segments. Meanwhile, the carbonated drinks segment is expected to grow at
an accelerated rate compared to previous years due to the greater demand and popularity of
diet and low-sugar drinks.

10
 Source: Bloomberg
 27
Equity Valuation – Coca-Cola Católica-Lisbon School Maximilian Stuerner | 2021

Figure 8: Main Global Beverage Development; Source: Bloomberg

Within the CSD segment of the industry (more than 50% of total TCCC revenue), TCCC is
the leader with a constant volume-based share (units sold) of 44.7%, ahead of both Pepsi
(19.3%) and Keurig Dr. Pepper (4.1%).11 While its strong leadership position in the CSD
category provides substantial distribution efficiencies over rivals, Coca-Cola has not been
able to increase its market share in recent years.

Figure 9: Global Carbonated Soft-Drink Leader Share; Source: Bloomberg

Nevertheless, Coca-Cola has the highest value share globally in all non-alcoholic beverage
segments except for energy and sports drinks; this underlines that Coca-Cola is well
positioned in all areas in the market and can actively participate in the fast-growing segments
of bottled water and RTD tea and coffee with the potential to expand its market share.

11
 Source: Bloomberg
 28
Equity Valuation – Coca-Cola Católica-Lisbon School Maximilian Stuerner | 2021

Figure 10: Coca-Cola’s Exposure to Beverage Segments; Source Coca-Cola Website

Looking at the different global regions of the non-alcoholic beverage industry, America
(North America and Latin America) has been the strongest market in terms of sales, while
growth in the Asia Pacific region was the highest (CAGR of 6.0%) over the last four years.
This strong growth in Asia was achieved primarily through the rapid development of the
Chinese and Indian markets. While the European market showed slight growth, the American
market grew mainly through the growth in Latin America.

Figure 11: Market Split in Revenue Billion; Source: Bloomberg

 29
Equity Valuation – Coca-Cola Católica-Lisbon School Maximilian Stuerner | 2021

It is expected that the greatest future growth potential will be in developing and emerging
markets (especially Asia Pacific and Africa), driven by their burgeoning middle classes and
their increasing demand.

4. Valuation of Coca-Cola

For the valuation of Coca-Cola, two models were used. In the first section, all assumptions to
forecast the FCFF are illustrated. The main drivers of the FCFF are operating revenue,
operating expenses, depreciation and amortization, capital expenditure, and working capital.
The WACC and all the associated components follow to determine the EV. After calculating
the firm value, the equity value was calculated to obtain a share price for Coca-Cola.
In the second section, relative valuation is used because it tests the results of the DCF by
valuing assets based on the equity and enterprise multiples of comparable peers in the market.

Seven years are used as the forecasting period for this dissertation, ranging from December
31, 2020, to the December 31, 2027. This period was chosen because 2022 is expected to be
the first year without any effect of the current pandemic in terms of TCCC’s performance, and
thus some segments are expected to reach a steady state in the seventh year, five years after
the last effects of the pandemic.

In order to make a suitable forecast, published information from Coca-Cola, largely from the
company’s annual reports, was used to gain a better understanding of the development of the
individual positions in the financial statements. Analysis of the past three to four years in the
financial statements was used to identify trends between the quarters and years. Furthermore,
the strategic plan of Coca-Cola, forecasted market data, and economic development in the
different geographical segments were considered to forecast the revenue.

 30
Equity Valuation – Coca-Cola Católica-Lisbon School Maximilian Stuerner | 2021

4.1 Operating Revenue

Operating revenue, which is the revenue Coca-Cola gains from its business activities, is one
of the most important variables in the income statement and in the valuation model because
other financial positions are derived from it.

First, the overall approach to forecast revenue is illustrated, followed by the forecast for
individual segments (Europe, Middle East, and Africa; Latin America; North America; Asia
Pacific; Global Ventures; Bottling Investments; and Corporate). The Corporate segment is not
analyzed in detail as it contributes to only 0.2% of the total revenue and is therefore not
relevant for future growth. The distinction between the segments is particularly important
because each has its own growth prospects based on different historical performances and
future expectations.

As Coca-Cola is a globally diversified company and generates more than 50% of its revenue
outside of the United States, Coca-Cola heavily relies on favorable currency exchange rates.
Since there is no clear trend in recent years as to whether this has had a positive or negative
effect on its revenue and it is hard to predict how changes in currency exchange rates will
impact revenues, the currency effect is not explicitly forecasted in this dissertation.
Nevertheless, it should be noted that currency effects can pose an enormous risk to Coca-
Cola's revenue, although Coca-Cola uses hedging strategies to minimize these risks.

Furthermore, it is important to note that the divesture or acquisition of a company has an
impact on Coca-Cola's revenue. As Coca-Cola is constantly striving to renew and expand its
portfolio, divestitures and acquisitions are made every year. The dissertation takes into
consideration the officially announced divesture and acquisition process that focuses on the
divesture of more than half of the 400 master brands over the next few years (these brands
only account for 2% of TCCC’s total revenue, and each is only offered in one country).
TCCC intends to concentrate on fewer but stronger and more consumer-oriented brands. In
addition, the CEO of Coca-Cola, James Quincey, mentioned that there will not be as many
acquisitions in the future as in the past because the company wants to increasingly focus on
product development. Nevertheless, acquisitions will remain an important tool for Coca-Cola
to gain new market shares or enter new markets. Given the described constellation of aims, it
is therefore expected that the effects of acquisition and divesture will cancel each other out
and are thus not explicitly forecasted in the dissertation.

 31
Equity Valuation – Coca-Cola Católica-Lisbon School Maximilian Stuerner | 2021

Forecasting Approach

According to the current pandemic and its significant impact on Coca-Cola's revenue, a
quarter-over-quarter comparison was performed for 2021 and Q4 2020,12 and all assumptions
were made as of Q3 2020; this was mainly because both Q4 in 2020 and Q1 and Q2 in 2021
are expected to be directly affected by the pandemic. For Q3 and Q4 in 2021, it is assumed
that the already begun distribution of the vaccine (started in the end of December) in many
places in the world will ensure a return to everyday life without restrictions for most people.

However, in order to calculate the impact of the pandemic, the average growth of the quarters
of the individual segments from 2017 to 2019 without restrictions was compared to the first
three quarters of 2020 to better understand the financial impact of the pandemic on Coca-
Cola's revenue.

A significant decline in overall revenue was observed in Q2 2020 (-27% compared to Q2
2019) as the almost worldwide closure of restaurants and events heavily affected out-of-home
consumption. The recovery in Q3 (-9% compared to Q3 2019) due to the partially lifted
restrictions was halted by the "second wave" of the pandemic in Q4. Hence, for calculating
Q4 2020, an average of the effect of the pandemic in Q3 and Q2 in 2020 was built and
subtracted from the average development from Q3 to Q4 2017 to 2019.

Nevertheless, through the implementation of the vaccine in the end of December 2020 and the
expected easing of restrictions, a recovery of revenue is expected for the first half of 2021
compared to the pandemic-affected quarters of the previous year, followed by a significantly
stronger Q3 and Q4. Therefore, revenue in 2021 is assumed to recover compared to 2020, but
it will still be significantly lower than the levels seen in 2019 mainly due to the pandemic
restrictions in the first half of the year.

For the rest of the forecasting period, the revenue growth for the different segments is based
on their historical performance from 2017 to 2019 and adjusted for company strategy and
future market trends. Furthermore, it is assumed that TCCC will be back to 2019 revenue
levels by 2022.
As stated above, it is assumed that the currency and acquisitions/divestures impact is zero,
therefore the revenue forecast is based on the organic revenue growth of each segment. The
organic revenue consists of organic volume growth and the price mix.

12
 For quarter comparison see Appendix 15.
 32
You can also read