European pollen-based REVEALS land-cover reconstructions for the Holocene: methodology, mapping and potentials
←
→
Page content transcription
If your browser does not render page correctly, please read the page content below

Earth Syst. Sci. Data, 14, 1581–1619, 2022
https://doi.org/10.5194/essd-14-1581-2022
© Author(s) 2022. This work is distributed under
the Creative Commons Attribution 4.0 License.

                European pollen-based REVEALS land-cover
              reconstructions for the Holocene: methodology,
                          mapping and potentials
         Esther Githumbi1,2 , Ralph Fyfe3 , Marie-Jose Gaillard2 , Anna-Kari Trondman2,4 , Florence Mazier5 ,
            Anne-Birgitte Nielsen6 , Anneli Poska1,7 , Shinya Sugita8 , Jessie Woodbridge3 , Julien Azuara9 ,
               Angelica Feurdean10,11 , Roxana Grindean11,12 , Vincent Lebreton9 , Laurent Marquer13 ,
              Nathalie Nebout-Combourieu9 , Miglė Stančikaitė14 , Ioan Tanţău11 , Spassimir Tonkov15 ,
                          Lyudmila Shumilovskikh16 , and LandClimII data contributors+
          1 Department       of Physical Geography and Ecosystem Science, University of Lund, 22362 Lund, Sweden
             2 Department       of Biology and Environmental Science, Linnaeus University, 39182 Kalmar, Sweden
                        3 School of Geography, Earth and Environmental Sciences, University of Plymouth,

                                                  PL4 8AA Plymouth, United Kingdom
         4 Division of Education Affairs, Swedish University of Agricultural Science (SLU), 23456 Alnarp, Sweden
                                 5 Environmental Geography Laboratory, GEODE UMR 5602 CNRS,

                                       Université de Toulouse Jean Jaurès, 31058 Toulouse, France
                                    6 Department of Geology, Lund University, 22100 Lund, Sweden
                         7 Department of Geology, Tallinn University of Technology, 19086 Tallinn, Estonia
                           8 Institute of Ecology, Tallinn University of Technology, 10120 Tallinn, Estonia
             9 Département Homme et Environnement, UMR 7194 Histoire Naturelle de l’Homme Préhistorique,

                                                             75013 Paris, France
           10 Senckenberg Biodiversity and Climate Research Centre (BiK-F), 60325 Frankfurt am Main, Germany
                      11 Department of Geology, Faculty of Biology and Geology, Babeş-Bolyai University,

                                                       400084 Cluj-Napoca, Romania
             12 Institute of Archaeology and History of Arts, Romanian Academy, 400015 Cluj-Napoca, Romania
                              13 Department of Botany, University of Innsbruck, 6020 Innsbruck, Austria
                        14 Institute of Geology and Geography, Vilnius University, 03101 Vilnius, Lithuania
                       15 Department of Botany, Sofia University St. Kliment Ohridski, 1164 Sofia, Bulgaria
         16 Department of Palynology and Climate Dynamics, Georg August University, 37073 Göttingen, Germany
                                          + A full list of authors appears at the end of the paper.

                               Correspondence: Esther Githumbi (esther.githumbi@lnu.se)

                                  Received: 13 August 2021 – Discussion started: 26 October 2021
                         Revised: 18 February 2022 – Accepted: 25 February 2022 – Published: 8 April 2022

      Abstract. Quantitative reconstructions of past land cover are necessary to determine the processes involved in
      climate–human–land-cover interactions. We present the first temporally continuous and most spatially extensive
      pollen-based land-cover reconstruction for Europe over the Holocene (last 11 700 cal yr BP). We describe how
      vegetation cover has been quantified from pollen records at a 1◦ × 1◦ spatial scale using the “Regional Esti-
      mates of VEgetation Abundance from Large Sites” (REVEALS) model. REVEALS calculates estimates of past
      regional vegetation cover in proportions or percentages. REVEALS has been applied to 1128 pollen records
      across Europe and part of the eastern Mediterranean–Black Sea–Caspian corridor (30–75◦ N, 25◦ W–50◦ E) to
      reconstruct the percentage cover of 31 plant taxa assigned to 12 plant functional types (PFTs) and 3 land-cover
      types (LCTs). A new synthesis of relative pollen productivities (RPPs) for European plant taxa was performed
      for this reconstruction. It includes multiple RPP values (≥ 2 values) for 39 taxa and single values for 15 taxa

Published by Copernicus Publications.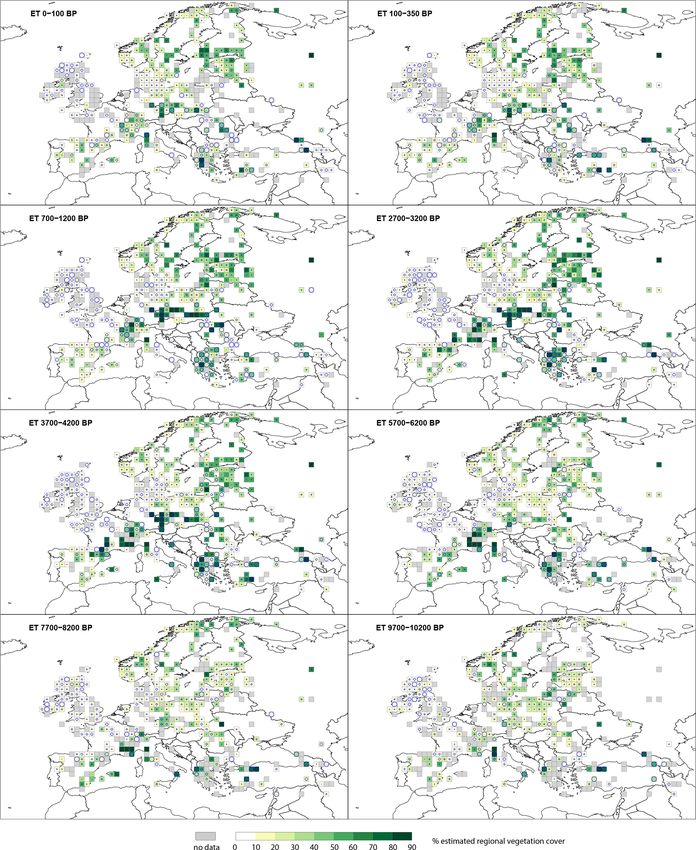
1582                     E. Githumbi et al.: European pollen-based REVEALS land-cover reconstructions for the Holocene

       (total of 54 taxa). To illustrate this, we present distribution maps for five taxa (Calluna vulgaris, Cerealia type
       (t)., Picea abies, deciduous Quercus t. and evergreen Quercus t.) and three land-cover types (open land, OL;
       evergreen trees, ETs; and summer-green trees, STs) for eight selected time windows. The reliability of the RE-
       VEALS reconstructions and issues related to the interpretation of the results in terms of landscape openness
       and human-induced vegetation change are discussed. This is followed by a review of the current use of this
       reconstruction and its future potential utility and development. REVEALS data quality are primarily determined
       by pollen count data (pollen count and sample, pollen identification, and chronology) and site type and number
       (lake or bog, large or small, one site vs. multiple sites) used for REVEALS analysis (for each grid cell). A large
       number of sites with high-quality pollen count data will produce more reliable land-cover estimates with lower
       standard errors compared to a low number of sites with lower-quality pollen count data. The REVEALS data
       presented here can be downloaded from https://doi.org/10.1594/PANGAEA.937075 (Fyfe et al., 2022).

1   Introduction                                                    Kamińska et al., 2019) and wider ecosystem functioning (El-
                                                                    lis, 2015; Stephens et al., 2019).
The reconstruction of past land cover at global, continen-             The earth system modelling (ESM) community uses
tal and sub-continental scales is essential for the evaluation      LULCC model scenarios, along with dynamic vegetation
of climate models, land-use scenarios and the study of past         models, to understand interactions between different compo-
climate–land-cover interactions. Vegetation plays a signifi-        nents of the earth system in the past (Gilgen et al., 2019;
cant role within the climate system through biogeochemi-            He et al., 2014; Hibbard et al., 2010; Smith et al., 2016).
cal and biogeophysical feedbacks and forcings (Foley, 2005;         Disagreement between LULCC scenarios suggests that their
Gaillard et al., 2015, 2010b, 2018; Strandberg et al., 2014,        evaluation is needed using independent, empirical datasets
2022). Land use has modified the land cover of Europe over          (Gaillard et al., 2010a). Pollen-based reconstruction of past
Holocene timescales at local, regional and continental scales       land cover represents probably the best empirical data for this
(Roberts et al., 2018; Trondman et al., 2015; Woodbridge            purpose as fossil pollen is a direct proxy for past vegetation,
et al., 2018). Concerted efforts have been made to model            and fossil pollen records are ubiquitous across the continent
land-use and land-cover change (LULCC) over Holocene                of Europe (Gaillard et al., 2010a, 2018). The landscape re-
timescales (e.g. HYDE 3.2, Klein Goldewijk et al., 2017,            construction algorithm (LRA) with its two models Regional
and KK10, Kaplan et al., 2011). KK10 has been used to as-           Estimates of VEgetation Abundance from Large Sites (RE-
sess the impact of the scale of deforestation between 6000          VEALS) (Sugita, 2007a) and LOcal Vegetation Estimates
and 200 cal yr BP in Europe on regional climate in the mod-         (LOVE) (Sugita, 2007b) is the only current land-cover recon-
elling study of Strandberg et al. (2014). The KK10-inferred         struction approach based on pollen data that effectively re-
land-cover change resulted in cooling or warming of regional        duces the biases caused by the non-linear pollen–vegetation
climate by 1 to 2 ◦ C depending on the season (winter or sum-       relationship due to differences in sedimentary archives, basin
mer) and/or geographical location. Major changes in the for-        size, inter-taxonomic differences in pollen productivity and
est cover of Europe over the Holocene may therefore have            dispersal characteristics, and spatial scales. REVEALS and
had a significant impact on past regional climate, particu-         LOVE are mechanistic models that transform pollen count
larly those driven by deforestation since the start of agricul-     data to produce quantitative reconstructions of regional (spa-
ture during the Neolithic period, the timing of which varies        tial scale: ≥ 104 km2 ) and local (spatial scale: relevant source
in different parts of Europe (Fyfe et al., 2015; Gaillard et al.,   area of pollen sensu Sugita, 1993, ≥ ca. 1–5 km radius) vege-
2015; Hofman-Kamińska et al., 2019; Nosova et al., 2018;           tation cover, respectively (Sugita, 2007a, b). The REVEALS
Pinhasi et al., 2005; de Vareilles et al., 2021). Estimating past   model was first tested and validated in southern Sweden
land-cover change can enable quantification of the scale at         (Hellman et al., 2008a, b) and later in other parts of Europe
which human impact on terrestrial ecosystems perturbed the          and the world (Mazier et al., 2012; Soepboer et al., 2010;
climate system. This in turn allows us to consider when en-         Sugita et al., 2010).
vironmental changes moved beyond the envelope of natural               The first pollen-based REVEALS reconstruction of plant
variability (Ruddiman, 2003; Ruddiman et al., 2016). We fo-         cover over the Holocene covering a large part of Europe
cus here on the role of LULCC in the climate system; anthro-        (Trondman et al., 2015) was used for the assessment of
pogenic land-cover change can have broader consequences             LULCC scenarios (Kaplan et al., 2017) and helped to eval-
for other processes and lead to changes in erosion and fluvial      uate climate model simulations using LULCC scenarios
systems (Downs and Piégay, 2019), biodiversity (Barnosky            (Strandberg et al., 2014). A comparison between REVEALS-
et al., 2012), nutrient cycling (Guiry et al., 2018; McLauch-       based open land cover from pollen records and Holocene
lan et al., 2013), habitat exploitation by megafauna (Hofman-       deforestation simulated by HYDE 3.1 and KK10 showed

Earth Syst. Sci. Data, 14, 1581–1619, 2022                                          https://doi.org/10.5194/essd-14-1581-2022
E. Githumbi et al.: European pollen-based REVEALS land-cover reconstructions for the Holocene                                1583

that the REVEALS reconstructions were more similar to              tiation of plant functional types (PFTs) is necessary (Strand-
KK10 than HYDE 3.1 scenarios (Kaplan et al., 2017). There-         berg et al., 2014). Forest cover over the Holocene inferred
fore, estimates of past plant cover from fossil pollen assem-      from pollen records using these approaches differs from for-
blages are essential to both test and constrain LULCC mod-         est cover obtained with REVEALS (Hellman et al., 2008a;
els and also provide alternative inputs to earth system mod-       Roberts et al., 2018); these differences confirm that RE-
els (ESMs), regional climate models (RCMs) and ecosys-             VEALS corrects biases resulting from the non-linearity of
tem models (Gaillard et al., 2018; Harrison et al., 2020).         the pollen–vegetation relationship.
This allows improved assessments of biogeophysical and                In this paper we present the results of the second genera-
biogeochemical forcings on climate due to LULCC over the           tion of REVEALS-based reconstruction of plant cover over
Holocene (Gaillard et al., 2010a; Harrison et al., 2020; Rud-      the Holocene in Europe after the first reconstruction pub-
diman et al., 2016; Strandberg et al., 2014, 2022).                lished by Trondman et al. (2015). This second-generation
   Europe is of particular interest as one of the global re-       reconstruction is, to date, the most spatially and tempo-
gions that has experienced major human-induced land-cover          rally complete estimate of plant cover for Europe across
transformations. Europe has large N–S and W–E gradients            the Holocene. As with the Trondman et al. (2015) recon-
in modern and historical climate and land use (Marquer et          struction, this new dataset is specifically designed to be
al., 2014, 2017). Early agriculture dates back to the start        used in climate modelling. It is performed at a spatial
of the Holocene in the south-eastern Mediterranean region          scale of 1◦ × 1◦ (ca. 100 km × 100 km) across 30–75◦ N,
(Palmisano et al., 2019; Roberts et al., 2019; Shennan, 2018),     25◦ W–50◦ E (Europe and part of the eastern Mediterranean–
and human impact on vegetation across most of Europe is            Black Sea–Caspian corridor) (Fig. 1). The number of pollen
characterized by early land-cover changes through agricul-         records used (1128), the area covered and time length (en-
ture and the use of fire (Feurdean et al., 2020; Marquer et al.,   tire Holocene) are a significant advancement for the re-
2014; Strandberg et al., 2014, 2022; Trondman et al., 2015).       sults presented in Trondman et al. (2015), which used 636
There is therefore a clear need to extend quantitative vegeta-     pollen records covering NW Europe (including Poland and
tion reconstruction to the whole of Europe, including for the      the Czech Republic but excluding western Russia and the
first time the Mediterranean region and additional areas of        Mediterranean area) and produced estimates for five time
eastern Europe. The increase in the spatial coverage of sites      windows (in cal yr BP, hereafter abbreviated BP): 6200–
and temporal scale to the entire Holocene to capture tran-         5700, 4200–3700, 700–350 and 350–100 BP and 100 BP to
sient vegetation change at sub-millennial timescales is vital      present. Marquer et al. (2014, 2017) produced continuous
to capture information on the transformation of the biosphere      REVEALS reconstructions over the entire Holocene, how-
by human actions. Europe has a deep history of pollen data         ever, only for transects of individual sites (19 pollen records)
production (Edwards et al., 2017) and an open-access reposi-       and groups of grid cells around them.
tory for pollen records (the European Pollen Database, EPD)
as well as regional pollen repositories (list of databases and
access links in Sect. 2.2 and the “Data availability” section).    2     Methods
These data repositories result in abundant pollen records that
can be used for data-driven reconstructions of past vegetation     2.1    REVEALS model and parameters
patterns at continental scales. Pollen-based vegetation recon-
structions for Europe have used community-level approaches         The REVEALS model (Sugita, 2007a) is a generalized ver-
(Huntley, 1990), biomization methods (Davis et al., 2015;          sion of the R value model of Davis (1963). The devel-
Prentice et al., 1996), modern analogue techniques (MATs;          opment of pollen–vegetation modelling from the R value
Zanon et al., 2018) and pseudobiomization (Fyfe et al., 2010,      model, via the ERV (extended R value) models of Ander-
2015; Woodbridge et al., 2014). These approaches capture           sen (1970) and Parsons and Prentice (1981) through to the
the major trends in vegetation patterns over the course of         REVEALS model, is described in detail in numerous earlier
the Holocene (Roberts et al., 2018; Sun et al., 2020), and         papers (Broström et al., 2004; Bunting et al., 2013a; Sugita,
biomization methods have proved useful for evaluation of           1993, 2007a).
climate model results (Prentice and Webb, 1998). The re-              Using simulations, Sugita (2007a) showed that “large
sults of these forms of pollen data manipulation either clas-      lakes” represent regional vegetation; i.e. between-lake dif-
sify pollen data into discrete classes (e.g. biomization, pseu-    ferences in pollen assemblages are very small, which was
dobiomization) or are semi-quantitative, capturing relative        the case for lakes ≥ 50 ha in the simulations (Sugita, 2007a).
change though time based on all pollen taxa within a sam-          Tests using modern pollen data from surface lake sediments
ple. They cannot achieve reconstructions of the cover of ev-       have shown that pollen assemblages from lakes ≥ 50 ha are
ergreen versus summer-green trees, for example, or the cover       appropriate to estimate regional plant cover using the RE-
of individual tree and herb taxa. Although useful in summa-        VEALS model (e.g. tests by Hellman et al., 2008a, b, in
rizing palynological change over time based on entire pollen       southern Sweden and by Sugita et al., 2010, in northern
assemblages, such outputs are of limited use when differen-        America).

https://doi.org/10.5194/essd-14-1581-2022                                          Earth Syst. Sci. Data, 14, 1581–1619, 2022

1584                                E. Githumbi et al.: European pollen-based REVEALS land-cover reconstructions for the Holocene

Figure 1. Study region showing site coverage. (a) Colours represent different modern biomes (purple: boreal; yellow: temperate; blue:
Mediterranean), while size and colour of circle represent site type and size (see caption in panel a). (b) Grid cell reliability dependent on
number of pollen records. Black grid cells: reliable results; grey grid cells: less reliable results. Reliable: ≥ 1 large lake(s), ≥ 2 small lake(s)
and/or small bog(s), mix of ≥ 1 large lake(s) and ≥ 1 small lake(s) and/or small bog(s); less reliable: 1 bog (large or small) or 1 small lake.
See Sect. 4.1 for details and discussion on reliability of REVEALS results.

  The REVEALS model (Eq. 1) calculates estimates of re-                             records from multiple “small lakes” (< 50 ha), i.e. lakes for
gional vegetation abundance in proportions or percentage                            which between lake differences in pollen assemblages can
cover using fossil pollen counts from large lakes (Sugita,                          be large. However, the REVEALS estimates using pollen
2007a).                                                                             records from small lakes generally have larger standard er-
                           Zmax                                                     rors (SEs) than those based on pollen data from large lakes.
                            R
               ni,k /α̂i           gi (z)dz                                         The latter was demonstrated for empirical pollen records
                           R                             ni,k /α̂i Ki               from large lakes versus small sites (lakes and bogs) by
V̂i =                                           !=   m                        (1)
        m                   Zmax                     P                              Trondman et al. (2016) in southern Sweden and Mazier et
        P
                nj,k /α̂j
                             R
                                     gj (z)dz               (nj,k /α̂j Kj )
                                                     j =1                           al. (2012) in the Czech Republic. Although the application
        j =1                   R
                                                                                    of the model to pollen data from bogs violates the model as-
The assumptions of the REVEALS model are listed in                                  sumption that no plants grow on the basin, REVEALS can
Sugita (2007a). Using simulations Sugita (2007a) demon-                             be applied using models of pollen dispersal and deposition
strated that, in theory, the model can also be applied to pollen

Earth Syst. Sci. Data, 14, 1581–1619, 2022                                                         https://doi.org/10.5194/essd-14-1581-2022
E. Githumbi et al.: European pollen-based REVEALS land-cover reconstructions for the Holocene                                1585

for lakes or bogs. The Prentice model (Prentice, 1985, 1988)        ual pollen records and the values of model parameters used
describes deposition of pollen at a single point in a depo-         are described below (Sect. 2.2 and 2.3).
sition basin and is suitable for pollen records from bogs.
Sugita (1993) developed the “Prentice–Sugita model” that
describes pollen deposition in a lake, i.e. on its entire sur-      2.2   Pollen records – data compilation and preparation
face with subsequent mixing in the water body before depo-
sition at the lake bottom. The original versions of both mod-       A total of 1143 pollen records from 29 European coun-
els use the Sutton model of pollen dispersal, i.e. a Gaussian       tries and the eastern Mediterranean–Black Sea–Caspian cor-
plume model from a ground-level source under neutral at-            ridor were obtained from databases and individual data con-
mospheric conditions (Sutton, 1953). A Lagrangian stochas-          tributors. The contributing databases include the European
tic model (LSM) of dispersion has also been introduced as           Pollen Database (Fyfe et al., 2009; Giesecke et al., 2014),
an alternative for the description of pollen dispersal in mod-      the Alpine Palynological Database (ALPADABA; Institute
els of the pollen–vegetation relationship in general and in         of Plant Sciences, University of Bern; now also archived in
the REVEALS model in particular (Theuerkauf et al., 2012,           EPD), the Czech Quaternary Palynological Database (PA-
2016). It is difficult, in both theory and practice, to eliminate   LYCZ; Kuneš et al., 2009), PALEOPYR (Lerigoleur et al.,
the effects of pollen coming from plants growing on sedi-           2015), and datasets compiled within synthesis projects from
mentary basins (e.g. Poaceae and Cyperaceae in bogs) on             the Mediterranean region (Fyfe et al., 2018; Roberts et al.,
regional vegetation reconstruction. Previous studies have as-       2019) and the eastern Mediterranean–Black Sea–Caspian
sessed the impacts of the violation of this assumption on RE-       corridor (EMBSeCBIO project; Marinova et al., 2018) (see
VEALS outcomes (Mazier et al., 2012; Sugita et al., 2010;           Fig. 1 for map, “Data availability” section for data location
Trondman et al., 2016, 2015). An empirical study in southern        and “Team list” for individual pollen data contributors). We
Sweden (Trondman et al., 2016) indicated that REVEALS               followed the protocols and criteria published in Mazier et
estimates based on pollen records from multiple small sites         al. (2012) and Trondman et al. (2015) for selection of pollen
(lakes and/or bogs) are similar to the REVEALS estimates            records and application of the REVEALS model. Available
based on pollen records from large lakes in the same re-            pollen records were filtered based on criteria including basin
gion. The results also suggested that increasing the number         type (to exclude archaeological sites and marine records) and
of pollen records significantly decreased the standard error        quality of chronological control (excluding sites with poor
of the REVEALS estimates, as expected based on simula-              age–depth models or fewer than three radiocarbon dates).
tions (Sugita, 2007a). It is therefore appropriate to use pollen    This resulted in 1128 pollen records from lakes and bogs,
records from small bogs to increase the number of pollen            both small and large. The rationale behind the use of pollen
records included in a REVEALS reconstruction following              records from small sites is based on the knowledge that RE-
the protocol of the first-generation REVEALS reconstruc-            VEALS estimates based on pollen records from multiple
tion for Europe (Mazier et al., 2012; Trondman et al., 2015).       sites provide statistically validated approximations of the re-
However, REVEALS estimates of plant cover using pollen              gional cover of plant taxa (e.g. Trondman et al., 2016; see
assemblages from large bogs should only be interpreted with         details of the REVEALS model in Sect. 2.1).
great caution (Mazier et al., 2012; see also Sect. 4, “Discus-         The taxonomy and nomenclature of pollen morphologi-
sion”).                                                             cal types from the 1128 pollen records were harmonized.
   The inputs needed to run the REVEALS model are orig-             The pollen morphological types were then consistently as-
inal pollen counts, relative pollen productivity estimates          signed to 1 of 31 RPP taxa (Table 1; see Sect. 2.3 and Appen-
(RPPs) and their standard deviation, fall speed of pollen           dices A–C for details on the RPP dataset used in this study),
(FSP), basin type (lake or bog), size of basin (radius), maxi-      following the protocol outlined in Trondman et al. (2015;
mum extent of regional vegetation, wind speed (m s−1 ), and         SI-2 with examples of harmonization between pollen mor-
atmospheric conditions. FSP can be calculated using mea-            phological types and RPP taxa). This process takes into ac-
surements of the pollen grains and Stokes’ law (Gregory,            count plant morphology, biology and ecology of the species
1973). RPPs of major plant taxa can be estimated using              that are included in each pollen morphological type. Conse-
datasets of modern pollen assemblages and related vegeta-           quently, RPP-harmonized pollen count data were produced
tion and the extended R value model (e.g. Mazier et al.,            for each of the 1128 pollen records. It should be noted that
2008). RPPs exist for a large number of European plant taxa,        the EMBSeCBIO data do not contain pollen counts from
and syntheses of FSPs and RPPs were published earlier by            cultivars; i.e. pollen from cereals and cultivated trees were
Broström et al. (2008) and Mazier et al. (2012). The latter         deleted from the pollen records (Marinova et al., 2018).
was used in the “first-generation” REVEALS reconstruction           Therefore, the cover of agricultural land (represented by ce-
(Trondman et al., 2015). A new synthesis of European RPPs           reals in this reconstruction) will always be zero in the east-
was performed for this “second-generation” reconstruction           ern Mediterranean–Black Sea–Caspian corridor in grid cells
(Appendices A, B and C). Preparation of data from individ-          with only pollen records from EMBSeCBIO, even though
                                                                    agriculture did occur in the region from the early Neolithic.

https://doi.org/10.5194/essd-14-1581-2022                                          Earth Syst. Sci. Data, 14, 1581–1619, 2022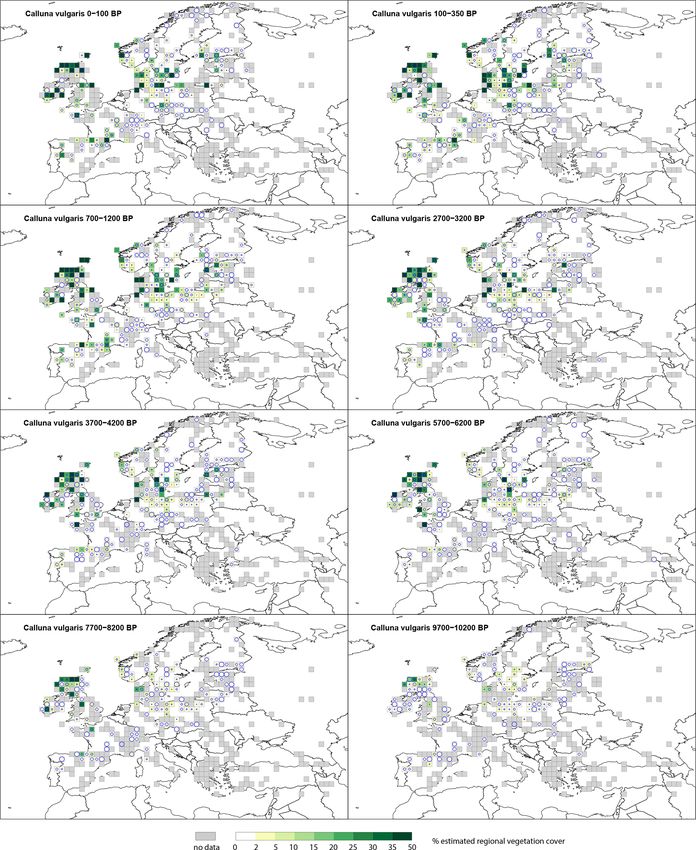
1586                    E. Githumbi et al.: European pollen-based REVEALS land-cover reconstructions for the Holocene

   For the application of REVEALS, an age–depth model (in         for the 54 plant taxa and, for comparison, the mean RPP val-
cal yr BP) is required for each pollen record. We used the au-    ues from Mazier et al. (2012) and from the recent synthe-
thor’s original published model, the model available in the       sis by Wieczorek and Herzschuh (2020). Moreover, compar-
contributing database or, where necessary, a new age–depth        ison with the RPP values of three studies not used in our
model was constructed following the approach in Trond-            synthesis is shown in Table A2. For the REVEALS recon-
man et al. (2015). The age–depth model for each pollen            structions presented in this paper, we excluded strictly ento-
record is used to aggregate RPP-harmonized pollen count           mophilous taxa, which resulted in a total of 31 taxa (Table 1).
data into 25 time windows throughout the Holocene follow-         The excluded taxa are Compositae (Asteraceae) SF Cichori-
ing a standard time division used in Mazier et al. (2012)         oideae, Leucanthemum (Anthemis) t., Potentilla t., Ranun-
and Trondman et al. (2015), which were later adopted by the       culus acris t. and Rubiaceae. We included entomophilous
Past Global Changes (PAGES) LandCover6k working group             taxa that are known to be characterized by some anemophily,
(Gaillard et al., 2018). The first three time windows (present–   e.g. Artemisia, Amaranthaceae/Chenopodiaceae, Rubiaceae
100 BP (where present is the year of coring), 100–350 BP,         and Plantago lanceolata. We excluded plant taxa with only
350–700 BP) capture the major human-induced land-cover            one RPP value except Chenopodiaceae, Urtica, Juniperus
changes since the early Middle Ages. Subsequent time win-         and Ulmus and the seven exclusively sub-Mediterranean and
dows are contiguous 500-year-long intervals (e.g. 700–1200,       Mediterranean taxa mentioned above.
1200–1700, 1700–2200 BP) with the oldest interval repre-             The FSP values (Tables 1 and A1) for boreal and temper-
senting the start of the Holocene (11 200–11 700 BP). The         ate plant taxa were obtained from the literature (Broström
use of 500-year-long time windows is motivated by the ne-         et al., 2008; Mazier et al., 2012); these values were in
cessity to obtain sufficiently large pollen counts for reliable   turn extracted from Gregory (1973) for trees and calculated
REVEALS reconstructions. Since the size of the error in the       based on pollen measurements and Stokes’ law for herbs
REVEALS estimate partly depends on the size of the pollen         (Broström et al., 2004). FSPs for Mediterranean taxa (Buxus
count (Sugita, 2007a), the length of the time window should       sempervirens, Castanea sativa, Ericaceae (Mediterranean
be a reasonable compromise to ensure both a useful time           species), Phillyrea, Pistacia and Quercus evergreen type)
resolution of the reconstruction and an acceptable reliabil-      were obtained by using pollen measurements and Stokes’
ity of the REVEALS estimate of plant cover (Trondman et           law (Mazier et al., unpublished); the FSP of Carpinus be-
al., 2015).                                                       tulus (Mazier et al., 2012) was used for Carpinus orientalis
                                                                  (Grindean et al., 2019).
2.3    Model parameter setting
                                                                     The site radius was obtained from original publications
                                                                  where possible. Sites in the EMBSeCBIO were classified as
For the purpose of this study, a new synthesis of the RPP         small (0.01–1 km2 ), medium (1.1–50 km2 ) or large (50.1–
values available for European plant taxa was performed in         500 km2 ). These were assigned radii of 399, 2921 and
2018–2019 based on the work by Mazier et al. (2012) and           10 000 m, respectively. Where a site’s radius could not be
additional RPP studies published since then (Appendices A–        determined from publication, it was geolocated in Google
C). This synthesis provides new alternative RPP datasets          Earth, and the area of the site was measured. A radius value
for Europe, including or excluding plant taxa with domi-          was extracted assuming that a site shape is circular (Mazier
nant entomophily and with the important addition of plant         et al., 2012). A constant wind speed of 3 m s−1 , assumed to
taxa from the Mediterranean area (Appendix A, Table A1).          correspond approximatively to the modern mean annual wind
The selection of RPP studies, RPP values (shown in Ap-            speed in Europe, was used following Trondman et al. (2015).
pendix B, Tables B1 and B2), and calculation of mean RPP          Zmax (maximum extent of the regional vegetation) was set to
and their standard error (SD) for Europe are explained in         100 km. Zmax and wind speed influence on REVEALS esti-
Appendix C. The location of studies included in the RPP           mates have been evaluated earlier in simulation and empiri-
synthesis is shown in Fig. C1, and related information is         cal studies (Gaillard et al., 2008; Mazier et al., 2012; Sugita,
provided in Table C1. The synthesis includes a total of 54        2007a), which support the values used for these parameters.
taxa for which RPP values are available (Tables B1 and            Atmospheric conditions are assumed to be neutral (Sugita,
B2); 39 taxa from studies in boreal and temperate Europe;         2007a).
and 15 taxa from studies in Mediterranean Europe, of which
7 include exclusively sub-Mediterranean and Mediterranean         2.4   Implementation of REVEALS
taxa: Buxus sempervirens, Carpinus orientalis, Castanea
sativa, Ericaceae (Mediterranean species), Phillyrea, Pista-      REVEALS was implemented using the REVEALS func-
cia and evergreen Quercus type (t.). RPP values are available     tion within the LRA R package of Abraham et al. (2014)
from both boreal or temperate and Mediterranean Europe            (see “Code availability”, Sect. 5). The function enables the
for seven taxa: i.e. Poaceae (reference taxon), Acer, Corylus     use of deposition models for bogs (Prentice’s model) and
avellana, Apiaceae, Artemisia, Plantago lanceolata and Ru-        lakes (Sugita’s model) and two dispersal models (a Gaussian
biaceae (Table B2). Table A1 presents the new RPP dataset         plume model and a Lagrangian stochastic model taken from

Earth Syst. Sci. Data, 14, 1581–1619, 2022                                        https://doi.org/10.5194/essd-14-1581-2022
E. Githumbi et al.: European pollen-based REVEALS land-cover reconstructions for the Holocene                                                                          1587

Table 1. Land-cover types (LCTs) and plant functional types (PFTs) according to Wolf et al. (2008) and their corresponding pollen morpho-
logical types. Fall speed of pollen (FSP) and the mean relative pollen productivity (RPP) estimates from the new RPP synthesis (see Sect. 2.3
and Appendices A–C for details) with their standard deviations in brackets (see text for more explanations).

   Land-cover types (LCTs)              PFT          PFT definition                              Plant taxa/pollen mor-            FSP (m s−1 )              RPP (SD)
                                                                                                 phological types
   Evergreen trees (ETs)                TBE1         Shade-tolerant evergreen trees              Picea abies                                0.056       5.437 (0.097)
                                        TBE2         Shade-tolerant evergreen trees              Abies alba                                  0.12       6.875 (1.442)
                                        IBE          Shade-intolerant evergreen                  Pinus sylvestris                           0.031       6.058 (0.237)
                                                     trees
                                        MTBE         Mediterranean shade-tolerant                Phillyrea                                 0.015        0.512 (0.076)
                                                     broadleaved evergreen trees                 Pistacia                                   0.03        0.755 (0.201)
                                                                                                 Evergreen Quercus t.                     0.035*       11.043 (0.261)
                                        TSE          Tall shrub, evergreen                       Juniperus communis                         0.016           2.07 (0.04)
                                        MTSE         Mediterranean broadleaved tall              Ericaceae                                0.038*        4.265 (0.094)
                                                     shrubs, evergreen                           Buxus sempervirens                        0.032         1.89 (0.068)
   Summer-green trees (STs)             IBS          Shade-intolerant summer-green               Alnus glutinosa                            0.021      13.562 (0.293)
                                                     trees                                       Betula                                     0.024       5.106 (0.303)
                                        TBS          Shade-tolerant summer-green                 Carpinus betulus                           0.042        4.52 (0.425)
                                                     trees                                       Carpinus orientalis                        0.042          0.24 (0.07)
                                                                                                 Castanea sativa                             0.01       3.258 (0.059)
                                                                                                 Corylus avellana                           0.025           1.71 (0.1)
                                                                                                 Fagus sylvatica                            0.057       5.863 (0.176)
                                                                                                 Fraxinus                                   0.022       1.044 (0.048)
                                                                                                 Deciduous Quercus t.                       0.035       4.537 (0.086)
                                                                                                 Tilia                                      0.032        1.21 (0.116)
                                                                                                 Ulmus                                      0.032          1.27 (0.05)
                                        TSD          Tall shrub, summer-green                    Salix                                      0.022       1.182 (0.077)
   Open land (OL)                       LSE          Low shrub, evergreen                        Calluna vulgaris                           0.038       1.085 (0.029)
                                        GL           Grassland – all herbs                       Artemisia                                  0.025       3.937 (0.146)
                                                                                                 Amaranthaceae/Chenopodiaceae               0.019          4.28 (0.27)
                                                                                                 Cyperaceae                                 0.035        0.962 (0.05)
                                                                                                 Filipendula                                0.006            3 (0.285)
                                                                                                 Poaceae                                    0.035                 1 (0)
                                                                                                 Plantago lanceolata                        0.029        2.33 (0.201)
                                                                                                 Rumex acetosa t.                           0.018        3.02 (0.278)
                                        AL           Agricultural land – cereals                 Cerealia t.                                 0.06         1.85 (0.380)
                                                                                                 Secale cereale                              0.06         3.99 (0.320)
 * The FSP values of evergreen Quercus t. and Mediterranean Ericaceae according to the original study (Mazier, unpublished) are 0.015 and 0.051, respectively (see
 Appendix B, Table B3). The value of 0.035 (FSP of deciduous Quercus t.) and 0.038 (FSP of boreal–temperate Ericaceae) was used instead (see discussion in Sect. 4.2 for
 explanation); t : type, e.g. evergreen Quercus t. RPP used in this study is relative to grass pollen productivity where Poaceae = 1 (indicated in bold).

the DISQOVER package; Theuerkauf et al., 2016). Within                                    of Sugita (2007a). The REVEALS SE accounts for the stan-
this study, the Gaussian plume model was applied. The RE-                                 dard deviations of the relative pollen productivities for the
VEALS model was run on all pollen records within each                                     individual pollen taxa (Table 1) and the number of pollen
1◦ × 1◦ grid cell across Europe. The REVEALS function is                                  grains counted in the sample (Sugita, 2007a). The uncer-
applied to lake and bog sites separately within each 1◦ × 1◦                              tainties in the averaged REVEALS estimates of plant taxa
grid cell and combines results (if there is more than one                                 for a grid cell are calculated using the delta method (Stuart
pollen record per cell) to produce a single mean cover es-                                and Ord, 1994) and expressed as the SEs derived from the
timate (in proportion) and mean standard error (SE) for each                              sum of the within- and between-site variations in the RE-
taxon. The formulation of the SE is found in Appendix A                                   VEALS results in the grid cell. The delta method is a math-

https://doi.org/10.5194/essd-14-1581-2022                                                                     Earth Syst. Sci. Data, 14, 1581–1619, 2022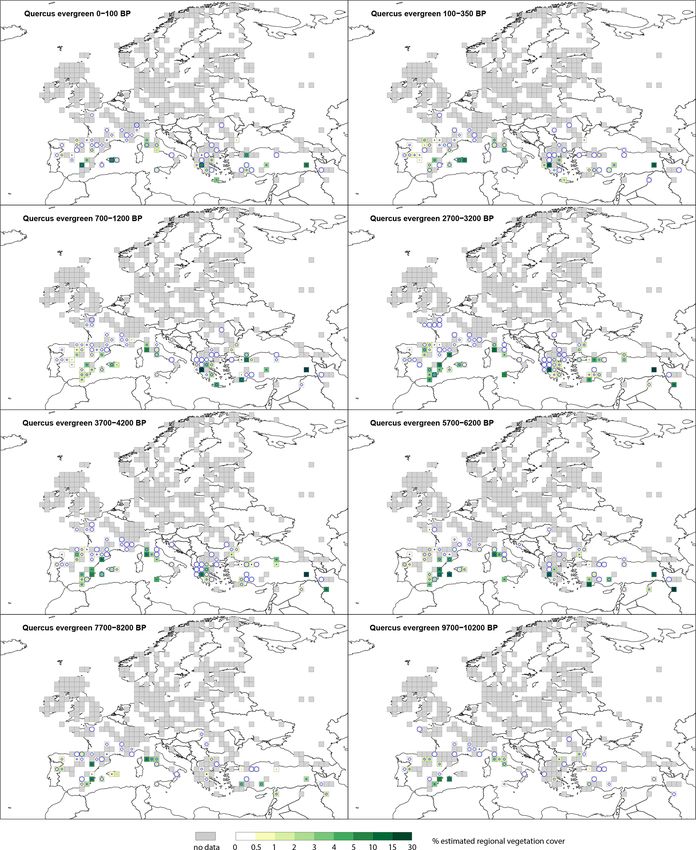
1588                    E. Githumbi et al.: European pollen-based REVEALS land-cover reconstructions for the Holocene

ematical solution to the problem of calculating the mean of       3     Results
individual SEs (see Appendix C in Li et al., 2020, for for-
mula and further details). Results of the REVEALS func-           The complete REVEALS land-cover reconstruction dataset
tion are extracted by time window, producing 25 matrices          includes mean REVEALS values (in proportions) and their
of mean REVEALS land-cover estimates and 25 matrices of           related mean SE for 31 individual tree and herb taxa, 12
corresponding mean SEs for each of the 31 RPP taxa and            PFTs, and 3 LCTs for each grid cell in 25 consecutive time
each grid cell. The 31 RPP taxa are also assigned to 12 plant     windows of the Holocene (11.7 cal kyr BP to present). Here,
functional types (PFTs) and 3 land-cover types (LCTs) (Ta-        results are illustrated by maps of the three LCTs (Figs. 2–4)
ble 1), and their mean REVEALS estimates were calculated.         and five taxa (Figs. 5–6, D1–D3). The presented maps are
These PFTs follow Trondman et al. (2015), with the addition       not part of the published dataset archived in the PANGAEA
of two PFTs for Mediterranean vegetation not reconstructed        online public database (see “Data availability”, Sect. 6); they
in earlier studies: Mediterranean shade-tolerant broadleaved      are examples of how the data can be visually presented and
evergreen trees (MTBE) and Mediterranean broadleaved tall         what they can be used for.
shrubs, evergreen (MTSE). The mean SE for LCTs and PFTs
including more than one plant taxon are calculated using the      3.1     Land-cover types
delta method (Stuart and Ord, 1994), as described above.
                                                                  The three land-cover types are evergreen trees (ETs),
                                                                  summer-green trees (STs) and open land (OL). ETs include
2.5    Mapping of the REVEALS estimates                           six PFTs which are composed of nine pollen morphological
To illustrate the information that the new REVEALS recon-         types (hereinafter referred to as taxa). STs include 3 PFTs
struction provides, we present and describe (Sect. 3) maps        which are composed of 12 taxa, while OL includes 3 PFTs
of the REVEALS estimates (per cent cover) and their asso-         that are in turn composed of 10 taxa (Table 1).
ciated SEs for the three LCTs (Figs. 2 to 4) and five taxa
for eight selected time windows: the five taxa are Cerealia       3.1.1    Open land (OL)
t. and Picea abies (Figs. 5 and 6), Calluna vulgaris, decid-
                                                                  At the start of the Holocene, open land (OL) (Fig. 2) has
uous Quercus type (t.), and evergreen Quercus t. (Figs. D1–
                                                                  higher cover in western Europe, where it generally exceeds
D3). The selection of the five taxa and eight time windows
                                                                  80 % compared with central Europe, where it is typically
is motivated essentially by notable changes in the spatial
                                                                  ∼ 60 %. There is a general decline in OL cover through the
distribution of these taxa through time, with higher resolu-
                                                                  early Holocene. At 5700–6200 BP most grid cells in cen-
tion for recent times characterized by the largest and most
                                                                  tral Europe have the lowest OL cover values of between
rapid human-induced changes in vegetation cover. For vi-
                                                                  10 %–50 %. In western Europe, whilst OL is generally re-
sualization purposes, the estimates are mapped in nine per
                                                                  duced, several grid cells on the Atlantic fringe of northern
cent cover classes. These fractions are the same for the three
                                                                  Scotland persistently maintain 80 %–90 % OL cover. OL in-
LCTs (Figs. 2–4), and the mapped output can therefore be
                                                                  creases from the mid-Holocene, and by 2700–3200 BP the
directly compared. In contrast, the colour scales used for the
                                                                  United Kingdom, France, Germany and the Mediterranean
five taxa vary between maps depending on the abundance of
                                                                  region have grid cells recording OL values > 70 %. In cen-
the PFT or taxon (Figs. 5 and 6, D1–D3). Different taxa thus
                                                                  tral, northern and eastern Europe grid cells, OL values vary
have different scales, and maps cannot be directly compared.
                                                                  between 10 %–70 % at 2700–3200 BP. Time windows from
We visualize uncertainty in our data by plotting the SE as
                                                                  the last 2 millennia show a consistent increase in OL with
a circle inside each grid cell; it is the coefficient of varia-
                                                                  values > 60 % across most of central, southern and western
tion (CV; i.e. the standard error divided by the REVEALS
                                                                  Europe and 20 %–70 % in northern Europe.
estimate). Circles are scaled to fill the grid cell if the SE
is equal to or greater than the mean REVEALS estimate
(i.e. CV ≥ 1). Grid-based REVEALS results that are based          3.1.2    Evergreen trees (ETs)
on pollen records from just one large bog or single small         The cover of evergreen trees (ETs) (Fig. 3) at 9700–
bogs or lakes provide lower-quality results (see Sect. 2.1 on     10 200 BP is < 30 % across Europe, and by 7700–8200 BP
the REVEALS model and Sect. 4.1, “Data reliability”). The         fewer than 30 grid cells show ETs > 50 %. ET cover slowly
quality of REVEALS land-cover estimates by grid cell and          increases through the early Holocene, and at 5700–6200 BP
time window is provided in Table GC_quality_by_TW (see            groups of grid cells in southern Europe record > 80 %, while
Sect. 6, “Data availability”). The percentage scale ranges we     in northern Europe ET cover ranges between 10 % and 60 %.
use here are different from those used in the maps of Trond-      There is a consistent increase in ET cover over Europe during
man et al. (2015), and therefore the data visualization cannot    the mid and late Holocene, with ET cover peaking at 2700–
be directly compared.                                             3200 BP before starting to decline. Across western parts
                                                                  of Europe, including the United Kingdom, western France,
                                                                  Denmark and the Netherlands, ETs never exceed 20 % cover.

Earth Syst. Sci. Data, 14, 1581–1619, 2022                                        https://doi.org/10.5194/essd-14-1581-2022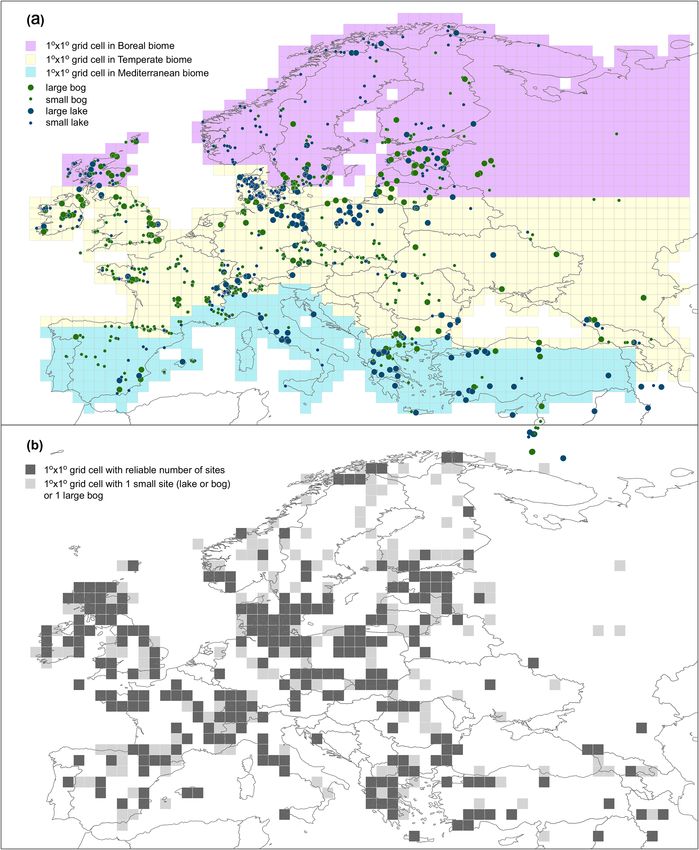
E. Githumbi et al.: European pollen-based REVEALS land-cover reconstructions for the Holocene                                        1589

Figure 2. Grid-based REVEALS estimates of open land (OL) cover for eight Holocene time windows. Percentage cover of open land in
10 % intervals represented by increasingly darker shades of green from 20 %. Grey cells: cells without pollen data for the time window but
with pollen data in other time windows. Circles in grid cells represent the coefficient of variation (CV; the standard error divided by the
REVEALS estimate). When SE ≥ REVEALS estimate, the circle fills the entire grid cell, and the REVEALS estimate is not different from
zero. This occurs mainly where REVEALS estimates are low.

https://doi.org/10.5194/essd-14-1581-2022                                               Earth Syst. Sci. Data, 14, 1581–1619, 2022
1590                      E. Githumbi et al.: European pollen-based REVEALS land-cover reconstructions for the Holocene

Figure 3. Grid-based REVEALS estimates of evergreen tree (ET) cover for eight Holocene time windows. Percentage cover of evergreen
trees in 10 % intervals represented by increasingly darker shades of green from 20 %. Grey cells: cells without pollen data for the time
window but with pollen data in other time windows. Circles in grid cells represent the coefficient of variation (CV; the standard error divided
by the REVEALS estimate). When SE ≥ REVEALS estimate, the circle fills the entire grid cell, and the REVEALS estimate is not different
from zero. This occurs mainly where REVEALS estimates are low.

Earth Syst. Sci. Data, 14, 1581–1619, 2022                                                  https://doi.org/10.5194/essd-14-1581-2022
E. Githumbi et al.: European pollen-based REVEALS land-cover reconstructions for the Holocene                            1591

3.1.3    Summer-green trees (STs)                                At 5700–6200 BP, almost all of central Europe has consis-
                                                                 tent but low cover of Picea abies; values are higher towards
The cover of summer-green trees (STs) (Fig. 4) in the early
                                                                 north-eastern Europe (Russia, Estonia, Latvia, Belarus and
Holocene at 9700–10 200 BP is > 40 % across Europe. A
                                                                 Lithuania), up to 30 %–50 %. By 2700–3200 BP the cover
small number (< 10) of grid cells in northern, western, cen-
                                                                 of Picea abies has increased across central (ca. 10 %) and
tral and southern Europe have ST cover > 60 %. This signif-
                                                                 north-eastern Europe (> 30 %). From 1200 BP, Picea abies
icantly increases towards 5700–6200 BP, at which time ST
                                                                 is recorded in northern Europe, particularly in Norway and
cover is > 60 % in central Europe and 40 %–60 % in north-
                                                                 Sweden, with some grid cells recording 25 %–50 % cover.
ern Europe. ST cover remains < 20 % in southern Europe.
From 5700–6200 BP there is a steady decline in ST cover
across Europe. At 2700–3200 BP only central Europe has ST        3.2.3   Calluna vulgaris
cover > 50 %, while values are < 50 % for the rest of Europe.
                                                                 During the Holocene, Calluna vulgaris cover (Fig. D1) peaks
There is a consistent decline over the last 2 millennia before
                                                                 at 50 % and is largely distributed in a central European
present. Most of Europe has ST cover < 30 % in the two last
                                                                 belt from the United Kingdom across to the southern Baltic
time windows (100–350 BP and 100 BP–present), except for
                                                                 States. At 9700–10 200 BP, it is recorded in only a few grid
a group of grid cells in the southern Baltic states and scat-
                                                                 cells, mostly in central and western Europe, and at lev-
tered records elsewhere.
                                                                 els < 10 %. Cover slowly increases, and by 7700–8200 BP,
                                                                 there are several grid cells with cover > 25 % within the
3.2     Selected taxa                                            United Kingdom and with 10 %–20 % cover within Den-
In terms of PFTs, Cerealia type (t.) is assigned to agricul-     mark. At 5700–6200 BP, grid cells in coastal locations in
tural land (AL), Picea abies to shade-tolerant evergreen trees   north-western Europe (particularly France, Germany and
(TBE1: Picea abies is the only taxon in this PFT), Cal-          Denmark) have 50 % Calluna vulgaris cover. Cover steadily
luna vulgaris to low evergreen shrubs (LSE: Calluna vul-         increases within the same grid cells, and by 2700–3200 BP,
garis is the only taxon in this PFT), deciduous Quercus          cover has increased in northern and eastern Europe, e.g. Nor-
t. to shade-tolerant summer-green trees (TBS) and evergreen      way and Estonia, with values up to 20 % cover. The highest
Quercus t. to Mediterranean shade-tolerant broadleaved ev-       cover of Calluna vulgaris is recorded in the last 2 millennia.
ergreen trees (MTBE) (Table 1).                                  Although some grid cells in south-eastern Europe record low
                                                                 cover values, these have high SE.
3.2.1    Cerealia type
                                                                 3.2.4   Deciduous Quercus type (t.)
Cerealia t. (Fig. 5) is recorded throughout the Holocene, with
10 %–15 % as the maximum cover. Cerealia t. is present in        Deciduous Quercus t. (Fig. D2) is recorded in central and
southern Europe at 9700–10 200 BP, with several grid cells       western Europe at 9700–10 200 BP at low levels (< 10 %),
recording > 5 % to 10 %. Whilst scattered grid cells in cen-     while in southern Europe (Italy) several grid cells record
tral and western Europe record the presence of Cerealia t.       > 20 % cover. By 7700–8200 BP, cover in central and west-
at very low levels (0.5 %–1 %), these values have high SE        ern Europe is between 1 %–10 %, while in northern and east-
(greater than the REVEALS estimate) and are therefore not        ern European grid cells it is < 2 % with high SEs. During the
different from zero; they correspond to single findings of Ce-   mid-Holocene (5700–6200 BP) most of Europe, with the ex-
realia t. By 5700–6200 BP, grid cells in Estonia and France      ception of some grid cells at the northern and south-eastern
record 3 %–5 % cover, and several regions within central and     extremes, records deciduous Quercus t. cover values between
western Europe record 0 %–5 % (0.5 %–1 %), although with         2 %–15 %. By 2700–3200 BP, % cover in the same grid cells
high SEs. At 2700–3200 BP, Cerealia t. is recorded across        has decreased to values between 2 %–10 %. Thereafter, the
central and western Europe, in the United Kingdom, France,       number of grid cells recording deciduous Quercus t. cover
Germany, and Estonia, with low values. In Norway, Sweden         remains similar; however, the percentage cover slowly de-
and Finland it has 0 %–1 % cover with high SEs. The highest      creases, and at 350–100 BP, the number of grid cells with
cover (> 5 %) is observed across Europe from 1200 BP.            deciduous Quercus t. cover above 5 % is very low.

3.2.2     Picea abies                                            3.2.5   Evergreen Quercus type (t.)

Picea abies cover (Fig. 6) is low (1 %–2 %) at 9700–             The spatial distribution of evergreen Quercus t. (Fig. D3) re-
10 200 BP, although a number of grid cells in central and        mains the same throughout the Holocene. Cover of > 30 %
eastern Europe record values between 30 % and 50 %. By           is restricted to only a few grid cells and time windows. At
7700–8200 BP, grid cells recording 30 %–50 % cover are ob-       the start of the Holocene, evergreen Quercus t. is recorded
served in more regions of central and eastern Europe than        with values < 15 % in southern Europe (Spain, Italy, Greece
earlier (Russia, Estonia, Romania, Slovakia and Austria).        and Turkey) with high SEs. Cover of evergreen Quercus

https://doi.org/10.5194/essd-14-1581-2022                                       Earth Syst. Sci. Data, 14, 1581–1619, 2022
1592 E. Githumbi et al.: European pollen-based REVEALS land-cover reconstructions for the Holocene Figure 4. Grid-based REVEALS estimates of summer-green tree (ST) cover for eight Holocene time windows. Percentage cover of STs in 10 % intervals represented by increasingly darker shades of green from 20 %. Grey cells: cells without pollen data for the time window but with pollen data in other time windows. Circles in grid cells represent the coefficient of variation (CV; the standard error divided by the REVEALS estimate). When SE ≥ REVEALS estimate, the circle fills the entire grid cell, and the REVEALS estimate is not different from zero. This occurs mainly where REVEALS estimates are low. Earth Syst. Sci. Data, 14, 1581–1619, 2022 https://doi.org/10.5194/essd-14-1581-2022
E. Githumbi et al.: European pollen-based REVEALS land-cover reconstructions for the Holocene                                         1593

Figure 5. Grid-based REVEALS estimates of Cerealia t. cover for eight Holocene time windows. Percentage cover in 0.5 % intervals
between 0 % and 3 %, 1 % intervals between 3 % and 5 %, and 5 % intervals between 5 % and 10 %. Intervals represented by increasingly
darker shades of green from 1 %–1.5 %. Grey cells: cells without pollen data for the time window but with pollen data in other time windows.
Circles in grid cells represent the coefficient of variation (CV; the standard error divided by the REVEALS estimate). When SE ≥ REVEALS
estimate, the circle fills the entire grid cell, and the REVEALS estimate is not different from zero. This occurs mainly where REVEALS
estimates are low.

https://doi.org/10.5194/essd-14-1581-2022                                                Earth Syst. Sci. Data, 14, 1581–1619, 2022
1594                      E. Githumbi et al.: European pollen-based REVEALS land-cover reconstructions for the Holocene

Figure 6. Grid-based REVEALS estimates of Picea cover for eight Holocene time windows. Percentage cover in 1 % intervals between 0 %
and 2 %, 3 % intervals between 2 % and 5 %, 5 % intervals between 5 % and 30 %, and 20 % intervals between 30 % and 50 %. Intervals
represented by increasingly darker shades of green from 5 %–10 %. Grey cells: cells without pollen data for the time window but with pollen
data in other time windows. Circles in grid cells represent the coefficient of variation (CV; the standard error divided by the REVEALS
estimate). When SE ≥ REVEALS estimate, the circle fills the entire grid cell, and the REVEALS estimate is not different from zero. This
occurs mainly where REVEALS estimates are low.

Earth Syst. Sci. Data, 14, 1581–1619, 2022                                               https://doi.org/10.5194/essd-14-1581-2022
E. Githumbi et al.: European pollen-based REVEALS land-cover reconstructions for the Holocene                             1595

t. does not exceed 15 % until 6700–7200 BP (not shown), in       for REVEALS reconstructions (Sugita, 2007a). The mean
grid cells located in Turkey, Greece and Italy. From 6700–       count size across all samples is 3550. Samples with count
7200 BP there is an increase in the number of grid cells         sizes lower than 1000 are still used but result in higher SEs.
recording evergreen Quercus t. in southern Europe, but most      More than half of the pollen records used in the study were
show low cover values (< 15 %) and have high SEs.                sourced from databases (see Sect. 2.2). Note that the EMB-
                                                                 SeCBIO taxonomy has been pre-standardized, and the data
4     Discussion                                                 compilers have removed Cerealia type (t.). This means that
                                                                 for grid cells within the eastern Mediterranean–Black Sea–
The results presented here are the first full-Holocene grid-     Caspian corridor, caution is advised in the interpretation of
based REVEALS estimates of land-cover change for Eu-             Cerealia type. Nevertheless, pollen from ruderals that are
rope spanning the Mediterranean and temperate and boreal         often related to agriculture, for example, Artemisia, Ama-
biomes and the first to highlight the spatial and temporal dy-   ranthaceae/Chenopodiaceae and Rumex acetosa type, are in-
namics of 31 plant taxa, 12 PFTs and 3 LCTs across Eu-           cluded in the land-cover type open land (OL); therefore,
rope over the last 11 700 years. Previous studies have demon-    changes in OL cover in the eastern Mediterranean–Black
strated major differences between REVEALS results and            Sea–Caspian corridor may be related to changes in agricul-
pollen percentages (Marquer et al., 2014; Trondman et al.,       tural land (see also discussion below, Sect. 4.3, “agricultural
2015) and the differences between REVEALS results and            land” PFT).
other methods used to transform pollen data, including pseu-        Aggregation of pollen counts to time windows depends on
dobiomization, and MAT (Roberts et al., 2018). It is not         age–depth models. We have used the best age–depth mod-
within the scope of this paper to evaluate the results in that   els available to us, based on the chronologies presented in
context. This discussion focuses on the reliability and po-      Giesecke et al. (2014) for EPD sites and through liaison with
tential of this “second generation” of REVEALS land-cover        data contributors. Nevertheless, future REVEALS runs may
reconstruction for Europe for use by the wider science com-      draw on improvements to age–depth modelling, which may
munity.                                                          result in some original pollen count data being assigned to
                                                                 different time windows.
                                                                    The REVEALS results presented here are provided for
4.1    Data reliability
                                                                 1◦ × 1◦ grid cells across Europe. The size and number of
The REVEALS results are reliant on the quality of the input      suitable pollen records is an important factor in the qual-
datasets, namely pollen count data, chronological control for    ity of the REVEALS estimates for each grid cell. The RE-
sequences, and the number and reliability of RPP estimates       VEALS model was developed for use with large lakes (≥
used (see discussion on RPPs in Sect. 4.2). The standard er-     50 ha; Sugita, 2007a) that represent regional vegetation. Grid
rors (SEs) can be considered a measure of the precision of the   cells with multiple large lakes will thus provide results with
REVEALS results and of reliability and quality (Trondman         the highest level of certainty and reflect the regional vege-
et al., 2015). Where SEs are equal to or greater than the RE-    tation most accurately. These grid cell results comprised of
VEALS estimates (represented in the maps of Figs. 2–6 and        one or more large lakes, several small sites (lake or bog), or
D1–D3 as a circle that fills the grid), caution should be ap-    a mix of large site(s) and small sites are considered “high-
plied when using the REVEALS estimates as it implies that        quality” (dark-grey grids in Fig. 1b). It has been shown both
they are not different from zero when taking the SEs into ac-    theoretically (Sugita, 2007a) and empirically (Fyfe et al.,
count. Whilst this is possible within an algorithmic approach    2013; Trondman et al., 2016) that pollen records from multi-
that includes estimates of uncertainty, it is conceptually im-   ple smaller (< 50 ha) lakes will also provide REVEALS es-
possible to have negative vegetation cover. If SEs ≥ mean        timates that reflect regional vegetation. However, SEs may
REVEALS value, it is therefore uncertain whether the plant       be larger if there is high variability in pollen composition
taxon has cover within the grid cell. Either the cover may be    between records. We therefore also consider grid cells with
very low, or the taxon may be absent within the region (grid     multiple sites “high-quality”. Application of REVEALS to
cell in this case).                                              pollen records from large bogs violates assumptions of the
   The size of pollen counts impacts the size of REVEALS         model (see Sect. 2.1 above). Therefore, REVEALS estimates
SEs (Sugita, 2007a); larger counts result in smaller SEs. Ag-    for grid cells including large bogs or single small sites (lake
gregation of samples from pollen records to longer time win-     or bog) may not be representative of regional vegetation, par-
dows results in larger count sizes and thus lower SEs (see       ticularly in areas characterized by heterogeneous vegetation.
Sects. 2.2 above and 4.2 below). Our input dataset includes      We consider such estimates to be “lower-quality” (light-grey
more than 59 million individual pollen identifications, orga-    grids in Fig. 1b), although they may still provide first-order
nized here into 16 711 samples from 1128 sites, where a sam-     indications of vegetation cover and represent an improve-
ple is an aggregated pollen count for RPP taxa for a time        ment in pollen percentage data (Marquer et al., 2014). Our
window at a site. A total of 77 % of samples have count          results provide REVEALS estimates for a maximum of 420
sizes in excess of 1000, which is deemed most appropriate        grid cells per time window. The number and type of pollen

https://doi.org/10.5194/essd-14-1581-2022                                       Earth Syst. Sci. Data, 14, 1581–1619, 2022
1596 E. Githumbi et al.: European pollen-based REVEALS land-cover reconstructions for the Holocene
records in a grid cell can change between time windows: not rope only for the sub-Mediterranean and/or Mediterranean
all pollen records cover the entire Holocene. To assess the taxa (including Ericaceae) (Tables 1 and A1), and for all
reliability of individual results it is important to consider not other taxa we used the RPPs from boreal/ temperate Europe.
just the number and type of pollen records in the total dataset, The major issue with this choice is the RPP value of Eri-
but how these change between the time windows. Results for caceae. Using only the large value from Mediterranean Eu-
a maximum of 143 grid cells are based on 3 or more sites, rope may lead to an under-representation of Ericaceae (Cal-
65 on 2 sites, and a minimum of 212 grid cells on a single luna excluded), in particular in boreal Europe, but perhaps
site. The results of a maximum of 67 grid cells are based on also in temperate Europe. Using only the small value from
single small bogs (< 400 m radius), 68 on single small lakes boreal–temperate Europe may lead to an over-representation
(< 400 m radius), and 82 on single large bogs. of Ericaceae in Mediterranean Europe.
Until we have more RPP values for each taxon, it is not
4.2 Role of RPPs and FSP in REVEALS results
possible to disentangle the effect of all factors influencing
the estimation of RPPs and to separate the effect of method-
A key assumption of the REVEALS model is that RPP val- ological factors from those of factors such as vegetation type,
ues are constant within the region of interest and through climate and land use. The only way to evaluate the reliabil-
time (Sugita, 2007a). Nevertheless, it has been suggested that ity of RPP datasets is to test them with modern or historical
RPPs may vary between regions, with the variation caused pollen assemblages and related plant cover (Hellman et al.,
by environmental variability (climate, land use), vegetation 2008a, b). We argue that RPP values of certain taxa may not
structure or methodological design differences (Broström et vary substantially within some plant families or genera, while
al., 2008; Hellman et al., 2008a; Mazier et al., 2012; Li et they might be variable within others, depending on the char-
al., 2020; Wieczorek and Herzschuh, 2020). Wieczorek and acteristics of flowers and inflorescences that may be either
Herzschuh (2020) have shown that inter-taxon variability in very different or relatively constant within families or genera
RPP values is generally lower than intra-taxon variability, (see discussion in Li et al., 2018). Therefore, we advise to
lending support to application of the approach we used in use compilations of RPPs at continental or sub-continental
the new synthesis of RPPs for Europe (Appendices A–C), scales rather than compilations at multi-continental scales
i.e. calculation of mean RPPs using all available RPP values as the Northern Hemisphere dataset proposed by Wieczorek
that can be considered to be reliable. Nevertheless, some RPP and Herzschuh (2020). We consider the RPP selection used
taxa still present a challenge, for example, Ericaceae, where within this work as the most suitable for Europe to date but
Mediterranean tree forms have a greater number of inflores- expect revised and improved RPP values as more RPP em-
cences and hence may have a higher RPP than low-growth- pirical studies are published. Moreover, experimentation in
form Ericaceae in central and northern Europe. As we only REVEALS applications will allow future studies to evaluate
have a unique RPP value for Ericaceae in boreal–temperate the effects of using different RPP datasets on land-cover re-
Europe and a unique RPP value in Mediterranean Europe, the constructions (e.g. Mazier et al., 2012).
large difference in RPP between the two biomes remains to The role of FSP values in the pollen dispersal and de-
be confirmed with more RPP studies. position function (gi (z) in Eq. 1 of the REVEALS model,
Currently there is higher confidence in the boreal and tem- Sect. 2.1) has been discussed by Theuerkauf et al. (2012). In
perate RPP values that are based on a wider set of studies this application of REVEALS we used the Gaussian plume
increasing the spread of values and hence reliability of the model (GPM) of dispersion and deposition as most exist-
mean RPP values used (Mazier et al., 2012; Wieczorek and ing RPP values have been estimated using this model. The
Herschuh, 2020), whilst RPP values for Mediterranean taxa GPM approximates dispersal as a fast-declining curve with
are based on fewer empirical RPP studies. The new RPP distance from the source plant, which implies short distances
datasets for Europe produced for this study (Appendices A– of transport for pollen grain with high FSP compared to
C) can be used in different ways. The RPPs provided in Ta- other models of dispersion and deposition (Theuerkauf et al.,
ble A1 can be used for the entire European region, includ- 2012). We have used the FSP values obtained for decidu-
ing or excluding entomophilous taxa and including all val- ous Quercus type (t.) (0.035 m s−1 ) and boreal–temperate Er-
ues from the Mediterranean area or only the values for the icaceae (0.037 m s−1 ) for evergreen Quercus t. and Mediter-
strictly sub-Mediterranean and/or Mediterranean taxa. If one ranean Ericaceae, respectively, although the FSP values of
uses all RPPs from the Mediterranean area, there will be taxa those two taxa were estimated to be 0.015 and 0.051 in
for which there is both an RPP value obtained in boreal– the Mediterranean study (Tables 1 and A1). Whether using
temperate Europe and an RPP value obtained in Mediter- a lower FSP for evergreen Quercus t. (0.015 m s−1 ) and a
ranean Europe. Application of both RPP values in a single higher FSP for Mediterranean Ericaceae (0.051 m s−1 ) will
REVEALS reconstruction is not straightforward to achieve, have an effect on the REVEALS results is not known and
because the border between the two regions has shifted over requires further testing.
the Holocene. In the REVEALS reconstruction presented in
this paper, we chose to use the RPPs from Mediterranean Eu-
Earth Syst. Sci. Data, 14, 1581–1619, 2022 https://doi.org/10.5194/essd-14-1581-2022You can also read