Evaluation of the Different Methods to Detect Salmonella in Poultry Feces Samples
←
→
Page content transcription
If your browser does not render page correctly, please read the page content below
Evaluation of the Different Methods to Detect Salmonella in
Poultry Feces Samples
Reza Khaltabadi Farahani
Pasteur Institute of Iran
Maryam Meskini
Pasteur Institute of Iran
Arash Ghalyanchi Langeroudi
University of Tehran Faculty of Veterinary Medicine
Safoora Gharibzadeh
pasteur institute of iran
Soumya Ghosh
UV: University of the Free State
Amir Hossien Khaltabadi Farahani ( m_meskini@pasteur.ac.ir )
Arak University https://orcid.org/0000-0001-5805-590X
Research Article
Keywords: Salmonella, Poultry. Feces, Multiplex PCR, Culture
Posted Date: September 15th, 2021
DOI: https://doi.org/10.21203/rs.3.rs-894517/v1
License: This work is licensed under a Creative Commons Attribution 4.0 International License. Read Full License
Page 1/16Abstract
Salmonella is one of the most common causes of food-borne outbreaks and infection worldwide. The gold standard
detection method of Salmonella is cultivation. With time-consuming cultivation, there is a need to investigate rapid and
accurate processes. The study evaluated different approaches to detect Salmonella in poultry feces samples. Poultry farm
feces samples from 21 cities in Iran were collected from January 2016 to December 2019. Microbiological cultures,
serological assays, and multiplex PCR (m-PCR) were used to detect and characterize Salmonella spp. isolates. Serological
assays and m-PCR were used to determine the serogroups A, B, C1, C2, D1, E, H, and FliC. The m-PCR was used for the
detection of seven Salmonella serovars and a chi-square test was performed to compare the discriminatory power of the
methods. Out of 2300 poultry feces samples, 173 (7.5%) and 166 (7.2%) samples were detected as Salmonella spp. by
cultivation and m-PCR, respectively. The sensitivity of the molecular method was equal to cultivation at 0.96 (CI = 95%).
Assessment of H antigenic subgroups showed the same for both m-PCR and serological tests. Therefore, the matching rate
of the two methods for detection of all H antigenic subgroups was 100%. Thus, the relationship between the results
obtained from both methods was significant in the contingency table test (P < 0.01). The PCR-based approach confirmed the
detection of Salmonella in a shorter period (24–36 hours) compared to the conventional microbiological approach (3–8
days).
Introduction
Salmonella are gram-negative, rod-shaped bacteria in the family Enterobacteriaceae. Salmonella is the most common
bacterial pathogen associated with food-borne disease in the United States (Gu, Strawn, Zheng, Reed, & Rideout, 2019).
Poultry products, including meat and eggs, have been a significant source of Salmonella infections (J. Wang, Li, Liu, Cheng,
& Su, 2020). Salmonella infections account for 93.8 million cases and 155,000 deaths per year worldwide with several
serotypes involved such as Salmonella enterica serovar Enteritidis, S. enterica serovar Senftenberg, S. enterica serovar
Hadar, S. enterica serovar Agona, and S. enterica serovar Typhimurian (Gantois et al., 2008). S. enterica serovar Enteritidis is
the most reported in human outbreaks during the last two decades (Ghazalibina et al., 2019). Therefore, Salmonella spp.
infection prevention is crucial for poultry health and food processing industries.
Accordingly, the diagnosis and serotyping of Salmonella spp. are critical subjects. Conventional Salmonella detection
methods includes culturing in a selective medium, followed by colony characterization using biochemical and serological
tests (Kasturi, 2020). Most laboratories use serotyping as the main phenotyping method for subspecies Salmonella spp.
typing and approximately 2600 serotypes has been described according to the Kauffman–White-LeMinor scheme. Included
is the somatic antigen (O) determining the group, flagellar antigen (H) determining the serotype, and capsular antigen (K)
(Kariuki, Gordon, Feasey, & Parry, 2015).
Conventional detection methods are laborious and time-consuming. Serotyping methods are often ineffective as
epidemiological tools, because of their low discriminatory capacity for strains with the same serotype or similar biochemical
characteristics (Barrow & Neto, 2011). Therefore, it not often possible for research laboratories to detect Salmonella in-
house and isolates are sent to commercial or expert laboratories, which may delay the results (Diep et al., 2019).
Consequently, a rapid and sensitive method to detect Salmonella spp. and their serovars is required.
Some molecular techniques are widely used to detect Salmonella spp. and serovars. Molecular techniques are used instead
of conventional methods because of their reduced time for diagnosis with similar or higher efficiency, increased
discriminatory power, simplicity, better standardization, reproducibility, and higher sensitivity and specificity (Khaledi &
Meskini, 2020; Malorny, Huehn, Dieckmann, Krämer, & Helmuth, 2009). Molecular techniques based on the amplification of
DNA, such as multiplex polymerase chain reaction (m-PCR), have been used to detect Salmonella serotypes (Du et al.,
2020). The m-PCR uses pairs of primers that allow the simultaneous detection and identification of different specific DNA
sequences in the same reaction (Maciorowski, Pillai, Jones, & Ricke, 2005). To the best of our knowledge, the comparison of
traditional versus m-PCR techniques to detect Salmonella genus, serogroups, and serovars in Iran has not been conducted.
Page 2/16Therefore, this study compared the discriminatory power of several methods such as cultivation, serological, and m-PCR to
detect Salmonella genus, serogroups and serovar in farm poultry feces samples.
1. Materials And Methods
1.1. Collection of Samples and Isolation of Salmonella
Poultry feces samples from five different areas in each poultry farm were collected. Farms were located in Semnan, Fars,
Qazvin, Qom, Yazd, Khorasan Razavi, Mazandaran, Kerman, Alborz, South Khorasan, Kurdistan, Markazi, Isfahan,
Kohkiluyeh, Boyerahmad, West Azerbaijan, Golestan, Zanjan, Hamedan, Kermanshah, Khuzestan, and Lorestan, of Iran.
Samples were collected in sterile zipper bags from January 2016 to December 2019 using sterile spoons. All samples were
transported immediately to the Department of Molecular Microbiology, Pasteur Institute of Iran, while maintaining sterile and
cold chain conditions.
A 25 g of each sample was added to 225 mL 0.1% peptone water, and the mixture was incubated overnight at 37°C. After
incubation, 0.1 mL of each sample was transferred to 10 mL Rappaport-Vassiliadis Soy Peptone (RVS) Broth (Merck,
Germany) and incubated overnight at 41.5°C. Following the incubation, samples were cultured on Xylose Lysine
Desoxycholate (XLD) agar (Merck, Germany) and incubated overnight at 37°C. Red colonies with a black center were
subcultured in nutrient agar (NA) (Merck, Germany) to perform Gram staining and biochemical tests (Sobur et al., 2019).
Gram staining identified morphological characteristics and biochemical identification included sugar fermentation, Voges
Proskauer (VP) test, indole, and methyl red (MR) test (Alam et al., 2020). Following the identification of the isolates,
serotyping was performed by O (polyvalent), A, B, C1, C2, D1, and E antisera (MAST, Germany).
1.2. Dna Extraction And Molecular Detection Of Salmonella Genus
Genomic DNA was extracted using a High Pure PCR Template Preparation Kit (Roche, Germany) (Meskini & Esmaeili, 2018;
Meskini, Ghorbani, Bahadoran, & Esmaeili, 2020). Following the extraction, genomic DNA was subjected to polymerized
chain reaction (PCR) amplification of the invA gene using oligonucleotide primers, Fw 5´-AAA CGT TGA AAA ACT GAG GA-3'
and Rv 5´-TCG TCA TTC CAT TAC CTA CC-3' (MWG, Germany) (Hoorfar, Ahrens, & Rådström, 2000). The 25 µL of PCR
reaction mix final volume contained 15.2 µL distilled water, 2.5 µL buffer 10× (with 15 mM MgCl2), 1 µL dNTP (10mM), 1 µL
MgCl2 (25 mM), 10 µM of each of the primers, 0.3 µL Hot start Taq DNA polymerase (5U/µL) (QIAGEN, Germany), and 3 µL
DNA template. Thermal cycling condition consisted of one cycle of initial denaturation (95°C, 10 min), 35 cycles of
denaturation (94°C at 60 s), annealing (62°C at 90 s) extension step (72°C at 60 s), and a final extension cycle (72°C at 10
min). The PCR products were run on a 2% (w/v) agarose gel containing 1 µg/mL ethidium bromide. A 100 bp ladder) was
used. The PCR primers, GeneAmp™ PCR Core Kit, and DNA molecular marker were procured from MWG (Germany), Perkin
Elmer Cetus (Norwalk CT), and Bethesda Research Laboratories (Inc. Burlington, Ontario), respectively.
1.3. Multiplex PCR to Serogroup Typing Salmonella
The m-PCR was performed with a final volume of 25 µL in a gradient thermal cycler (Eppendorf, Germany). The optimized
PCR mixture for A$D group, OriC, and Vi strains consisted of 1.5 µL F- prt (10 µM), 1.5 µL R-prt, 1.5 µL P1 (10 µM), 1.5 µL P2,
1.5 µL F-vi (10 µM), and 1.5µL R-vi, 2.5 µL buffer 10X, 1 µL MgCl2 (25 mM), 1 µL dNTP (10 mM), 0.3 µL Taq (5 U/µl) (Hot
start PCR Taq plus DNA polymerase, QIAGEN, Germany), 5 µL sample (300–500 ng/µL), and 3.2 µL distilled water. The
optimized cycling parameters of the m-PCR consisted of pre-denaturation at 95°C for 10 min, followed by 35 cycles of 94°C
for 60 s, 56°C for 90 s, 72°C for 60 s, and a final extension at 72°C for 10 min. Inside, the P1-P2 primer pair targeting the oriC
gene was included as an internal control in all m-PCR reactions.
Page 3/16The optimized PCR mixture for B, C1, C2, D, and E strains consisted of 1.5 µL F-rfbj (10 µM), 1.5 µL R-rfbj, 1.5 µL F-tyv (10
µM), 1.5 µL R-tyv, 1.5 µL F-wzxC1 (10 µM), 1.5 µL R-wzxC1, 1.5 µL F-wzxE1 (10 µM), 1.5 µL R-wzxE1, 1.5 µL F-wzxC2 (10
µM), and 1.5 µL R-wzxC2, 2.5 µL buffer 10X, 1 µL MgCl2 (25 mM), 1 µL dNTP (10 mM), 0.3 µL Taq (5 U/µL) (Hot start PCR
Taq plus DNA polymerase, QUIAGEN, Germany), 5 µL sample (300–500 ng/µL), and 3.2 µL DW. The optimized cycling
parameters of the m-PCR consisted of pre-denaturation at 95°C for 10 min, followed by 35 cycles of 94°C for 60 s, 59°C for
90 s, 72°C for 60 s and a final extension at 72°C for 10 min .
The optimized PCR mixture for Ha, Hb, Hd, Hj, and oriC strains consisted of 1 µL F-H (10 µM), 1 µL R-Ha, 1 µL R-Hb (10 µM),
1 µL R-Hd, 1 µL P1, 1 µL P2, 2.5 µL buffer 10X, 1 µL MgCl2 (25mM), 1 µL dNTP (10 mM), 0.3 µL Taq (5 U/µl) (Hot start PCR
Taq plus DNA polymerase, QIAGEN, Germany), 5 µL of the sample (300–500 ng/µL), and 9.2 µL DW. The optimized cycling
parameters of the m-PCR consisted of pre-denaturation at 95°C for 10 min, followed by 35 cycles 94°C for 60 s, 56°C for 90
s, 72°C for 60 s, and a final extension at 72°C for 10 min.
The PCR was performed in a thermocycler (Eppendorf Thermomixer comfort, Germany). The oligonucleotide sequences
used in this study, annealing temperature, and the expected band size are listed in Table 1. The PCR product fragments were
analyzed in 2% (w/v) agarose gel by electrophoresis using a 1X TAE buffer. Fragment size was determined by comparison
with Gene-Ruler 100 bp DNA ladder (Fermentas, EU).
Page 4/16Table 1
The m-PCR primers sequence, target gene, target serogroup detected, and the expected band size
Serogroups Target Primer Oligonucleotide sequences (5to3) Annealing PCR Reference
gene name temperature product
(°C) size
(bp)
B rfbj F-rfbj CCAGCACCAGTTCCAACTTGATAC 59 662 (Lim et al., 2003)
R-rfbj GGCTTCCGGCTTTATTGGTAAGCA
D tyv F-tyv GAGGAAGGGAAATGAAGCTTTT 59 614 (Hirose et al.,
2002)
R-tyv TAGCAAACTGTCTCCCACCATAC
C1 wzxC1 F- CAGTAGTCCGTAAAATACAGGGTGG 59 483 (Herrera-León et
wzxC1 al., 2007)
R- GGGGCTATAAATACTGTGTTAAATTCC
wzxC1
E wzxE1 F- TAAAGTATATGGTGCTGATTTAACC 59 345 (Herrera-León et
wzxE1 al., 2007)
R- GTTAAAATGACAGATTGAGCAGCAAG
wzxE1
C2 wzxC2 F- ACTGAAGGTGGTATTTCATGGG 59 154 (Herrera-León et
wzxC2 al., 2007)
R- AAGACATCCCTAACTGCCCTGC
wzxC2
A A$D F-prt CTTGCTATGGAAGACATAACGAACC 55 256 (Hirose et al.,
group 2002)
R-prt CGTCTCCATCAAAAGCTCCATAGA
OriC OriC P1 TTATTAGGATCGCGCCAGGC 55 163 (Widjojoatmodjo,
Fluit, Torensma,
Keller, & Verhoef,
P2 AAAGAATAACCGTTGTTCAC
1991)
Vi Vi F-vi GTTATTCAGCATAAGGAG 55 439 (Hirose et al.,
strain 2002)
R-vi CTTCCATACCACTTTCCG
H Ha F-H ACTCAGGCTTCCCGTAACGC 55 423 (Levy et al.,
2008)
Hb R-Ha GAGGCCAGCACCATCAAGTGC 551
Hd R-Hb GCTTCATACAGACCATCTTTAGTTG 763
Hj R-Hd GGCTAGTATTGTCCTTATCGG 502
1.4. Multiplex PCR to Serovar Typing Salmonella
The m-PCR was performed for invA (Styinva-JHO-2), sdf (S. enterica serovar Enteritidis), STM4492 (S. enterica serovar
Typhimurium), IE-1 (S. enterica serovar Enteritidis), Flic-C (S. enterica serovar Typhimurium), 878–897 (S. enterica serovar
Infantis), had (Salmonella serogroup C2), Cholerae-Suis Flin C, (Heidelberg) heli (predicted helicase), and (S. enterica serovar
Kentucky) gly (putative membrane protein) genes in a final volume of 25 µL in a gradient thermal cycler (Eppendorf™,
Mastercycler Pro, Germany). The optimized PCR mixture and cycling parameters consisted of pre-denaturation,
denaturation, annealing, extension, and the final extension for the mentioned genes (Tables 2 and 3). The PCR product
Page 5/16fragments were analyzed in 2% (w/v) agarose gel by electrophoresis using a 1X TAE buffer. Fragment size was determined
by comparison with Gene-Ruler 100 bp DNA ladder (Fermentas, EU). Type strain S. enterica serovar Enteritidis (ATCC 13076),
S. enterica serovar Typhimurium (ATCC 14028), S enterica serovar Typhimurium (ATCC1730), S. enterica serovar Infantis
(ATCC BAA-1675), S. enterica serovar Hadar (ATCC 51956), S. enterica serovar Dublin (ATCC 15480), Enterococcus faecalis
(ATCC ® 51299™), Citrobacter freundii (ATCC 8090), Escherichia coli (ATCC 25952), Klebsiella pneumoniae (ATCC 13883),
Acinetobacter lwoffii ATCC-type strain 1, and Acinetobacter baumanii (ATCC 19606:1113) were used as m-PCR control.
Table 3
The m-PCR primers sequence, target gene, target serovar detected, and the band size
Target Gene (serovar) Primer Oligonucleotide sequences (5to3) Annealing PCR Reference
name temperature product
(°C) size
(bp)
invA (Styinva-JHO-2) invA -f AAA CGT TGA AAA ACT GAG GA 62 199 (Barrow &
Neto, 2011)
invA -r TCG TCA TTC CAT TAC CTA CC
Sdf (S. Enteritidis) Sdf-f AAA TGT GTT TTA TCT GAT GCA 62 299 (O'Regan et
AGA GG al., 2008)
Sdf-r GTT CGT TCT GGT ACT TAC GAT
GAC
STM4492 (S. STM4492- ACA GCT TGG CCT ACG CGA G 62 759 (McCarthy
Typhimurium) f et al., 2009)
STM4492- AGC AAC CGT TCG GCC TGA C
r
IE-1 (S. Enteritidis) IE-1-for AGT GCC ATA CTT TTA ATG AC 58 316 (S. J. Wang
& Yeh,
IE-1-rev ACT ATG TCG ATA CGG TGG G 2002)
Flic-C (S. Typhimurium) Flic-C-for CCC GCT TAC AGG TGG ACT AC 58 432 (Paião et
al., 2013)
Flic-C-fev AGC GGG TTT TCG GTG GTT GT
S. Infantis 878–897 878for TTG CTT CAG ATG CTA AG 56 413 (Kardos,
Farkas,
Antal,
1275rev TTG CTT CAG ATG CTA AG Nogrady, &
Kiss, 2007)
S. Hadar (Salmonella HAD-For ACC GAG CCA ACG ATT ATC AA 57 502 (Ahmed et
serogroup C2) al., 2009)
HAD-rev AAT AGG CCG AAA CAA CAT CG
Cholerae-Suis Flin C Flin C-F AAG GAA AAG ATC ATG GCA CAA 53 956 (Chiu, Pang,
Hwang, &
Flin C-R GAA CCC ACC ATC AAT AAC TTT Tsen, 2005)
G
heli (Heidelberg) ORF heli-F ACAGCCCGCTGTTTAATGGTG 56 782 (Zhu et al.,
(predicted helicase) 2015)
heli-R CGCGTAATCGAGTAGTTGCC
gly (Kentucky) ORF gly-F TTCCAATTGAAACGAGTGCGG 56 170 (Mahmud,
(putative membrane Bari, &
protein) Hossain,
gly-R ACTAACCGCTTGGGTTGTTGCTGT
2011)
Page 6/161.5. Statistical Analysis:
The statistical analysis of data was conducted using IBM SPSS version 16.00 (SPSS Inc., Chicago, IL, USA). The chi-square
test was used to compare different methods and P < 0.05 was considered statistically significant.
2. Results
2.1. Salmonella Genus And Serogroup Detection
A total of 2300 poultry feces samples from farms located in 21 cities of Iran were collected from January 2016 to December
2019. The percentage of abundance of different Salmonella serogroups are given in Fig. 1. Among them, 173 (7.5%)
samples were detected as Salmonella by cultivation, and 166 (7.2%) samples were detected as Salmonella by amplification
of invA gene. Thus, the sensitivity of molecular detection and microbiological cultivation was equal to 0.96 (CI = 95%).
Molecular serotyping gave the same results as the antisera approach with A (prt), C1 (wzxC1), and E (wzxE1) serogroups.
The concordance of molecular detection of serogroups (Fig. 2) and the serological method for all samples were 100%. Other
samples were in different groups, and the matching results of the two molecular and serological serotypes were higher than
93% for all samples. The detection of B (rfb), C2 (wzxC2), and D (tyv) showed that the concordance of molecular serotyping
and antisera method was 93.3%, 94.9%, and 94.2%, respectively. Eighteen samples were identified by neither serological nor
molecular methods, and were named as unidentified. The D and C2 Salmonella serogroups were the most abundant. The
match between molecular serotyping and serology methods for unidentified samples was 94.4%. Also, 10.4% of the
samples were not identified.
The accuracy of detecting the flics gene by m-PCR and antigen H by the serological method significantly correlated with the
contingency table test (P < 0.01). In the Receiver-Operating Characteristic (ROC) diagram, the sensitivity and specificity of the
m-PCR were 92.3% and 95.2%, respectively, compared to the serological method (as gold standard). In evaluating H
antigenic subgroups (including Ha, Hb, Hc, and Hj), the same results were obtained with both m-PCR and serological
methods for a matching rate of 100%. Therefore, the relationship between methods was significant in the contingency table
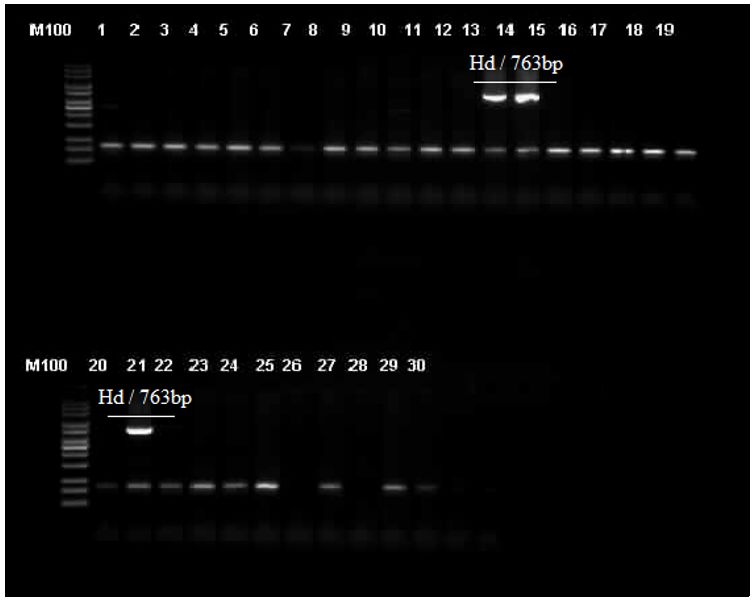
test (P < 0.01). Figure 3 shows the m-PCR product band to identify the subgroup H1 Salmonella genus (Ha, Hb, Hd, Hj).
2.2. Multiplex PCR to Serovar Typing Salmonella
Figure 4 depicts percentage of abundance of different Salmonella serovars among Salmonella samples and Fig. 5 shows
the m-PCR identifying the Salmonella serovars. The molecular serotyping of seven serovars using nine pairs of primers was
performed on samples positively identified as Salmonella. The prevalence was determined among positive samples and
confirmed by molecular and cultivation approach as S. enterica serovar Enteritidis 50 (28.9%), S. enterica serovar Infantis 22
(12.7%), S. enterica serovar Kentucky 19 (11%), S. enterica serovar Hadar 15 (8.7%), S. enterica serovar Typhimurium 13
(7.5%), S. enterica serovar Choleraesuis 12 (6.9%), S. enterica serovar Heidelberg 5 (2.9%), and another serovar 37 (21.4%).
3. Discussion
Salmonella is a life-threatening food-borne zoonotic pathogen with more than 2,500 serotypes. Over 95% of the strains
cause infections in humans and animals to belong to serogroups A to D (Diep et al., 2019). Identification of Salmonella is
necessary for the prevention, surveillance, and control of food-borne diseases. Therefore, there is a need for rapid detection,
identification of sources, control of outbreaks, and identification of emerging serotypes of Salmonella. In this study,
traditional (culture and serology) and molecular methods were used to detect Salmonella isolates from poultry farms in Iran.
Serogroups and serovars were compared to determine the best fast and valid method.
In this study, 7.5% (173/2300) of the isolates were identified as Salmonella by culturing and 7.2% (166/2300) were identified
by PCR (invA). The current study exhibited a lower prevalence of Salmonella than broiler poultry farms in Bangladesh where
Page 7/16prevalence ranged from 23–38% (35/100; 36/123; 106/503) (Alam et al., 2020). A longitudinal Salmonella surveillance
study was conducted in raw chicken meat in Mexico on 1160 samples collected between 2016–2018 (Regalado-Pineda et
al., 2020). The study revealed a significantly higher prevalence (p < 0.0001) of S. entertica in supermarkets (27.2%, 158/580)
than in wet markets (9.0%, 52/580) The prevalence of S. entertica was observed in other regions of the world and included
Venezuela, the USA, Canada, Wales, Australia, Brazil, Belgium, China, Columbia, Ecuador, Portugal, and Spain, where
infection levels ranged between 9.5–65% (Regalado-Pineda et al., 2020). The lower prevalence of Salmonella observed in
the current study could be attributed to the sample size (Persoons et al., 2011), where larger samples were compared in
previous studies. The sampling sources could be another factor (Taylor, Khush, Peletz, & Kumpel, 2018) as the previous
studies included various sampling locations and sources such as cloacal swabs, litter, chicken meat, feed. In comparison,
the current study only included fecal samples from poultry farms. Additionally, the geographical locations of the studies
could be another factor that influences the current findings (Shah, Sachdev, Coggon, & Hossain, 2011).
Target genes used in our study were previously validated in several studies using PCR and m-PCR assays to detect
Salmonella serogroup A-E (Farahani, Ehsani, Ebrahimi-Rad, & Khaledi, 2018). The present study implemented m-PCR of
878–897 gene to identify S. enterica serovar Infantis following previous studies where m-PCR was used on the same gene
to identify S. enterica serovar Infantis in spiked chicken feces and meat samples. Furthermore, the current study used
STM4492 and fliC genes to identify S. enterica serovar Typhimurium and S. enterica serovar Choleraesuis, respectively.
These findings are consistent with previous reports where STM4492 was used as a target marker gene to identify S. enterica
serovar Typhimurium and exhibited high specificity and differentiation between the Salmonella serovars (McCarthy et al.,
2009). Studies have shown that the STM4492 gene discriminated S. enterica serovar Typhimurium from S. enterica serovar
Enteritidis in broiler and chicken meat samples (Paião et al., 2013; Saeki, Alves, Bonfante, Hirooka, & de Oliveira, 2013). The
fliC gene is the other target gene for S. enterica serovar Typhimurium and S. enterica serovar Choleraesuis detection that
encodes the phase 1 flagellin protein (H1), which is the most frequently used gene to differentiate Typhimurium serovar
from the others (TELLI, 2018). Researchers at Konya (Turkey) used the fliC gene to isolate S. enterica serovar Typhimurium
from chicken meat and giblets (Telli, Biçer, Kahraman, Telli, & Doğruer, 2018). Furthermore, studies identified Salmonella spp.
from pediatric patients and S. enterica serovar Choleraesuis by targeting the FliC gene (Filsner, 2018).
The sdf gene, a chromosome region related to invasion and infection of poultry and eggs, are used for the detection of S.
enterica serovar Enteritidis in humans and animals (Del Serrone, 2019). To detect S. enterica serovar Hadar, S. enterica
serovar Kentucky, and S. enterica serovar Heidelberg, had, gly, and heli genes were used, respectively. Martínez-Ballesteros et
al. (Martínez-Ballesteros et al., 2012) detected had gene by an improved m-PCR method to detected S. enterica serovar
Hadar and typing them as S. enterica serovar Hadar. Furthermore, in another study by Ahmed et al. (Ahmed, Younis, Ishida, &
Shimamoto, 2009) in Egypt, the had gene was used to detect multidrug resistance in Salmonella spp. isolated from diarrheic
calves. The P1-P2 primer pair targeting the oriC gene was included as an internal control in all m-PCR reactions.
The present study found the highest prevalence of S. enterica serovar Enteritidis in fecal samples from poultry in Iran. The
lowest prevalence was associated with S. Heidelberg, indicating that live poultry was the source of S. enterica serovar
Enteritidis for contamination of raw chicken meat in the primary part of the chain production. The motile Salmonella spp.
are mainly associated with food products, and they are the significant causes of salmonellosis in humans (Whiley & Ross,
2015). In our study, approximately 7.5% of Salmonella isolates were confirmed as S. enterica serovar Typhimurium. Similar
results were found by Barua et al. (Barua, Biswas, Olsen, Shil, & Christensen, 2013), where 11% of commercial broiler chicken
farm isolates were motile Salmonella and Islam et al. (Islam, Mahbub-E-Elahi, Ahmed, & Hasan, 2016) in Bangladesh, where
15.91% of isolates were S. enterica serovar Typhimurium. Alam et al. (Alam et al., 2020) showed that 85.7% of the isolates
from Bangladesh were confirmed as motile Salmonella, which is higher than our results. In another study conducted from
154 commercial poultry layer farms in the Southern part of India, a total of 1215 samples containing poultry meat, tissues,
egg, and environmental samples were screened for non-typhoidal Salmonella (NTS) serovars. Multiplex-PCR, allele-specific
PCR, enterobacterial repetitive intergenic consensus (ERIC) PCR, and pulse field gel electrophoresis (PFGE) revealed 21/1215
(1.73 %) samples positive for NTS (Saravanan et al., 2015). Similarly, during disease outbreaks (40–80% mortality) in
Page 8/16poultry farms in Lagos, Ogun and Oyo states, Nigeria, PCR and serotyping conducted on chicken organ samples collected at
postmortem examinations identified motile Salmonella serotypes primarily represented by S. enterica serovar Zega
(34.14%), S. enterica serovar Kentucky (24.32%), S. enterica serovar Herston (16.22%), S. enterica serovar Nima (10.81%), S.
enterica serovar Colindale (2.70%), S. enterica serovar Telelkebir (8.11%) and S. enterica serovar Tshiongwe (2.70%)
(Mshelbwala et al., 2017).
Bacterial culture-based techniques are time-consuming, laborious, and have a lower discriminatory capacity.
Simultaneously, molecular methods such as m-PCR are crucial in detecting, typing, speciating, and classifying Salmonella
at the genus level, serogroups, and serovars. The m-PCR assay is a sensitive, reliable, specific, and highly effective
diagnostic test for the simultaneous identification of Salmonella and its serogroups and serovars. However, the cultivation-
based PCR-dependent technique has certain limitations, such as the less abundant microbes could not be grown easily, and
uncultivable microorganisms are not retrieved, resulting in the wrong interpretation of the result. Conversely, the cultivation-
independent PCR-dependent technique is more reliable as it involves the PCR of the metagenome directly retrieved from the
environment, devoid of any prior cultivation (Ghosh, 2015). This system could significantly reduce reliance on the tedious
conventional serotyping. However, the main issues to be considered are the cost scale-up of these advanced methods and
the regulatory necessities. Although the present results are preliminary, the m-PCR assay could offer a valuable alternative to
traditional typing methods (culture and serological) to identify and differentiate the most Salmonella spp. in diverse
samples. Further investigations should embark on the whole genome sequencing, functional genomics, extraction, and
purification of the bioactive compounds from these isolate, which could contribute to understanding the mechanism of
infections.
Declarations
Acknowledgment
Thanks to the Pasteur Institute of Iran, we had a chance to do this study.
Ethical Approval: Not applicable
Consent to Participate: All authors consented to participate
Consent to Publish: All authors consented to publish the manuscript.
Author contributions:
RKF and AHKF were designed the study. RKF, AGL, and MM performed the laboratory procedures and experiments. Safoora.
G analyzed the data. MM wrote the manuscript. SG and AHKF edited the manuscript. All authors read the latest version of
the manuscript and confirmed that.
Funding: Not applicable
Competing Interests: There were not any competing interests.
Availability of data and materials: Not applicable
Code availability: Not applicable
References
1. Ahmed AM, Younis EE, Ishida Y, Shimamoto T (2009) Genetic basis of multidrug resistance in Salmonella enterica
serovars Enteritidis and Typhimurium isolated from diarrheic calves in Egypt. Acta Trop 111(2):144–149
Page 9/162. Alam SB, Mahmud M, Akter R, Hasan M, Sobur A, Nazir K,.. . Rahman M (2020) Molecular Detection of Multidrug
Resistant Salmonella Species Isolated from Broiler Farm in Bangladesh. Pathogens 9(3):201
3. Barrow P, Neto OF (2011) Pullorum disease and fowl typhoid—new thoughts on old diseases: a review. Avian Pathol
40(1):1–13
4. Barua H, Biswas PK, Olsen KE, Shil SK, Christensen JP (2013) Molecular characterization of motile serovars of
Salmonella enterica from breeder and commercial broiler poultry farms in Bangladesh. PloS one, 8(3)
5. Chiu T-H, Pang J-C, Hwang W-Z, Tsen H-Y (2005) Development of PCR primers for the detection of Salmonella enterica
serovar Choleraesuis based on the fliC gene. J Food Prot 68(8):1575–1580
6. Del Serrone P (2019) Cocoa vs Pathogenic Bacteria of Human and Animal Concern. EC Microbiology 15:50–60
7. Diep B, Barretto C, Portmann AC, Fournier C, Karczmarek A, Voets G,.. . Klijn A (2019) Salmonella Serotyping;
Comparison of the Traditional Method to a Microarray-Based Method and an in silico Platform Using Whole Genome
Sequencing Data. Front Microbiol 10:2554. doi:10.3389/fmicb.2019.02554
8. Du J, Wu S, Niu L, Li J, Zhao D, Bai Y (2020) A gold nanoparticles-assisted multiplex PCR assay for simultaneous
detection of Salmonella typhimurium, Listeria monocytogenes and Escherichia coli O157: H7. Anal Methods
12(2):212–217
9. Farahani RK, Ehsani P, Ebrahimi-Rad M, Khaledi A (2018) Molecular detection, virulence genes, biofilm formation, and
antibiotic resistance of Salmonella enterica serotype enteritidis isolated from poultry and clinical samples. Jundishapur
Journal of Microbiology, 11(10)
10. Filsner PHNdL (2018) Caracterização de Salmonella enterica subespécie enterica sorovar Cholerasuis provenientes de
suínos no Brasil. Universidade de São Paulo
11. Gantois I, Eeckhaut V, Pasmans F, Haesebrouck F, Ducatelle R, Van Immerseel F (2008) A comparative study on the
pathogenesis of egg contamination by different serotypes of Salmonella. Avian Pathol 37(4):399–406.
doi:10.1080/03079450802216611
12. Ghazalibina M, Farahani RK, Mansouri S, Meskini M, Farahani AHK, Khaledi A (2019) Molecular detection of antibiotic
resistance genes, and class I, and II integrons in Salmonella Enteritidis isolated from Iranian one-day-old chicks. Gene
Reports 16:100441
13. Ghosh S (2015) Metagenomic Screening of cell wall hydrolases, their anti-fungal activities and potential role in wine
fermentation. PhD thesis, Stellenbosch University, South Africa
14. Gu G, Strawn LK, Zheng J, Reed EA, Rideout SL (2019) Diversity and dynamics of Salmonella enterica in water sources,
poultry litters, and field soils amended with poultry litter in a major agricultural area of Virginia. Front Microbiol 10:2868
15. Herrera-León S, Ramiro R, Arroyo M, Díez R, Usera MA, Echeita MA (2007) Blind comparison of traditional serotyping
with three multiplex PCRs for the identification of Salmonella serotypes. Research in microbiology 158(2):122–127
16. Hirose K, Itoh K-I, Nakajima H, Kurazono T, Yamaguchi M, Moriya K,.. . Watanabe H (2002) Selective amplification of tyv
(rfbE), prt (rfbS), viaB, and fliC genes by multiplex PCR for identification of Salmonella enterica serovars Typhi and
Paratyphi A. J Clin Microbiol 40(2):633–636
17. Hoorfar J, Ahrens P, Rådström P (2000) Automated 5′ nuclease PCR assay for identification of Salmonella enterica. J
Clin Microbiol 38(9):3429–3435
18. Islam MJ, Mahbub-E-Elahi A, Ahmed T, Hasan MK (2016) Isolation and identification of Salmonella spp. from broiler
and their antibiogram study in Sylhet, Bangladesh. Journal of Applied Biology Biotechnology Vol 4(03):046–051
19. Kardos G, Farkas T, Antal M, Nogrady N, Kiss I (2007) Novel PCR assay for identification of Salmonella enterica serovar
Infantis. Lett Appl Microbiol 45(4):421–425
20. Kariuki S, Gordon MA, Feasey N, Parry CM (2015) Antimicrobial resistance and management of invasive Salmonella
disease. Vaccine 33:C21–C29
Page 10/1621. Kasturi KN (2020) A real-time PCR for rapid identification of Salmonella enterica Gaminara serovar. J Microbiol
Methods 169:105729
22. Khaledi A, Meskini M (2020) A systematic review of the effects of Satureja khuzestanica Jamzad and Zataria multiflora
Boiss against Pseudomonas aeruginosa. Iranian journal of medical sciences 45(2):83
23. Levy H, Diallo S, Tennant SM, Livio S, Sow SO, Tapia M,.. . Kotloff KL (2008) PCR method to identify Salmonella
enterica serovars Typhi, Paratyphi A, and Paratyphi B among Salmonella isolates from the blood of patients with
clinical enteric fever. J Clin Microbiol 46(5):1861–1866
24. Lim Y-H, Hirose K, Izumiya H, Arakawa E, Takahashi H, Terajima J,.. . Watanabe H (2003) Multiplex polymerase chain
reaction assay for selective detection of Salmonella enterica serovar Typhimurium. Jpn J Infect Dis 56(4):151–155
25. Maciorowski K, Pillai S, Jones F, Ricke S (2005) Polymerase chain reaction detection of foodborne Salmonella spp. in
animal feeds. Crit Rev Microbiol 31(1):45–53
26. Mahmud MS, Bari ML, Hossain MA (2011) Prevalence of Salmonella serovars and antimicrobial resistance profiles in
poultry of Savar area, Bangladesh. Foodborne Pathog Dis 8(10):1111–1118
27. Malorny B, Huehn S, Dieckmann R, Krämer N, Helmuth R (2009) Polymerase chain reaction for the rapid detection and
serovar identification of Salmonella in food and feeding stuff. Food Anal Methods 2(2):81–95
28. Martínez-Ballesteros I, Paglietti B, Rementeria A, Laorden L, Garcia-Ricobaraza M, Bikandi J,.. . Garaizar J (2012) Intra-
and inter-laboratory evaluation of an improved multiplex-PCR method for detection and typing of Salmonella. The
Journal of Infection in Developing Countries 6(05):443–451
29. McCarthy N, Reen FJ, Buckley JF, Frye JG, Boyd EF, Gilroy D (2009) Sensitive and rapid molecular detection assays for
Salmonella enterica serovars Typhimurium and Heidelberg. J Food Prot 72(11):2350–2357
30. Meskini M, Esmaeili D (2018) The study of formulated Zoush ointment against wound infection and gene expression of
virulence factors Pseudomonas aeruginosa. BMC Complement Altern Med 18(1):1–10
31. Meskini M, Ghorbani M, Bahadoran H, Esmaeili D (2020) ZOUSH ointment with the properties of antibacterial moreover,
burn wound healing. Int J Pept Res Ther 26(1):349–355
32. Mshelbwala FM, Ibrahim ND, Saidu SN, Azeez AA, Akinduti PA, Kwanashie CN,.. . Luka PD (2017) Motile Salmonella
serotypes causing high mortality in poultry farms in three South-Western States of Nigeria. Vet Rec Open 4(1):e000247.
doi:10.1136/vetreco-2017-000247
33. O'Regan E, McCabe E, Burgess C, McGuinness S, Barry T, Duffy G,.. . Fanning S (2008) Development of a real-time
multiplex PCR assay for the detection of multiple Salmonella serotypes in chicken samples. BMC microbiology 8(1):156
34. Paião F, Arisitides L, Murate L, Vilas-Bôas G, Vilas-Boas L, Shimokomaki M (2013) Detection of Salmonella spp,
Salmonella Enteritidis and Typhimurium in naturally infected broiler chickens by a multiplex PCR-based assay. Brazilian
Journal of Microbiology 44(1):37–42
35. Persoons D, Bollaerts K, Smet A, Herman L, Heyndrickx M, Martel A.. . Dewulf J (2011) The Importance of Sample Size
in the Determination of a Flock-Level Antimicrobial Resistance Profile for Escherichia coli in Broilers. Microbial Drug
Resistance 17(4):513–519. doi:10.1089/mdr.2011.0048
36. Regalado-Pineda ID, Rodarte-Medina R, Resendiz-Nava CN, Saenz-Garcia CE, Castaneda-Serrano P, Nava GM (2020)
Three-Year Longitudinal Study: Prevalence of Salmonella Enterica in Chicken Meat is Higher in Supermarkets than Wet
Markets from Mexico. Foods, 9(3). doi: ARTN 264
37. 3390/foods9030264
38. Saeki EK, Alves J, Bonfante RC, Hirooka EY, de Oliveira TCRM (2013) Multiplex PCR (mPCR) for the Detection of S
almonella spp. and the Differentiation of the T yphimurium and E nteritidis Serovars in Chicken Meat. J Food Saf
33(1):25–29
39. Saravanan S, Purushothaman V, Murthy TRGK, Sukumar K, Srinivasan P, Gowthaman V,.. . Kuchipudi SV (2015)
Molecular Epidemiology of Nontyphoidal Salmonella in Poultry and Poultry Products in India: Implications for Human
Page 11/16Health. Indian Journal of Microbiology 55(3):319–326. doi:10.1007/s12088-015-0530-z
40. Shah A, Sachdev A, Coggon D, Hossain P (2011) Geographic variations in microbial keratitis: an analysis of the peer-
reviewed literature. Br J Ophthalmol 95(6):762–767. doi:10.1136/bjo.2009.169607
41. Sobur MA, Sabuj AAM, Sarker R, Rahman AT, Kabir SL, Rahman MT (2019) Antibiotic-resistant Escherichia coli and
Salmonella spp. associated with dairy cattle and farm environment having public health significance. Veterinary world
12(7):984
42. Taylor DDJ, Khush R, Peletz R, Kumpel E (2018) Efficacy of microbial sampling recommendations and practices in sub-
Saharan Africa. Water Res 134:115–125. doi:10.1016/j.watres.2018.01.054
43. TELLI A (2018) Determination of microbial contamination, pH and temperature changes in sheep and cattle carcasses
during the slaughter and pre-cooling processes in Konya, Turkey. Italian Journal of Food Science, 30(4)
44. Telli A, Biçer Y, Kahraman HA, Telli N, Doğruer Y (2018) Presence and antibiotic resistance of Salmonella spp. isolated
from chicken meat and giblets consumed in Konya, Turkey. Eurasian J Vet Sci 34:164–170
45. Wang J, Li J, Liu F, Cheng Y, Su J (2020) Characterization of Salmonella enterica Isolates from Diseased Poultry in
Northern China between 2014 and 2018. Pathogens 9(2):95
46. Wang SJ, Yeh DB (2002) Designing of polymerase chain reaction primers for the detection of Salmonella enteritidis in
foods and faecal samples. Lett Appl Microbiol 34(6):422–427
47. Whiley H, Ross K (2015) Salmonella and eggs: from production to plate. Int J Environ Res Public Health 12(3):2543–
2556
48. Widjojoatmodjo M, Fluit A, Torensma R, Keller B, Verhoef J (1991) Evaluation of the Magnetic Immuno PCR assay for
rapid detection ofSalmonella. Eur J Clin Microbiol Infect Dis 10(11):935–938
49. Zhu C, Yue M, Rankin S, Weill F-X, Frey J, Schifferli DM (2015) One-step identification of five prominent chicken
Salmonella serovars and biotypes. J Clin Microbiol 53(12):3881–3883
Tables
Due to technical limitations, Table 2 is only available as a download in the Supplemental Files section.
Figures
Page 12/16Figure 1
Percentage of abundance of different Salmonella serogroups among Salmonella samples. The D, C2, and C1 serogroups
were the three most abundant serogroup, and "A" serogroup was the least abundant serogroup among Salmonella samples.
The "U" showed unidentified samples.
Figure 2
Page 13/16m-PCR to identify Salmonella serogroups. Lane 1, 2, and 3: C2, lane 4, 5, and 6: A, lane 7, 8, and 9: E1, lane 10 and 15: C1,
lane 11, 12, 13, and 14: D, lane 16 and 17: B, and lane 18 and 19: negative control. Lane M100: Ladder 100bp (Invitrogen,
USA).
Figure 3
m-PCR to identify subgroup H1 Salmonella genus (Ha, Hb, Hd, Hj). M100: ladder 100bp (Invitrogen), Lane 14, 15, 21:
subgroup H1 Salmonella genus (Hd / 763bp).
Page 14/16Figure 4
Percentage of abundance of different Salmonella serovars among Salmonella samples. The highest serotypes of S.
Enteritidis, S. Infantis, and S. Kentucky were the three most commonly identified.
Figure 5
m-PCR to identify Salmonella serovars. Lane 1 and 2: S. Infantis, lane 3, 4, and 5: Salmonella (invA: 199 bp), S.
Typhimurium (STM: 759 bp), S. Enteritidis (sdf: 299 bp), lane 6, 11, and 12: negative control, lane 10: S. Choleraesuis (with
Page 15/16FlinC: 956 bp), lane 13 and 14: S. Choleraesuis (with viaB 600 bp), lane 15 and 16: S. Hadar (had: 502 bp), lane 17: S.
Heidelberg (hli:782bp), and lane 18: S. Kentucky (gly:170bp). Lane M100: Ladder 100bp (Invitrogen, USA).
Supplementary Files
This is a list of supplementary files associated with this preprint. Click to download.
Table2.docx
Page 16/16You can also read