EXPLORATORY ANALYSIS OF THE ACCURACY OF BIOSENSOR IN WEARABLE DEVICE
←
→
Page content transcription
If your browser does not render page correctly, please read the page content below
University of Rhode Island
DigitalCommons@URI

Open Access Master's Theses

2018

EXPLORATORY ANALYSIS OF THE ACCURACY OF BIOSENSOR IN
WEARABLE DEVICE
Leichen Dai
University of Rhode Island, lcdai@my.uri.edu

Follow this and additional works at: https://digitalcommons.uri.edu/theses

Recommended Citation
Dai, Leichen, "EXPLORATORY ANALYSIS OF THE ACCURACY OF BIOSENSOR IN WEARABLE DEVICE"
(2018). Open Access Master's Theses. Paper 1402.
https://digitalcommons.uri.edu/theses/1402

This Thesis is brought to you for free and open access by DigitalCommons@URI. It has been accepted for inclusion
in Open Access Master's Theses by an authorized administrator of DigitalCommons@URI. For more information,
please contact digitalcommons@etal.uri.edu.
EXPLORATORY ANALYSIS OF THE ACCURACY OF

         BIOSENSOR IN WEARABLE DEVICE

                      BY

                  LEICHEN DAI

A THESIS SUBMITTED IN PARTIAL FULFILLMENT OF THE

        REQUIREMENTS FOR THE DEGREE OF

               MASTER OF SCIENCE

                       IN

            ELECTRICAL ENGINEERING

          UNIVERSITY OF RHODE ISLAND

                      2018
MASTER OF SCIENCE THESIS
                  OF
            LEICHEN DAI

APPROVED:

    Thesis Committee:

    Major Professor       Yan Sun

                          Bin Li

                          Lisa DiPippo

                          Nasser H. Zawia
                      DEAN OF THE GRADUATE SCHOOL

         UNIVERSITY OF RHODE ISLAND
                    2018
ABSTRACT

    The new wave of wireless technologies, fitness trackers, and body sensors have

had a great impact on personal biometric tracking and monitoring. These technologies

make a great contribution to personal health care, and can even be used in clinical

settings. Among all of these devices, smartwatches are one of the most popular, and

are becoming increasingly common among the general public. Commercially available

smartwatches incorporate sophisticated algorithms and multi-sensor technologies,

which are capable of providing users with real-time biometrics. Some of these sensors

include a photoplethysmography (PPG) sensor that detects the wearer’s heart rate,

Galvanic skin response sensors which can provide skin surface information, and an

accelerometer which can be used to provide activity and movement information.

When considering clinical applications, researchers find the smartwatch’s PPG sensor

to be of most interest, as heart rate is one of the most important vitals that are

monitored for clinical purposes. Heart rate can be used to detect and prevent serious

diseases, such as cardiovascular diseases and seizures. However, the accuracy of PPG

sensors still needs thorough investigation. Although the ability of wearable PPG

sensors to reliably measure heart rate in regular movement (i.e. walking or jogging)

has been demonstrated in previous research, there doesn’t exist premier research that

focuses on the accuracy of a PPG sensor in daily activities, such as brushing one’s

teeth, cooking, or vacuuming. These activities are of interest because they involve

short periods of high frequency vibrations or intense wrist movements, which could

affect the smartwatch’s heart rate calculation. To validate the relative accuracy of a

smartwatch’s PPG sensor in these activities, a Microsoft Band (MB) and a Huawei
Android smartwatch (HW) were used to conduct a series of experiments from which

the heart rate signals were gathered and evaluated. Six participants were recruited to

collect data from these two smartwatches, which involved completing a set of three

daily activities under a specific protocol. The participants completed these sets of

activities twice, giving us enough data to compare the collected heart rate between the

two watches. Each activity was further divided into different stages, including the Rest

Stage, Dominant Hand Active Stage (D-Active Stage), and Non Dominant Hand

Active Stage (N-Active Stage). The heart rate differences between each watch during

the same activity and the same stage of all activities were evaluated. We also

investigated how relative heart rate accuracy was affected by skin tone, and if we

could tell which hand the watch was being worn, being the user’s dominant or non

dominant hand.

    During the experiment, each subject wore a MB and a HW on the wrist of their

dominant hand. Care was taken to follow proper wear guidelines as suggested for each

device in order to collect the most reliable data possible. Each participant did a series

of timed activities including cutting vegetables, electric tooth brushing, and walking

along a given route. The participant was asked to follow timed instructions from the

experiment instructor. The heart rate measurements of the two devices were stored in

separate CSV files in their Bluetooth-connected smartphones to be processed for

further analysis. After a close examination of the experiment’s results, the vegetable

cutting activity showed the largest heart rate differences among two devices, and the

Dominant Hand Active Stage of cutting vegetables had the largest heart rate

difference. Among all three test cases, electric tooth brushing shows the smallest heart
rate difference in both the rest and active stages, which indicated that the influence of

high frequency vibration is smaller than the magnitude of movement. Statistical results

show that the user’s relative heart rate accuracy will be affected by daily activities

even when a smartwatch is being worn on their non dominant hand. However, the

influence is much smaller than if the watch is worn on the wrist of the user’s dominant

hand. Furthermore, the skin tone of the participant also shows some effect on the

relative accuracy of optical heart rate sensor as well.

    Based on the findings of these experiments, we discovered that a further

exploration of the heart rate anomaly detection algorithm is required. This algorithm

was used to identify the anomaly in the smartwatch’s heart rate measurement while the

user was completing an activity. The heart rate from the MB was compared with a

pulse oximeter in order to tune the parameters of the anomaly algorithm. Data

received from a separate test stage showed that the anomaly detection algorithm with

tuned parameters can detect most of the heart rate anomalies identified by an

examination of the heart rate signals.
ACKNOWLEDGMENTS

    I would like to thank my major professor, Dr. Yan Sun, for the opportunity to

complete this thesis. Her advice, support, and guidance helped me through the entire

research process. Not only did she provide valuable academic guidance but also was a

great mentor in my life. She told me how to balance work and family, and gave me

tremendous support during the time we worked together. All of her advice and support

has been greatly appreciated. I would also like to thank my committee members, Dr.

Bin Li and Dr. Lisa DiPippo, for providing me with advice and reviewing my

research. Lastly, I would like to thank Dr. Kunal Mankodiya for his guidance, advice,

and motivation through all of our experiments and meetings, and in helping me to

complete my research.

    Numerous other individuals also provided assistance in my research. Everyone

from the Wearable Biosensing Lab, especially Andrew Peltier, had assisted me in

setting up lab equipment and helped to collect data in every experiment. I would like

to thank Dr. Frederick Vetter, the Electrical Engineering Graduate director, for his

guidance and help in filling out all the required forms correctly, and Dr. Haibo He, the

Dean of Electrical, Computer and Biomedical Engineering Department, for his

guidance and help in completing forms as well as his guidance for machine learning

related research.

    None of this would have been possible without the continued support and

encouragement from my parents, Zhongmin Dai and Mingyan Xu and my husband,

Daxian Yun, and my sweet boys, Franklin and Benjamin. You are all the power source

that carried me through all of the ups and downs, and give me the courage to finish

                                           v
this thesis. Last and most important, I want to give my most heartfelt thanks to my

grandma Guiyin Zhang. Thank you for raising me up and gave me everything you

have without any doubt.

                                        vi
TABLE OF CONTENTS

ABSTRACT .................................................................................................................. ii

ACKNOWLEDGMENTS ........................................................................................... v

TABLE OF CONTENTS ........................................................................................... vii

LIST OF TABLES ...................................................................................................... ix

LIST OF FIGURES ..................................................................................................... x

CHAPTER 1 ................................................................................................................. 1

        INTRODUCTION ................................................................................................ 1

        OBJECTIVE AND SCOPE .................................................................................. 2

CHAPTER 2 ................................................................................................................. 4

        REVIEW OF LITERATURE ............................................................................... 4

        ANALYSIS OF LITERATURE ........................................................................... 9

CHAPTER 3 ............................................................................................................... 11

        MARTERIALS ................................................................................................... 11

        EXPERIMENT PROCEDURE AND PARTICIPANTS .................................... 12

        SMARTWATCH PROCEDURES ..................................................................... 13

        PRE-PROCESS AND STATISTICAL ANALYSIS .......................................... 14

        RESULTS AND DISCUSSION ......................................................................... 16

CHAPTER 4 ............................................................................................................... 29

        FURTHER EXPLORATION ............................................................................. 29

        EXPERIMENT DESIGN AND PROCEDURE ................................................. 29

        CUSUM ANOMALY DETECTION .................................................................. 33

                                                             vii
RESULTS AND DISCUSSION ......................................................................... 36

CHAPTER 5 ............................................................................................................... 44

        CONCLUSION AND DISCUSSION ................................................................. 44

        LIMITATIONS AND FUTURE WORK ........................................................... 47

APPENDICES ............................................................................................................ 48

BIBLIOGRAPHY ...................................................................................................... 61

                                                           viii
LIST OF TABLES
TABLE PAGE
Table 1. Literature comparison of wearable device biosensor accuracy studies……..10
Table 2. Heart rate date of Subject One of each test case. .................................... …..17
Table 3. Results of heart rate data of Subject Four in each stage ............................... 20
Table 4. Results of heart rate data of subject 3 for same stage of different activities. 22
ixLIST OF FIGURES
FIGURE PAGE
Figure 1. Procedure for cutting and tooth brushing test cases. There is no timer for
walking test case. ........................................................................................................ 13
Figure 2. Heart rate measurements of subject one in all test cases ............................. 17
Figure 3. Absolute difference of heart rate measurement of Subject one of Microsoft
Band and Huawei Android smartwatch. Both MAD and RMSE are in this figure .... 18
Figure 4. Results for heart rate of MB and HW of Subject one. Correlation between
two test devices and Bland-Altman Plots indicating mean bias scores and 95% limits
of agreement ................................................................................................................ 18
Figure 5. MAD, RMSE and T-Score of heart rate difference in different stages of each
test case ....................................................................................................................... 21
Figure 6. Results for Rest stage and D-Active stage heart rate differences of two
devices. Correlation between two stages of each test case and case average of Bland-
Altman Plots indicating mean bias scores and 95% limits of agreement ................... 21
Figure 7. Mean absolute difference and RMSE and T-Score for same stage in different
activities ...................................................................................................................... 23
Figure 8. Results for heart rate differences of two devices in Rest stage between case 1
and case 2. Correlation between two test cases of Rest stage and Bland-Altman Plots
indicating mean bias scores and 95% limits of agreement ......................................... 24
Figure 9. Results for heart rate differences of two devices in D-Active stage between
case one and case two. Correlation between two test cases of D-Active stage and
Bland-Altman Plots indicating mean bias scores and 95% limits of agreement......... 24
xFigure 10. Mean absolute difference and RMSE for Dominate hand active stage and
Non-dominate hand active stage ................................................................................. 26
Figure 11. Results for heart rate differences of two devices in D-Active and N-Active
stage of case 1. Correlation between two stages and Bland-Altman Plots indicating
mean bias scores and 95% limits of agreement .......................................................... 26
Figure 12. Results for heart rate differences of two devices in D-Active and N-Active
stage of case 2. Correlation between two stages and Bland-Altman Plots indicating
mean bias scores and 95% limits of agreement .......................................................... 27
Figure 13. Mean absolute difference and RMSE of different skin tone groups ......... 28
Figure 14. Procedure for anomaly detection experiment ............................................ 31
Figure 15. Heart of MB and Pulse Oximeter of hand tooth brushing test case .......... 32
Figure 16. Basic CUSUM algorithm, Gaussian distribution case ............................... 34
Figure 17. MB and Pulse Oximeter heart rate comparison of hand tooth brushing test
case of two participants with one has normal heart rate reading the other has anomaly
..................................................................................................................................... 36
Figure 18. MB and Pulse Oximeter heart rate comparison of water flosser test case of
two participants with one has normal heart rate reading and the other has anomaly.. 36
Figure 19, CUSUM anomaly detection results for heart rate shown in Figure17, 18.
The results show the tuned CUSUM parameters can detect anomaly without false
alarms .......................................................................................................................... 38
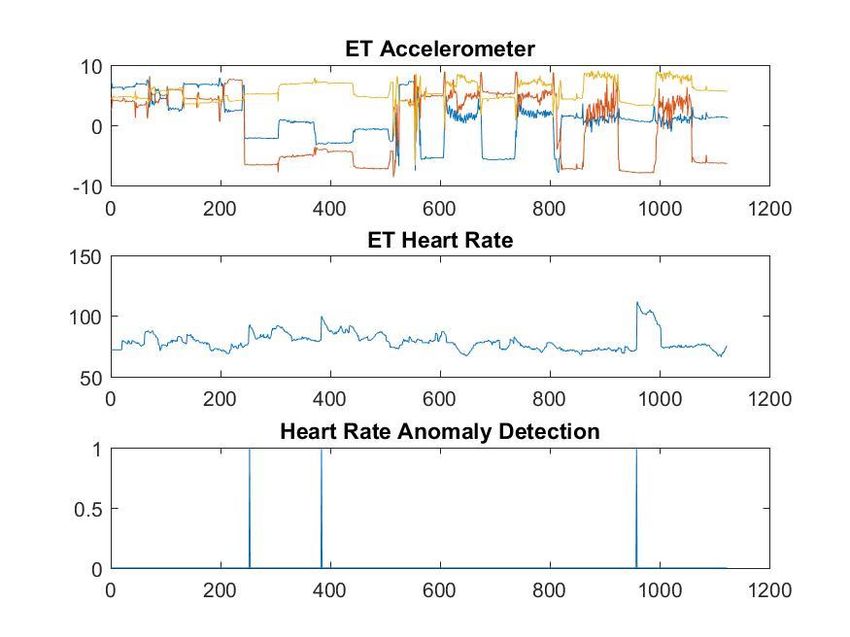
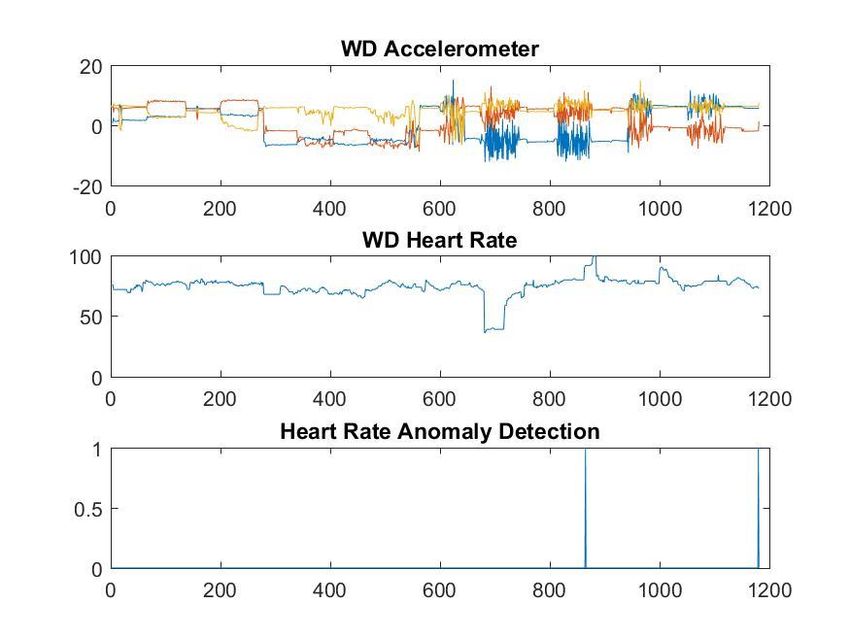
Figure 20. Heart rate anomaly detection results for an experiment with two
participants and five daily activities ............................................................................ 43
xiCHAPTER 1
INTRODUCTION
Over the past five years, wearable biosensor technologies have undergone rapid
development and have shown advancements in the sport, fitness, and health industries.
Wearable biosensors were initially developed for personal fitness and performance
monitoring, which can provide basic real-time quantitative feedback of biometrics.
The latest generation of devices, such as activity trackers, can provide immediate
feedback on multiple biometrics related to the quality of the consumers’ physical
activity, health, and exercise (Lyons, Lewis, Mayrsohn, & Rowland, 2014). With the
sensing capabilities of wearable biosensors improved, there has been an increased
interest in their application in medical settings, specifically for disease management
and preventive health behaviors monitoring. Additionally, clinicians are increasingly
interested in capturing patient-reported outcomes, including the patient’s current
status, symptoms, and adverse events such as falls and heart attacks. Furthermore, the
usefulness of wearable biosensor technologies have been studied in both outpatients
and hospitalized patients as a means of enhancing routine monitoring, or as part of an
early warning system to detect clinical deterioration (Pelizzo,G. Guddo,A. Aurora P,
Annalisa D. S, 2018).
These wearable devices have achieved tremendous success, as the market
has grown from 113.2 million shipments in 2017 to 222.3 million in 2021 with a
compound annual growth rate (CAGR) of 18.4% according to latest IDC report (IDC
2017). Because of this, the pursuit for practical and accurate approaches to assess
1personal health biometrics and physical activities continues to lay emphasis on
wearable biosensor technologies. Optical blood flow sensing using
photoplethysmography (PPG) techniques to measure heart rate proves to hold the most
importance, as heart rate is one of the most critical biometrics that both personal and
clinical consumers are interested in. PPG is a non-invasive method for the detection of
heart rate, and is connected with the optical properties of vascular tissue using a probe,
usually being LEDs. PPG sensors use LED lights to shine directly into the skin and
interact with changes in blood volume to configure a heart rate. Heart rate is
determined based on the theory that blood flow through the artery is inversely related
to the amount of light refracted (Maeda, Y., Sekine, M., & Tamura, T. 2011).
OBJECTIVE AND SCOPE
In addition to functioning as a time tracking device, smartwatches act like a mini
computer, and have numerous functions beyond showing time. A smartwatch is a
wrist-worn ‘‘general-purpose, networked computer with an array of sensors”.
Smartwatches have the potential to transform health care by supporting and evaluating
health in everyday living because they are familiar to most people, and enable near-
real time, continuous monitoring of physical activity and physiological measures
without interference of consumers. Also, smartwatches support tailored messaging and
reminders, and enable communication between patients, family members, and health
care providers. Overall, smartwatches with PPG-based heart rate detection allows for
unobtrusive and objective monitoring of physical exertion as well as systematic
exercise prescriptions. There has been a steady focus on improving overall PPG
performance, and the use of PPG technology for heart rate monitoring has shown
2acceptable validity. However the variability is large among different devices,
indicating that the accuracy of these trackers is dependent on the specific device used
and the type and intensity of the activity (Lee, J., Matsumura, K., 2013). Therefore,
PPG-based activity trackers remain under scrutiny due to the number of extrinsic
factors that may interrupt proper heart rate detection, such as ambient light, sweat,
anatomical placement, movement, and skin contact force (Parak, J., & Korhonen, I.
2014 and Teng, X. F., & Zhang, Y. T. 2004). There is a present lack of scientifically-
based validation studies on the accuracy of multi-sensor PPG activity trackers in daily
activities other than exercises such as cooking, vacuuming, use of electric appliance,
and others. The aforementioned commercial devices are no exception. Thus, future
studies to assess the validity of heart rate measurements in daily activities from
commercially available devices would be highly warranted.
In this study, a Microsoft Band and a Huawei Android smartwatch, both of which
are commercially available, were used to conduct a series of experiments focusing on
daily activities. The accuracy of the watch’s PPG based heart rate sensor was
thoroughly evaluated based on various experimental results. Furthermore, based on the
findings of two the smartwatches’ heart rate relative accuracy experiments, an
anomaly detection algorithm was developed to detect wearable sensor heart rate
disturbances in daily activities.
3CHAPTER 2
REVIEW OF LITERATURE
Evolving from simple pedometers, consumer-oriented electronic devices, such as
smartphones with the help of apps and other services, are now able to capture a variety
of parameters directly relevant to human health. With recent developments in micro-
technology, data processing and storage, wireless communication and networking
infrastructure, and battery capacity, wearable devices have made it possible for
individuals to produce ever-larger streams of data across the lifespan, throughout the
course of health and illness, and in a geospatial context (Mercer et al., 2016). (Chuah S
H, 2016) developed a theoretical model to show the adoption of smartwatch
acceptance. This research proved that the usefulness and visibility of a smartwatch are
the most important factors that drive adoption intention. Smartwatches represent a
type of fashinology, and the magnitude of the antecedents is influenced by an
individual’s perception of viewing a smartwatch as a technology or as a fashion
accessory.
(V. P. Cornet, 2018) conducted a systematic review of smartphone-based passive
sensing for health and wellbeing. There were thirty-five papers reviewed, among
which most of them used the Android operating system and an array of smartphone
sensors. The studies show that smartphone-based passive sensing for health and
wellbeing demonstrated promise, and invited continued research and investment.
Existing studies suffer from weaknesses in research design, lack of feedback and
clinical integration, and inadequate attention to privacy issues. (B. Reeder, A. David,
2016) provided another systematic review of smartwatch uses for health and wellness,
4which included seventeen studies published between 2014 and 2016. Their studies
involved participants with illnesses such as Parkinson’s disease, epilepsy, and
diabetes, all of which were given consumer-grade smartwatches that collected their
biometrics. The conclusion of this study was that consumer grade smartwatches have
penetrated the health research space rapidly since 2014. However, the smartwatches’
technical functions, acceptability, and effectiveness in supporting health must be
validated in larger field studies that enroll more participants living with the conditions
these studies target.
(Lewis K., 2017) focused on validating the heart rate data of the PPG sensor in
two devices, the Basis Peak and Fitbit Charge HR, by conducting an experiment in
which each participant had to complete a set of five minute exercises. These exercises
included low intensity cycling, high intensity cycling, walking, jogging, running, arm
raises with self-selected resistance, lunges with self-selected resistance, and planking.
The heart rate accuracy of each device was compared to a criterion device and
Pearson-Correlation. Mean absolute difference and Bland-Altman method were
applied to each comparison as well. The conclusion of this study was that both devices
perform with better accuracy during periods of rest and low physical exertion.
Additionally, there were device-specific discrepancies in performance across various
exercises. Meanwhile, another researcher (Stahl, S. E. 2016) provided a similar
experiment with more devices. In this experiment, participants had to wear six
different devices (Scosche Rhythm, Mio Alpha, Fitbit Charge HR, Basis Peak,
Microsoft Band and TomTom Runner Cardio wireless HR monitors) while walking
and running at 3.2, 4.8, 6.4, 8.0 and 9.6km/h respectively, with the heart rate data
5being compared to a criterion measurement. The results shows that all six devices
show good validity, with the criterion device and wearable device having the potential
to overcome the limitations of the traditional chest strap. (Fukushima, H., 2012)
provided a heart rate estimation by using a wrist-type photoplethysmography (PPG)
sensor while their subject was running. An algorithm that estimated heart rate from the
PPG sensor was proposed in the study. The algorithm utilized the built in
accelerometer to gain knowledge of the subject’s body motion and arm position to
improve the heart rate accuracy. Two components were used in their method. One of
which was rejecting artifacts with the power spectrum's difference between PPG and
acceleration obtained by frequency analysis. The other was the reliability of heart rate
estimation defined by the acceleration. Results had shown that the heart rate from a
PPG sensor had a higher degree of usability compared to existing methods using ECG.
Similar for all three studies, these studies failed to provide analysis of the facts that
influence the accuracy of heart rate. Also, the studies only involved exercise
movement. The analysis of daily activities was never involved in any of these works.
In addition to previous studies, (Kroll R.R., Boyd JG, 2016 and Kroll, R.R.;
McKenzie, E.D., 2017) and (Pelizzo,G., Guddo,A. Aurora P, 2018) were able to test
the accuracy of wearable devices on hospitalized patients and validate the optical
sensor in wearable devices by comparing them to hospital grade devices. Kroll R.R.
conducted a 24 hour heart rate monitoring with personal fitness trackers on 50 stable
patients in the ICU. He found that the personal fitness trackers’ derived heart rates
were slightly lower than those derived from hospital grade cECG monitoring, and that
they perform even worse in patients that are not in sinus rhythm. Pelizzo G. was able
6to collect heart rate data from a Fitbit Charge HR on 30 patients. The patients were
admitted to the Pediatric Surgery Unit for minor elective laparoscopic or open surgical
procedures, which were performed under general or local anesthesia. The heart rate
from Fitbit Charge HR was accurate, and matched with cECG and SpO2R monitoring
during pediatric surgical procedures. However, the accuracy of optical heart rate
sensor was evaluated in a stable environment, and there were no movements involved
in these experiments. Since movement is usually considered as a major factor that can
influence the accuracy of a wearable device, their studies failed to evaluate the heart
rate accuracy of patients in active motion.
Besides these studies, (Lee, J., Matsumura, K., 2013) finished a study which
evaluated the influences of different LED lights used in PPG sensors. A comparison of
the HR measured by electrocardiography (ECG) with HR measured by 530 (Green),
645 (red), and 470 nm (blue) wavelength light PPG during baseline and performing
hand waving was conducted. There were 12 participants enrolled in the experiment
and the HR measured by ECG was used as a reference. The results showed that the
limit of agreement in Bland-Altman plots between the HR measured by ECG and HR
measured by 530 nm light PPG (±0.61 bpm) was smaller than 645 and 470 nm light
PPG (±3.20 bpm and ±2.23 bpm, respectively). The ΔSNR (the difference between
baseline and task values) of 530 and 470nm light PPG was significantly smaller than
ΔSNR for red light PPG 645 (red). They conclude that 530nm light PPG could be a
more suitable method than 645 and 470nm light PPG for monitoring HR in normal
daily life.
7In order to further evaluate the abnormal values in the heart rate of the
smartwatch’s optical heart rate sensor, an anomaly detection algorithm is necessary for
any clinical usage of smartwatches. Abnormal heart rate values may be the result of
many reasons in wearable devices, such as hardware faults, corrupted sensors, energy
depletion, calibration, electromagnetic interference, signal fading, disrupted
connectivity, sweat from the wearer, a detached sensor, etc. All of these factors can
lead to a faulty diagnosis, and need to be excluded to reduce false alarms and
unnecessary intervention of healthcare professionals. (O. Salem, Y. Liu, 2013)
proposed a new framework for anomaly detection in medical wireless sensor networks
which is based on the Mahalanobis distance for spatial analysis, and a kernel density
estimator for the identification of abnormal temporal patterns.
One problem with this technique is its high dependency on the predefined
threshold of MD. An appropriate threshold is quite difficult to figure out, and a single
threshold may also not be suitable for outlier detection in multidimensional data.
According to a statement in the work, the proposed framework can update the
statistical parameters and obtain more a precise evaluation of the normal state of the
patient. According to the experiment, the proposed approach can achieve good
detection accuracy with a low false alarm rate (lower than 5.5%) on both real systems
and synthetic medical datasets. Another piece of research from (O. Salem, Y. Liu,
2014) proposed a lightweight online anomaly detection framework which uses a
smartphone as a base station. Haar wavelet decomposition, non-seasonal Holt-Winters
forecasting, and the Hampel filter for spatial analysis were deployed in this
framework. The framework was tested on real physiological datasets and proved that
8both efficiency and reliability were improved by this framework. (S. H. Liou, Y. H.
Wu, Y. S. Syu, 2012) introduced an anomaly detection algorithm which took the
advantage of the regularity of ECG to detect ECG anomaly. The proposed method
could explore the intrinsic signal structure and represent the ECG segments on a low
dimensional space. The normal ECG segments will constitute a manifold, and the
anomaly could be detected automatically. However, this method is focused on the
regularity of ECG signals rather than the heart rate measured in a given period.
Furthermore, (M. Haescher, D. J. C. Matthies, 2015) conducted a study using a
smartwatch as a wearable device to detect anomaly activities of three different
scenarios. These scenarios are the detection of sleep apnea, the detection of epileptic
seizures, and the detection of accidents such as falling or car crashes. This study
presents how to use a smartwatch as a base device to detect abnormal activities rather
than to identify abnormal measurement of heart rate date from smartwatches.
ANALYSIS OF LITERATURE
An important observation to note is how the heart rate accuracy is evaluated
throughout the various publications. In previous research, the accuracy of an optical
heart rate sensor was validated either during designed exercises or by analyzing a
hospital patient in stable and calm conditions. There is no publication research that
examined how a wearable device’s optical sensor performs in an individual’s daily
life, and how the accuracy of heart rate calculations can be affected by daily activities.
Table 1 shows a summary of current research and their lack of data on the heart rate
accuracy of wearable devices in daily activities.
9To further investigate how wearable devices can be used in health monitoring or
early discovery of certain diseases, the performance of wearable devices in daily
activities needs to be further evaluated.
For further exploration, we also reviewed various anomaly detection algorithms
used in the biosensors of wearable devices. In this thesis, we use CUSUM to explore
the possibility of detecting the heart rate abnormalities measured in daily activities.
Table 1. Literature comparison of wearable device biosensor accuracy studies
Research focus Pros/Cons
Systematic review of wearable Only provide general information of wearable device
devices biosensor usefulness research works.
Provide research guidance for future research works
Lack of details about specific device or activities
Accuracy of heart rate sensor Only focus on specific exercise activities, fail to
of wearable device on various provide heart rate accuracy analysis on general
exercise activities (walk, jog, activities.
run, lift etc.)
Exercise activities only include small portion of
everyone’s daily activities. For some older
population, exercise is not fit the use case of
wearable devices
Accuracy of heart rate sensor Good pioneer research work on real patients
of wearable device in hospital In hospital patients are in quiet and stable state where
patient usage wearable device are designed to have good
performance
Fail to provide heart rate data of patients with
movements
Need to find: Objective of this thesis to evaluate the accuracy of
heart rate sensor of wearable device in daily activities
Accuracy of heart rate sensor
and discover various facts that can have impact on
of wearable device in daily
heart rate sensor validation
activities
Further exploration on anomaly detection of wearable
Algorithm to detect heart rate
device heart rate data
anomaly of wearable device
10CHAPTER 3
MATERIALS AND METHODS
3.1 Materials
A Microsoft Band and a Huawei Android smartwatch were used in this
experiment. One of the reasons we choose the Microsoft Band is the sheer amount of
tech that's built into it. It contains nearly every biosensor that a smartwatch could
potentially contain. A complete list of sensors in the Microsoft Band include: Optical
heart rate sensor, 3-axis accelerometer, 3-axis Gyrometer, GPS, Ambient light sensor,
UV sensor, Skin temperature sensor, Capacitive sensor and Galvanic skin response
sensor. However, not all sensors are used by the software yet, neither on the band nor
in the accompanying phone app. For the purpose of this experiment, heart rate data
from the optical heart rate sensor, movement data from the 3-axis accelerometer
sensor, and skin response data from the Galvanic skin response sensor are streamed to
a smartphone application via a Bluetooth connection. The reporting frequency of each
type of data is different, and further resampling and interpolation are needed to get
matching data for all sensors. The optical heart rate sensor uses a green LED light
which measures the amount of light refracted in the blood vessels utilizing the PPG
techniques mentioned in literature review. It’s located on the back of the clasp of the
band, and the band can be worn with the face either on the inside or on top of the
wrist. On the other hand, the Huawei Android smartwatch only has basic physical
tracking sensors, such as a 6-Axis motion sensor (Gyroscope and Accelerometer), an
11Optical Heart Rate Sensor (PPG), and a Barometer despite being advertised as a
fashionable watch. The optical heart rate sensor uses a green LED light to measure
heart rate and all data can be streamed to a smartphone application via Bluetooth
connection.
3.2 Experiment procedure and participants
This prospective experiment recruited six healthy adults between the ages of 22
and 50. Each subject was educated with the procedures first, and then underwent the
same procedure through direct verbal communication. Participants gave verbal
informed consent to three different activities which are cutting vegetables, tooth
brushing with an electric toothbrush, and walking. These activities were chosen to
represent the most common everyday activities, each with a differing amounts of
movement. Cutting vegetables is a normal daily activity, but the movement is quite
intense compare to tooth brushing and walking. For tooth brushing, we had the
subjects use an electric toothbrush because of its high frequency vibration. The
vibration involved can represent a set of daily activities that use electric appliances,
such as vacuuming or shaving with an electric razor. Walking is the most common and
moderate daily activity, and it can represent almost every activity that no intense
movement involved. An instructor timed each activity and gave corresponding
instructions to the participant throughout the whole experiment. Biosensor data was
streamed to a phone application and stored in separated files automatically once the
experiment started.
12Each participant wore both smartwatches on the wrist of their dominant hand to
get the same level of intensity of movement for each activity. Care was taken to follow
the proper user guidelines as suggested by the manufacturer for each device. This is
necessary to help make sure that the smartwatch was tight enough to steadily hold the
optical heart rate sensor onto the subject’s wrist. For the vegetable cutting and tooth
brushing activities, data was collected twice from both the dominant hand and non
dominant hand. These activities started with a one minute rest period, which is
followed by a one minute active period with the given activity performed with the
subject’s dominant hand. This is followed by a half minute rest period followed by a
one minute active period, this time with the same activity performed with the subject’s
non dominant hand. An extra half minute rest period was used to finish up the test
cases. For the walk activity, the participant was asked to rest for one minute, then walk
along a given route at a normal walking speed. Another one minute rest period was
used to finish up the walk test case.
Figure 1. Procedure for cutting and tooth brushing test cases. There is no timer for
walking test case
3.3 Smartwatch procedures
The Microsoft band and Huawei Android smartwatch were attached to the same wrist,
this being the wrist of the subject’s dominant hand in accordance to the manufacturer
13instructions. We implemented this to study the difference of the biosensor data
accuracy between the subject’s dominant hand and non dominant hand. Data
acquisition from each device was time-synced, with both being synced to the NTP
time server. Heart rate data, accelerometer data, light data and Galvanic skin response
(GSR) data were collected from the Microsoft Band using a data extraction software
program specifically customized to sync with the Microsoft Band via Bluetooth
transmission. For the Huawei Android smartwatch data acquisition, dedicated software
was also designed to transmit the data to another smartphone via Bluetooth
communication. Only heart rate data was captured, and upon completion of the testing
protocol, the exercise metrics was imported into a Microsoft Excel spreadsheet. The
mobile application settings for both devices were adjusted appropriately for each
subject. Each device was confirmed to have full battery charge and proper
functionality prior to testing.
3.4 Pre-process and metrics analysis
Time synced sensor data from each device was concurrently and continuously
acquired by two separate smartphones and their corresponding applications. The
reporting rate for each smartwatch differed from one another. For the Microsoft band,
the heart rate reporting rate is one data point per second. The 3-axis accelerometer data
was captured eight times per second, and the Galvanic skin response data was
captured five times per second. For Huawei smartwatch, the heart rate was was only
reported when the value changed. This data was stored in the smartwatch’s
corresponding smartphone, as spreadsheets and further process was required to align
the data and resample them to same reporting rate.
14To identify the heart rate difference between the active and rest stages, we
divided the data of each test case into three segments, which are rest segment,
dominant active segment, and non dominant segment. The rest segments are all the
time slot that exist between activities. The dominant active segment is the time slot
consisting of activity with the participant’s dominant hand, while the non dominant
segment is the time slot containing activity with their non dominant hand.
To evaluate the heart rate difference between two devices, four levels of metric
analysis were implemented to give quantity analysis of various metrics.
1. The Student’s T test compares the two averages and tells whether they are
different from each other. The T test also indicates how significant the differences are.
The larger the t score, the more of a difference there is between groups. Therefore, a
large t-score indicates that the groups are more different from each other, while a
small t-score indicates that the groups are similar. We explored the t-scores of the
heart rate measurements from the Microsoft Band and the Huawei Smartwatch to
examine the similarity of relative accuracy between the two optical sensors.
2. Root Mean Square Error (RMSE) is the standard deviation of
the residuals, which are measures of how far from the regression line data points are.
RMSE is a measure of how spread out these residuals are. In other words, it tells you
how concentrated the data is around the line of best fit.
3. The mean absolute differential between the heart rate of both the MB and the
HW represented the average difference score regardless of direction of the difference.
4. The Bland-Altman method was used to further assess the agreement between
the two devices for heart rate measurements and whether the difference varied in a
15systematic or ambiguous way over the rage of measurements. The Bland-Altman
calculates the mean difference between two methods of measurement (the ‘bias’), and
95% limits of agreement as the mean difference. It is expected that the 95% limits
include 95% of differences between the two measurement methods (Bland & Altman,
1986).
All four levels of analysis were implemented on the heart rate data from the three
different activity stages. They were also used on the task-specific HR data and
accelerometer data, which can be used to indicate the intensity of movement.
3.5 Results and discussion
After collecting the heart rate data from both smartwatches, data analysis was
required to truly understand the differences between the two. First, an examination of
the experiment results for each subject was conducted. This examination included the
heart rate waveforms for all three test cases and the absolute difference of heart rate
for each test case for both devices. The student’s T-Test, Mean Absolute Difference
(MAD), and Root Mean Square Root (RMSE) that were mentioned in the previous
chapter were applied to the heart rate measurement of each test case.
Among all six subjects, we picked the results of subject one as an example to
reveal the heart rate differences of the two devices in each of the three different test
cases. In Figure 2, it’s obvious that cutting vegetables had the most significant heart
rate difference during the action periods, which was 33bps at time of 90 second.
However, both the Mean Absolute Difference and RMSE of the walking test case are
larger than the other test cases, which are 11.78bps and 14.94 respectively. The T-
Score values agree with the MAD and RMSE, which is 11.98 for walking test case.
16This was only a little bit larger than the cutting test case, and more than two times
larger than brushing test case. Meanwhile, the electric tooth brushing test case has the
smallest heart rate difference with the MAD and RMSE being 3.76bps and 4.79
respectively. This matches our expectation that the electric tooth brushing study is the
one with smallest movement among these three activities.
From Figure 4, the heart rate measurement of HW is significantly higher than the
measurement of MB. The mean bias is 2.9 ± 15 bpm over the heart rate measurement
of MB.
Table 2. Heart rate date of Subject 1 of each test case.
Parameter Cutting Vegetables Electric Tooth brushing Walking
Mean Absolute Diff 9.54 3.76 11.78
Max Diff 33 14.96 26.21
RMSE 13.86 4.79 14.94
T-Score 10.6 4.86 11.98
17Figure 2. Heart rate measurements of subject one in all test cases.
18Figure 3. Absolute difference of heart rate measurement of Subject one of Microsoft
Band and Huawei Android smartwatch. Both MAD and RMSE are in this figure.
Figure 4. Results for heart rate of MB and HW of Subject one. Correlation between
two test devices and Bland-Altman Plots indicating mean bias scores and 95% limits
of agreement.
193.4.1 Heart rate difference of different stages in same activity
When examining time synced Microsoft Band and Huawei Android watch heart
rate data in different action stages during same activities, the heart rate difference of
the Action stages are larger than those of the Rest stages. Take the heart rate data of
subject four as an example. For the cutting vegetables activity, the Mean absolute
difference of the Active stage of the subject’s dominant hand is 4.94 times higher
(23.03bps VS 4.66bps) than the Rest stage, and the RMSE is 2.32 times higher
(28.36bps VS 12.21bps) than Rest stage with the T-Score of D-Active stage being 2.5
times higher (9.74 vs 3.89) than Rest stage. The non dominant hand Active stage also
shows heart rate differences when compared to the Rest stage, as the Mean absolute
difference is 1.31 times higher. However, the RMSE and T-Score of the N-Active
stage is smaller than those of the Rest stage. Meanwhile, the electric tooth brushing
test shows similar heart rate differences for both its Active stages and its Rest stage.
The Mean absolute difference is only 1.29 times higher, and RMSE is the same, with
the T-Score being 2.2 times higher. The Rest and Active stages’ heart rate differences
of the walking test is higher than the other two tests, with Mean absolute difference
being 4.69 times higher, and the RMSE being 3.15 times higher than the Rest stage.
As for the Bland-Altman plot, the Rest stage and D-Active stage of the cutting
vegetables activity is 0.91±5bps, and 20 ± 35 bps while that of N-Active stage is 2.2 ±
6 bps. The Bland-Altman mean bias values shows that the heart rate measurement of
the Rest and N-Active stages are higher than the D-Active stage. Overall, from all
three test cases, we’ve found that heart rate differences between each device in the
Active stage is larger than the Rest stage, which meets our expectation.
20Table 3. Results of heart rate data of subject 4 in each stage
Cutting Brushing Walking
MAD RMSE T-Score MAD RMSE T-Score MAD RMSE T-Score
REST 4.66 12.21 3.89 1.62 2.48 4.75 5.19 8.05 4.32
D-Active 23.03 28.36 9.74 2.1 2.48 10.45 24.34 25.4 30.1
N-Active 6.1 7.48 1.45 3 3.43 12.5
Figure 5. MAD, RMSE and T-Score of heart rate difference in different stages of each
test case.
21Figure 6. Results for Rest stage, D-Active stage and N-Active stage heart rate
differences of two devices. Correlation between two stages of each test case and case
average of Bland-Altman Plots indicating mean bias scores and 95% limits of
agreement.
223.4.2 Heart rate difference of same stage in different activities
When examining time synced Microsoft Band and Huawei Android smartwatch
heart rate data of the same stages in different activities, we calculated three metric
measurements, as mentioned in the previous chapter, and explored the results for each
subject. In this chapter, we’ll use the data from subject four as an example. The heart
rate difference of all three Rest stages in the three test cases are almost all the same.
The heart rate difference is less than 1bps for both MAD and RMSE. However, the T-
Scores showed that even though the MAD and RMSE are almost the same, the actual
signals are different from each other, as the cutting test case has a T-Score as high as
30.98, and the T-Score of the walking test case has a T-Score as low as 1.43. As for
the Bland-Altman plot, the mean bias is -3.8 ± 7 bps, which indicates that the heart
rate difference of the Rest stage in all three test cases has a very high agreement.
However, when comparing the Active stages, the heart rate differences show some
interest findings. From Figure 7 we can infer that the vegetable cutting test has the
largest heart rate differences among all three tests. The Mean absolute difference of
the tests are 58.82bps, which is 8.5 times higher than electric toothbrush test, and 4.26
times higher than walking test. This indicates that intensity and magnitude are the
main factors of optical sensor accuracy, rather than vibration frequency. Also, the T-
Score of the cutting vegetables case is much higher than the other two cases. For the
Bland-Altman plot, the agreement of heart rate differences in different active stages
are very limited. The heart rate differences in the Rest stages can be regarded as the
basic device difference between Microsoft Band and Huawei Android watch. In that
case, for the cutting vegetables test case, the heart rate differences of the active stage
23is 8 times higher than the rest stage, while the electrical tooth brushing test case is
almost same as the heart rate difference of the rest and active stages.
Table 4. Results of heart rate data of subject 3 for same stage of different activities
Rest D-Active N-Active
MAD RMSE T-Score MAD RMSE T-Score MAD RMSE T-Score
Cutting 7.26 7.75 30.98 58.82 59.13 67.81 2.9 3.58 4.29
Brushing 6.24 7.92 12.08 6.82 7.87 9.37 16.16 28.95 4.02
Walking 5.45 8.35 1.43 13.81 14.93 21.78
Figure 7. Mean absolute difference and RMSE and T-Score for same stage in different
activities
24Figure 8. Results for heart rate differences of two devices in Rest stage between case 1
and case 2. Correlation between two test cases of Rest stage and Bland-Altman Plots
indicating mean bias scores and 95% limits of agreement.
Figure 9. Results for heart rate differences of two devices in D-Active stage between
case 1 and case 2. Correlation between two test cases of D-Active stage and Bland-
Altman Plots indicating mean bias scores and 95% limits of agreement.
253.4.3 Dominate hand activity VS Non-dominate hand active
When considering the relative heart rate accuracy of these two devices, the
differences between dominant hand activities and non dominant hand activities is
another factor that draws our interest. As one can imagine, it is normal that some
people like to wear their watch on the wrist of their dominant hand, while others prefer
to wear their watch on the wrist of their non dominant hand, but will this have any
effect on the relative accuracy of optical heart rate sensors? From Figure 10, we
choose the test results from subject 2 as an example. We found that in the electric
tooth brushing test, dominant hand activity has a larger heart rate difference than non
dominant hand activities over all three measurements. MAD, RMSE and T-Scores of
the dominant hand Active stage are 2.36, 2.13 and 1.75 times higher that of the non
dominant hand Active stage. As for the vegetable cutting test, the dominant hand
activities and non dominant hand activities show similar results with the electric tooth
brushing test case on MAD and RMSE measurements, with the T-Score of the
dominant hand active stage being smaller than that of the non dominant hand active
stage. It is obvious that drastic movement will affect optical sensor accuracy, but high
frequency vibration with small magnitude has much less of an influence on the
accuracy of an optical sensor, which matches our previous findings. However, wearing
a smartwatch on one’s non dominant wrist can reduce the influence of daily activities
on its optical sensor’s accuracy. The heart rate difference of N-Active stage is still two
times higher than the heart rate difference of Rest stage.
By comparing Figure 11 and Figure 12, it’s obvious that heart rate difference
between the D-Active stage and the N-Active stage in the tooth brushing test case has
26better agreement than the pair in the vegetable cutting test case, with the mean bias
being -8 ± 14 bps in the tooth brushing test case versus -20 ± 23 bps in the cutting
vegetables test case.
Figure 10. Mean absolute difference and RMSE for Dominate hand active stage and
Non-dominate hand active stage
Figure 11. Results for heart rate differences of two devices in D-Active and N-Active
stage of case 1. Correlation between two stages and Bland-Altman Plots indicating
mean bias scores and 95% limits of agreement.
27Figure 12. Results for heart rate differences of two devices in D-Active and N-Active
stage of case 2. Correlation between two stages and Bland-Altman Plots indicating
mean bias scores and 95% limits of agreement.
3.4.4 Relative heart rate accuracy in different skin tone
One more observation of the time synced heart rate data of the Microsoft Band
and the Huawei Android smartwatch is that the relative accuracy of their heart rate is
related to the skin tone of the participants as well. We divided six participants into
three groups based on their skin tone, in which the first group (Group Blue) contains
subjects one and two, both of them being Indian. The second group (Group Orange)
has subjects three through five, all of which are Chinese. The sixth subject is
Caucasian, and in a separate group. The data of third group was not included in this
comparison since only one participant is in the group. From Figure 13, we found that
for both the vegetable cutting test and the electric tooth brushing test, Group Blue has
larger heart rate difference in both the Rest and Active stages. For the vegetable
cutting test, the heart rate difference of Group Blue is 1.6 times larger than Group
28Orange in the Rest stage, and 1.2 times larger than Group Orange in the Active stage.
In the electric tooth brushing test, the heart rate difference of Group Blue is 1.6 times
and 1.4 times larger than Group Orange on the Rest stage and the Active stage
respectively. One explanation of this skin tone observation is that the optical sensors
use the amount of refracted LED lights to determine the blood volume in a vessel. It’s
likely that the amount of an LED light absorbed by darker skin will be larger than that
absorbed by lighter skin. Thus, even with same amount of blood volume, the amount
of LED light refracted by darker skin will be much less than lighter skin. Because of
this, the heart rate measurement of darker skin may be not as accurate as lighter skin.
This chapter only provides some initial findings based on the experiments and
participants we have. For more accurate conclusions, more participants should be
recruited, and quantity analysis of skin tone should also been conducted as well.
Figure 13. Mean absolute difference and RMSE of different skin tone groups
29CHAPTER 4
FURTHER EXPLORATION
From chapter 3, it is obvious that the heart rate measurements of different
wearable devices are different from each other, and same factors have different
influences on different devices. Therefore, it is confirmed that there always exists
some sort of disturbance in heart rate data read from any wearable device. In order to
use heart rate data either in personal health monitoring or for clinical usage, it’s
extremely important to detect an anomaly of heart rate data, and mark that data as
unreliable before applying it to any application or diagnosis program.
For a further exploration of the heart rate accuracy of wearable devices, we
conducted more experiments on more daily activities and collected heart rate data
from the Microsoft Band and a pulse oximeter device. The heart rate read from the
pulse oximeter is proved to be very accurate when no activity is involved during the
measure. We use this heart rate data as a criterion, and the heart rate data read from the
Microsoft Band as test data to detect heart rate anomaly. A CUSUM algorithm was
used in this exploration to detect heart rate anomaly. The parameters of CUSUM
algorithm were tuned based on the heart rate pairs from both the Microsoft Band and
the pulse oximeter, and more tests on heart rate of daily activities were performed to
get the accuracy of the CUSUM algorithm.
304.1 Experiment design and procedure
For this experiment, two health participants were recruited, and each participant
was informed of the procedures first. They then underwent the same procedures
through direct verbal communication. Participants gave verbal informed consent to
five different activities, which were hand tooth brushing, electric tooth brushing,
chopping, vacuuming, and washing dishes. Just like the previous experiment, these
activities were picked to represent common everyday activities with different activity
characteristics. An instructor timed each activity, and gave corresponding instructions
to the participant throughout the whole experiment. Biosensor data from the Microsoft
Band was streamed to a phone application, and stored in separated files automatically
once the experiment started.
Each participant wore the Microsoft Band on the wrist of their dominant hand,
and a pulse oximeter was clipped to one of participant’s toes. The pulse oximeter was
kept stable, ensuring that there the pulse oximeter was not moved during all activities
in order to get the most accurate heart rate readings as possible. Each activity was
performed the same way for both the subject’s dominant hand and their non dominant
hand, just like the previous experiment. Starting with their dominant hand, the subject
began the experiment by resting for 30 seconds. The resting period was followed by a
one minute period of performing the specified activity. This cycle was repeated two
more times, and ended with a final resting period, where they again rested for 30
seconds. The same procedure was performed by the subjects non dominant hand,
totaling 9 minutes for the entire procedure for both hands. The whole procedure is
figured in Figure 14 and the data from all of the sensors was streamed to separate
31You can also read