Fuel efficiency and safety in Coca-Cola FEMSA last-mile logistics
←
→
Page content transcription
If your browser does not render page correctly, please read the page content below
Fuel efficiency and safety in Coca-Cola FEMSA last-mile logistics
                                                  by
                                       Arturo Torres Arpi Acero
                              Industrial and Systems Engineer, ITESM CSF
                                                 and
                                         Fernando González Gil
                              Industrial and Systems Engineer, ITESM CSF

                   SUBMITTED TO THE PROGRAM IN SUPPLY CHAIN MANAGEMENT
                IN PARTIAL FULFILLMENT OF THE REQUIREMENTS FOR THE DEGREE OF
                    MASTER OF APPLIED SCIENCE IN SUPPLY CHAIN MANAGEMENT
                                            AT THE
                          MASSACHUSETTS INSTITUTE OF TECHNOLOGY

                                              June 2021
            © 2021 Arturo Torres Arpi Acero and Fernando González Gil. All rights reserved.
The authors hereby grant to MIT permission to reproduce and to distribute publicly paper and electronic
 copies of this capstone document in whole or in part in any medium now known or hereafter created.

Signature of Author: ____________________________________________________________________
                                                       Department of Supply Chain Management
                                                                                  May 14, 2021

Signature of Author: ____________________________________________________________________
                                                       Department of Supply Chain Management
                                                                                  May 14, 2021
 Certified by: __________________________________________________________________________
                                                                  Dr. María Jesús Saenz Gil de Gómez
                                     Executive Director, Supply Chain Management Blended Program
                                                                                    Capstone Advisor
Accepted by: __________________________________________________________________________
                                                                                 Prof. Yossi Sheffi
                                                Director, Center for Transportation and Logistics
                                                 Elisha Gray II Professor of Engineering Systems
                                                 Professor, Civil and Environmental Engineering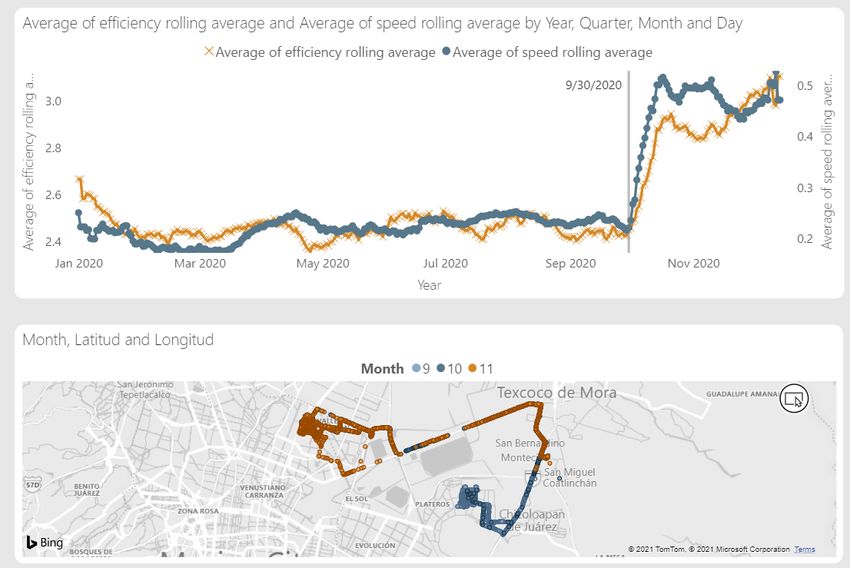
Fuel efficiency and safety in Coca-Cola FEMSA last-mile logistics

                                                     by

                                          Arturo Torres Arpi Acero

                                                     and

                                           Fernando González Gil

                       Submitted to the Program in Supply Chain Management
                             on May 14, 2021 in Partial Fulfillment of the
        Requirements for the Degree of Master of Applied Science in Supply Chain Management

                                                 ABSTRACT

Across industries and supply chains, the safety of drivers and efficient use of fuel by truck fleets are an
increasing concern. This project focused on understanding driving styles, understanding the tradeoffs
between safe and efficient driving styles, and finding the highest levels of safety and fuel efficiency. We
worked with Coca-Cola FEMSA to analyze one year of telematics data from over 3,000 vehicles. To analyze
the data, we employed a methodology that involved multiple machine learning and analytical techniques,
including multiple regressions, a random forest classification algorithm, Bayesian Gaussian Mixture Model
for clustering, what-if simulations, and the use of interactive data visualization tools. These techniques
were used first to understand the main fuel efficiency drivers, then to understand the drivers of safety,
and finally to understand the trade-offs between fuel efficiency and safety with respect to different driving
styles. Our results show that significant gains can be achieved in terms of fuel efficiency by changing
driving behaviors. Results from the regression and simulator show that average speed, acceleration events
and maximum RPM are the 3 most important variables for fuel efficiency. With small changes like
increasing speed by 1km/h, reduce acceleration events in 5% and reduces maximum RPM by 5% fuel
efficiency can be increased by 6%. We also demonstrate the main factors defining safety and their relative
importance. Finally, we cluster driving styles and suggest good practices to replicate the best driving styles
between different driving style clusters. Through a change management framework, we propose how
some drivers could improve Coca-Cola FEMSA’s safety proxy by 34% without sacrificing fuel efficiency.

Capstone Advisor: Dr. María Jesús Saenz Gil de Gómez
Title: Executive Director, Supply Chain Management Blended Program

                                           ACKNOWLEDGMENTS

                                                      2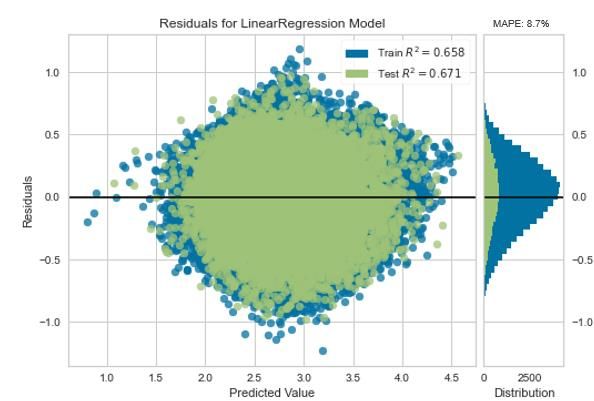
We would like to thank our advisor, Dr. Maria Jesus Saenz, for providing guidance and support throughout

this project. Next, we want to thank Pamela Siska for reviewing our reports and providing detailed

feedback on areas for improvement. Lastly, we both would like to thank our families and partners, for

always being supportive throughout our master’s program.

                                                   3
TABLE OF CONTENTS
LIST OF FIGURES ............................................................................................................................................................5
LIST OF TABLES ..............................................................................................................................................................6
1       INTRODUCTION .....................................................................................................................................................7
2       LITERATURE REVIEW .............................................................................................................................................9
    2.1         Safety .........................................................................................................................................................10
    2.2         Fuel Efficiency and Costs ............................................................................................................................14
    2.3         Fuel Efficiency and Sustainability ...............................................................................................................16
    2.4         Conclusions ................................................................................................................................................18
3       METHODOLOGY ..................................................................................................................................................20
    3.1         Business understanding .............................................................................................................................21
    3.2         Data understanding....................................................................................................................................22
    3.3         Data preparation ........................................................................................................................................23
    3.4         Modeling ....................................................................................................................................................24
        3.4.1           Fuel Efficiency ....................................................................................................................................24
        3.4.2           Safety .................................................................................................................................................26
        3.4.3           Cluster Analysis..................................................................................................................................28
        3.4.4           Individual Cluster Analysis .................................................................................................................29
    3.5         Conclusions ................................................................................................................................................30
4       RESULTS ..............................................................................................................................................................30
    4.1         Fuel Efficiency ............................................................................................................................................30
        4.1.1           Regression Model ..............................................................................................................................30
        4.1.2           Fuel Efficiency Scenario Analysis .......................................................................................................34
        4.1.3           Anomaly Detection ............................................................................................................................36
    4.2         Safety .........................................................................................................................................................37
    4.3         Fuel Efficiency and Safety ..........................................................................................................................39
5       DISCUSSION ........................................................................................................................................................43
    5.1         Fuel Efficiency ............................................................................................................................................43
    5.2         Safety .........................................................................................................................................................44
    5.3         Fuel Efficiency and Safety ..........................................................................................................................44
6       INSIGHTS AND MANAGEMENT RECOMMENDATIONS........................................................................................46
    6.1         Fuel Efficiency ............................................................................................................................................46
    6.2         Fuel Efficiency and Safety ..........................................................................................................................47
7       FUTURE RESEARCH..............................................................................................................................................50
    7.1         Fuel Efficiency ............................................................................................................................................50
    7.2         Safety and Fuel Efficiency ..........................................................................................................................51
8       CONCLUSION.......................................................................................................................................................52
REFERENCES.................................................................................................................................................................53

                                                                                       4
LIST OF FIGURES
Figure 1: Characteristic turn maneuver and lane change patterns ............................................................ 11
Figure 2: Forces Influencing Driver Safety (Douglas and Swartz, 2016) ..................................................... 13
Figure 3: Factors Influencing Fuel Efficiency .............................................................................................. 14
Figure 4: Factors Influencing Sustainable Supply Chains ............................................................................ 18
Figure 5: Driving Styles Independent Variables and Dependent Variables ................................................ 19
Figure 6: Methodology ............................................................................................................................... 20
Figure 7: Cross Industry Standard Process for Data Mining CRISP-DM (Shearer, 2000) ............................ 21
Figure 8: Histogram of Fuel Efficiency ........................................................................................................ 31
Figure 9: Pareto Chart of the Standardized Effects .................................................................................... 31
Figure 10: Residuals for Linear Regression Model...................................................................................... 32
Figure 11: Prediction Error for Linear Regression....................................................................................... 32
Figure 12: Telematics Parameters Correlation Matrix ............................................................................... 33
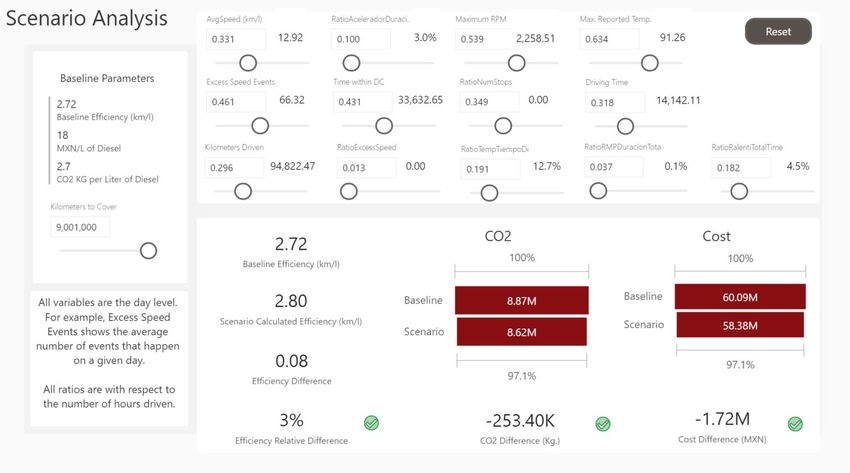
Figure 13: Scenario Analysis ....................................................................................................................... 35
Figure 14: Anomaly Detection Example ..................................................................................................... 36
Figure 15: Distribution of Safety Score Classes .......................................................................................... 37
Figure 16: ROC Analysis for Safety Classification for Random Forest......................................................... 38
Figure 17: Relative Feature Importance ..................................................................................................... 39
Figure 18: Driving Style Clusters’ Mean Safety Score and Fuel Efficiency .................................................. 40
Figure 19: Condensed View of Driving Styles ............................................................................................. 41
5LIST OF TABLES
Table 1: Classification Model Comparison.................................................................................................. 38
Table 2: Features used for Cluster Analysis ................................................................................................ 29
Table 3: Fuel Efficiency Linear Regression Results ..................................................................................... 34
Table 4: Change Motivator Nudges for Driving Styles ................................................................................ 48
61 INTRODUCTION
Across industries and supply chains, the safety of drivers and efficient use of fuel of truck fleets is an
increasing concern. This project focused on the research of driving styles that promote the highest levels
of safety and fuel efficiency, as well as the tradeoffs that can happen between the two. The hypothesis
of the project was that statistically significant different driving styles could be uncovered that showed the
most fuel efficient and safest driving styles and that we would also find inherent trade-offs between safety
and fuel efficiency.
This introduction discusses six main points: the impact of fuel efficiency in terms of cost and carbon
dioxide emissions, how driving style is related to fuel efficiency and safety, how telematics data can be
used to track driving styles, how analytics can be used to analyze this problem and the data that we will
be using for this project.
Across industries and supply chains, fuel consumption presents a two-fold problem, as it is an issue that
directly affects both companies’ profits and the environment. Proof of this comes from a study carried
out by Chainalytics (2020) in which they estimated that, on average, transportation costs make up to 50
to 60% of all supply chain operating costs. A similar study, done in Mexico, found that fuel contributes
approximately 38.5% of the total direct costs of road transportation in Mexico (Moreno, 2014). Besides,
transportation was responsible in 2010 for approximately 23% of worldwide energy-related CO2 emissions
(IPCC, 2014). Therefore, finding ways to reduce fuel consumption across industries is a great win-win
solution to both reducing climate impact and helping companies´ bottom lines.
One of the main factors affecting fuel efficiency is driving style. The difference in fuel consumption
between the most and least efficient drivers can be as high as 35%, according to a report by the American
Trucking Association’s Technology and Maintenance Council (Hooper & Murray, 2018). Driving style is also
crucial to ensure the safety of the drivers and their communities; the German Federal Statistical Office
7(2010) presented in their accidents report that 69% of the accidents in Germany happen because of
drivers’ mistakes. Also, according to the Dutch Eco-Drive initiative (www.ecodrive.org, 2001), a safer
driving style is more efficient and reduces pollution. Fleet driving companies are dealing with a big gap in
driving styles, hurting them in safety, environmental impact, and cost.
There are many ways to monitor driving styles. One of them is through vehicle telematics and the way
that it works is that each vehicle contains multiple sensors that gather data on various metrics and events
like CO2 emissions, fuel consumption, RPM, tire pressure, speed, etc. The data provided by vehicle
telematics is extremely valuable, McKinsey (Gao, Kaas, Wee, 2018) claims in its report automotive
revolution perspective towards 2030 that recurring revenue from data-driven and on-demand mobility
services could increase by $1.5 trillion in 2030. This is 30% of the overall automotive revenue pools.
Important developments in telematics are coming in the next few years. However, there is still a huge
challenge with vehicle telematics: each vehicle can generate extensive data streams, which cannot be
analyzed with traditional methods and/or spreadsheets.
Telematics providers already have standard safety and cost-related web reports, but usually, but these
reports tend to be descriptive in nature and only provide data from past events without being able to
advise on the best actions forward. To provide predictive and prescriptive analytics a more advanced
approach is needed. This approach is nowadays possible thanks to increase in computer processing power
and the decrease in database storage capacity costs. Our approach leverages on this by integrating various
machine learning and analytics techniques into a multi-methodological approach to answer our research
question.
The data analyzed came from Coca-Cola FEMSA based out of Mexico. This company operates a fleet of
around 3,000 telematics-enabled delivery trucks in Mexico alone. These trucks are focused on the last-
mile delivery from regional distribution centers to both large grocery stores and nano stores all around
8the country. The data from the telematics sensors is sent continuously to the cloud to give real-time
insights to the company and can also be exported to analyze historical datasets. The company provided
us with an entire year´s worth of data from those 3,000 trucks which accounts for around 600,000 driving
days.
In summary, our project focused on finding the safest and most fuel-efficient driving styles and the
inherent tradeoffs between safety and fuel efficiency. We are using data from the truck fleet of Coca-Cola
FEMSA Mexico. To answer our research question, we will be using a multimethodological approach that
includes various machine learning and analytics techniques. We hope that this research leads to data-
driven improvements in efficiency and safety for this company and the last-mile transportation industry.
2 LITERATURE REVIEW
Numerous articles have been written on transportation safety, fuel efficiency, sustainable supply chains,
driving styles, and telematics analytics. The objective of this project is to find out which driving styles are
the most fuel-efficient and safest and analyzing the inherent tradeoffs between safety and efficiency.
Different approaches for understanding driving behaviors have been researched throughout history, all
the way from manual surveys to advanced analytics on telematic data. Three main modeling scales used
to estimate and understand fuel consumption were defined by Chen et al. (2017) as: First, the microscopic
approach takes near real time values and builds a model given the second-to-second decisions of the
driver. Second, the macroscopic approaches look at cumulative data from long periods and uses one trip
or day as a measure of unit. Third, the mesoscopic approaches, which makes a hybrid combination of
microscopic and macroscopic data to model fuel consumption. Our approach will focus on the
macroscopic level by analyzing the summary of daily metrics per truck.
With the advent of big data and advances in machine learning practices, a new branch of analytics was
created that is commonly referred to as telematics analytics. Several approaches can be taken to analyze
9the massive amounts of data coming from the telematic devices. Carlos et al. (2020) analyzed vehicle
telematics around aggressive behavior and the relation to road accidents worldwide. Their approach used
first and second order representations to model accelerometer data for classifying driving behavior.
Following this approach, we are looking into incorporating accelerometer data, among other variables,
into our model.
Various projects analyzed the data that can be collected from smartphone sensors, for example, the article
published by Kang and Banerjee (2017) in which they showed how modern smartphones can be used
widely to collected data on accelerations, brakes, turns and lane changes. This can serve as
encouragement for smaller firms that lack access to advanced telematic devices but want to tap into the
advantages of analyzing their drivers’ style to improve on their safety, sustainability, and fuel efficiency.
By leveraging the framework and insights provided in this project, firms can even use readily available
data as shown in the paper by Kang and Banerjee. In this project we not only extracted telematics data
but also further analyzed it to propose data-driven best practices, taking into considerations different
impacts of a driving style.
2.1 Safety
Fleet management’s top priority is generally safety. A car accident can be very hard to model or predict
given the chaotic nature of an accident and the high number of external factors that can influence an
accident. Driver behavior is certainly one of the biggest factors. Johnson et al. (2009) found that “as many
as 56% of deadly crashes involve one or more unsafe driving behaviors typically associated with aggressive
driving”. An aggressive driving style is a behavioral pattern or classification of a driver which is associated
with risky speeding profiles (irregular, instantaneous and abrupt changes in vehicle speed). Toledo et al.
(2008) also found that even after controlling for the larger distances they drive, company car drivers are
50% more likely to be involved in car crashes compared to other drivers.
10Some studies focus on understanding driving styles from data in multiple applications, such as
autonomous driving, insurance applications, and driver distraction detection. Meiring et al. (2015)
reviewed the ongoing research on driving style analysis systems and their applications and synthetized
the updated research in their article “A Review of Intelligent Driving Style Analysis Systems and Related
Artificial Intelligence Algorithms”. According to them, one of the most traditional ways to rate driving
styles is through surveys. For example, the Driver Behavior Questionnaire (DBQ) used by Richard Rowe et
al. tested repeatedly with DBQ around 12,000 drivers six months after they passed their driver’s license
test and confirmed the integrity and validity of DBQ as a driver behavior measure in traffic accident
prediction, however this approach requires a manual input of each driver and relies in the driver’s integrity
and may vary with time. Similar approaches were proposed by Houston (2003) with the Aggressive Driving
Behavior Scale (ADBS) and by Harris (2014) with the Prosocial and Aggressive Driving Inventory (PADI).
Houston and Harris have shown that there is a statistical correlation between driver behavior and crash
involvement. Their study focused mainly on individual variability associated with numerous parameters
such as age, gender, and geographic locations.
Another approach to measuring driving safety is by analyzing in-vehicle data (Toledo et al., 2008). used
IVDR (In Vehicle Data Recorder) to measure different factors related to safety. For example, the
acceleration and direction of the vehicle, both in the lateral and longitudinal directions are measured by
accelerometers at a sampling rate of 40 measurements per second. The vehicle speed is derived from the
GPS receiver data or from the vehicle speed sensor (VSS). Then they apply pattern recognition algorithms
to the raw measurements to detect maneuvers that the vehicle performs. In Error! Reference source not
found. we can appreciate how a turn maneuver (left) and a lane change (right) can be differentiated by
detecting the changes in longitudinal and lateral acceleration.
Figure 1: Characteristic turn maneuver and lane change patterns
11Note: In their research, Toledo et al. (2008) use this information to calculate risk indices that indicate on
the overall trip safety. Drivers receive feedback through various summary reports, real-time text messages
or an in-vehicle display unit. Reductions in crash rates and the risk indices are observed in the short-term.
Another more recent study by Amarasinghe et al. (2015) proposed a cloud-based driver monitoring and
vehicle diagnostic app with OBD2 Telematics. They design an architecture in which an OBD2 (On Board
Diagnostics) sensor reads the data generated in real time from the vehicle computer and monitor different
parameters, such as speed, acceleration, and cooler temperature. These inputs are then processed and
analyzed automatically by algorithms that detect reckless driving from high lateral and longitudinal
acceleration changes, proving the possibility of developing an application that could give feedback. The
study shows different metrics and the way to measure them but does not go in the detail of the
interactions between different parameters or their relations with the driving styles.
Lack of attention is another important factor defining driver safety. The “100-Car Naturalistic Study” was
a study designed by the National Highway Safety Administration (NHTSA) in collaboration with the Virginia
Tech Transportation Institute (VTTI) to provide insight on the influence and contribution of driver behavior
immediately preceding an accident. This study was performed on 100 vehicles fitted out with surveillance
and other sensor devices for a duration of a year, driven collectively for nearly 2 million miles, and
12accumulated 42,000 h of data from the 241 drivers. It revealed that 78% of the 82 accidents recorded,
and 65% of the 761 near accidents, were the direct effect of driver inattention.
Douglas and Swartz (2016) proposed that three main factors that affect driver safety: external forces,
organizational forces, and regulatory forces. Regulatory forces include all the regulations and policies
coming from governmental agencies. Organizational forces are the ones set by a company such as
dispatching policies, safety priorities and the climate risk of acceptance. External forces, such as road and
weather conditions, also affect a driver safety in a variety of ways.
Figure 2: Forces Influencing Driver Safety (Douglas and Swartz, 2016)
Organizational forces can be adjusted to improve driver´s safety, as demonstrated by Rodriguez, Targar
and Belzer (2006). They proved that driver safety, as measured by crash incidence, can be improved by
two factors. The first one is by increasing retention of employees, as more experienced drivers have fewer
accidents. The second one is by increasing the pay regime, as their data showed how better paid drivers
had also fewer accidents.
132.2 Fuel Efficiency and Costs
The optimization of fuel use while driving is also affected by various factors including the inherent
efficiency of the truck, the optimization of the route and the maintenance of the truck. One way
companies can improve their fuel efficiency is by incentivizing drivers to reduce their fuel use.
Adamidis, Mantouka and Vlahogianni (2020) also showed that adopting smooth driving can have a
statistically significant impact on fuel efficiency and emissions. Some of the behaviors that they observed
related to the acceleration and the braking speeds of the vehicles. Figure 3 shows some of the various
factors that influence fuel efficiency.
Figure 3: Factors Influencing Fuel Efficiency
In this project, the main variables to be analyzed are the Vehicle Make and Model and the Driving Styles,
as there is no readily available data on fuel quality, and routing optimization is out of the scope of this
project. The expected fuel efficiencies for each Vehicle, Make and Model can be found on the specific car
manufacturer’s websites. To ensure the applicability for Coca-Cola FEMSA and avoid any outside effect,
the project team ran a regression model to understand the impact in fuel efficiency of the mentioned
parameters.
14The term Eco-driving was credited by the UK government as the adoption of a driving behavior that
maximizes the efficiency of the vehicle’s engine. Xu et al. (2014) revealed that eco-driving can reduce fuel
consumption by an amount ranging from 15% to 25% and GHG emissions by at least 30%. A recent study
by Panagiotis Fafoutellis (2014) performs an in-depth overview of existing research regarding eco-driving,
in which he concludes that ICT (Information and Communications Technology) systems to generate and
store data are crucial for the quantification and understanding of the effects that different driving styles
can have. Driving style is also remarked in existing research as one of five components of fuel
consumption, with road geometry, vehicle specifications, traffic and weather conditions being among the
most influential (Gilman, et. al, 2015). Another conclusion from their study is that a big data approach is
needed to jointly consider data from different sources of information. As stated by Fafoutellis (2014),
Linear models can be considered more useful in assessing the influence and importance of each factor in
fuel consumption rather than predicting it, while machine learning and deep learning algorithms, such as
AdaBoost and neural networks perform better to predict the fuel efficiency, but do not offer much insight
since they are not explainable models.
Ping et al. (2014) explained that modeling driving behavior under inherently dynamic driving conditions is
complex. They also showed how making a quantitative analysis of the relationship between the driving
behavior and the fuel consumption is difficult. Nevertheless, in their study, they applied machine learning
algorithms to smartphone data to implement driving style identification. Several studies have used
smartphone data to mimic vehicle telematics data. They showed that speed and acceleration are
discretized by the smartphone which increases the error margin, and that smartphone data does not
provide the same number of parameters that can be extracted directly from the vehicle’s computer. In
their study, they developed a deep learning framework (LSTM) and used K-Means clustering to separate
drivers into different profiles and then estimate fuel consumption. Although some of the parameters were
15discretized and they did not have all possible parameters, their model achieves an accuracy greater than
80%.
To interpret the data from telematics, Yao et al. (2020) developed various Machine Learning models
focusing on driving behavior (speed, acceleration, constant speed duration and braking). The algorithms
exploited were Neural Networks, Random Forest and Support Vector Regression. All models achieved
RMSE values of 0.87, 0.89 and 0.78 respectively, which correspond to a MAPE of less than 10%.
Vittorio Astarita et al. (2013) managed to develop an app called EcoSmart, which replies driving behavior
describing apps for a limited set of parameters without the need of connecting with OBDII or any vehicle
data. EcoSmart generates fuel consumption simulations based on smartphone GPS and a set of tuned
parameters that vary in under 5% with data reported by vehicle telematics. While this approach is practical
and easier than the previously mentioned OBDII connected app, it is limited since the simulations could
bring less accurate results for shorter and more chaotic routes, e.g., with variable traffic, slopes, stops and
load, which is this study’s focus.
Common approaches to improve driver styles mentioned in research include targeted pricing policies. For
example, Fafoutellis et al. (2020) suggested new regulations for alternative fuel vehicles and a systematic
upgrade of the transport infrastructure towards a more connected and cooperative city environment. On
the other hand, Scania, C. (2014) mentioned that “by gaining knowledge of the impact of their actions on
fuel consumption, drivers are more likely to adopt more environmentally friendly practices”. Another
impactful approach is designing a proper driving reward system. Lai (2015) showed how through a proper
reward system, a 10% improvement in fuel consumption efficiency was achieved.
2.3 Fuel Efficiency and Sustainability
With the increased attention around climate change and corporate responsibility, a growing number of
companies are looking into becoming more sustainable for the environment. Companies, such as Amazon,
16have signed Climate Pledges to build sustainable business which they translate as becoming net zero
carbon. The idea behind net zero carbon is to eliminate or offset all CO2 emissions that are produced in
any point of their supply chains. Our project helps companies in identifying fuel efficient driving styles that
can lessen the amount of CO2 produced.
Fuel consumption and CO2 emissions go hand in hand, and several factors influence how efficient fuel
consumption can be. Demir et al. (2011) considered four different factors: the vehicle, the environment,
the traffic, and the operations. Demir et al. (2014) published another article that narrowed down the
factors that most influenced the number of emissions to total mass, speed, and road gradient.
Another approach that was proposed by Jaller et al. (2015) was to move the transportation of goods and
materials to hours of the day in which there is less congestion. Their study showed that freight deliveries
that were done in hours with less traffic led do reduce fuel consumption. This last study supports the
observations from previously mentioned studies in which constant changes in speed lead to higher
consumption of fuel.
Optimizing truck allocation by truck type is another approach that has been taken to reduce fuel
consumption. Velázquez et al. (2016) standardized this approach into a methodology that uses K-means
clustering and Tukey´s method to cluster trucks into certain types. These types can then be optimally
assigned to environments in which they would perform at their best and in this way reducing the overall
emissions produced by the fleet.
Many of the factors that impact fuel efficiency positively are the same ones that impact the environment
positively. As the main offender to sustainability in transportation is the burning of fossil fuels, we see no
inherent tradeoff between these two topics.
17Figure 4: Factors Influencing Sustainable Supply Chains
Note: The factors considered for this project are the analysis of fuel efficiency in hours that have low
traffic, the changes in environment such as constant changes in altitude, the information around the
vehicles and the general constraints of the operation.
2.4 Conclusions
From data gathering to problem modelling, various challenges have been found for understanding driving
styles through data and proposing strategies for improving safety and fuel efficiency. Many articles have
been created given the timely importance of safety, cost, and sustainability, as well as the increasing
technological development and general interest for data science and machine learning. Specific solutions
for specific problems related to driving behavior have been designed; some traditional methods like DBQ
and some other more complex like the diagnostic app with OBD2 connected with vehicle telematics.
To provide insights into how all these different factors relate to and affect each other, this project analyzes
the interactions around vehicles and their characteristics, the environment in which the drivers conduct
their day-to-day business, organizational forces such company policies and regulations, driving styles such
as constant changes in velocity, vehicle cargo as measured by the gross weight of the cargo and traffic. All
18these different variables are analyzed in the context of the two main dimensions of this project which are
safety and fuel efficiency. The articles that have been cited center on specific aspects of either safety or
fuel efficiency. Our project goes further by also analyze the trade-off situations between the different
variables and to also find situations in which there are clear win-win scenarios.
Figure 5: Driving Styles Independent Variables and Dependent Variables
Note: The variables in squares are a fraction of the independent variables that are used to describe the
driving styles, the variables in the center are the dependent variables that are the focus of the project.
193 METHODOLOGY
To understand which driving styles can help fleet owners improve safety and fuel efficiency, we followed
an approach that involved multiple machine learning and analytical techniques. Figure 6 shows our overall
approach. The first step consisted in Business Understanding, Data Understanding and Data Preparation,
all of which is explained in detail in sections 3.1, 3.2 and 3.3. The second part of our methodology involved
doing regression analysis to understand how our different independent variables impact fuel efficiency
(section 3.4.1) and a classification model to see how variables affect safety (section 3.4.2). The third part
involved factor analysis to reduce the dimensionality of our dataset to create clusters that represented
different driving styles (section 3.4.3). The fourth part involved analyzing each of the clusters to
understand what differentiates each driving style and how this impacts safety and fuel efficiency (section
3.4.4). The fifth and final part was drafting the conclusions to propose best practices to increase safety
and fuel efficiency (3.4.5).
Figure 6: Methodology
Note: numbers on the diagram represent the section in this document where more information can be
found.
20Throughout the project, we followed the Cross Industry Standard Process (CRISP) for Data Mining
framework (Shearer, 2000). This framework constitutes a general framework that emphasizes the
iterative nature of data mining problems. Figure 7 shows the general framework; its application to this
project is detailed in the following sections. The Evaluation steps are discussed in parts throughout this
section and in the Results section. The Deployment was not part of the scope of this project, but several
recommendations for deployment are given in section 6, Insights and Management Recommendations.
Figure 7: Cross Industry Standard Process for Data Mining CRISP-DM (Shearer, 2000)
3.1 Business understanding
Our initial research helped us understand the Coca-Cola FEMSA´s business needs. This research consisted
of reading academic documents, industry reviews, and annual reports shared by organizations such as the
Intergovernmental Panel on Climate Change (IPCC) and the American Transportation Research Institute
21(ATRI) for a high-level overview. This research showed that drivers’ decisions and driving style is one of
the main factors defining the safety and fuel efficiency of any company’s fleet.
Coca-Cola FEMSA also shared documentation regarding their telematics approach and objectives, to focus
the project and validate the company´s approach to using Telematics Data by comparing them with the
reviewed literature. Based on the initial research, the company’s main priorities are safety and fuel
efficiency (which affect equally cost savings and CO2 emissions).
A series of weekly interviews and discussions were held with Coca-Cola FEMSA’s secondary distribution
stakeholders. In these discussions, insights were shared from visualizations in Power BI, receiving
feedback and interpretation from Coca-Cola FEMSA´s experts. During these sessions we interviewed the
Director of Distribution, the Telematics Managers, and the Digital Analytics teams.
To gain a better understanding of the day-to-day of the truck drivers of Coca-Cola FEMSA, a field visit was
arranged. By accompanying truck drivers during their daily routes to deliver beverages, interesting insights
beyond the data from telematics emerged. Important insights from the field trip include that some
important information not reflected in telematics can impact the drivers’ decisions, for example, traffic,
street conditions, weather, and other vehicles’ driving behavior.
3.2 Data understanding
The amount of available data in this project was an important challenge. A telematics supplier integrates
with over 3,000 trucks to generate over 40 different tables that are updated every day or some even every
minute, each table having different parameters with different aggregation levels, therefore a clean data
set is fundamental for the project. A data dictionary was created to better understand each of the
different parameters shown in the reports, as well as the aggregation level of each report. Weekly calls
with the telematics team helped to clarify questions from the team.
22With the data dictionary ready, different visualizations in Microsoft Power BI helped us to get an initial
feel for the data. These visualizations were iteratively validated and discussed with Coca-Cola FEMSA´s
stakeholders to clarify the expected ranges for important parameters and the expected relations between
them.
3.3 Data preparation
The following criteria were followed to clean the data:
• For outlier treatment we followed two approaches depending on the attribute. For most
attributes, we trimmed the values to what the users found to be real minimums or maximums. As
an example, for the attribute “Hours Driven”, there is no way a driver could have driven for more
than 24 hours in one day. For attributes in which there was no knowledge of the limits, a
conservative approach was followed, trimming only the values that went beyond 3 times the
interquartile range.
• Trucks that do not report fuel usage or full telematics data were removed. This removed a large
part of the trucks that the company uses but still left us with 360 trucks with data from 325 days
of delivery.
Data was also further processed in the following manner:
• One-hot encoding of variables are used to transform categorical variables (e.g., truck type and
model) into dummy variables to be used in regression models.
• Several features had to be engineered to be used in the system. Mainly features that were a ratio
of the time an activity took in respect of the total operating time, for example, the total time a
truck spent accelerating with respect to the total time of operation.
• Feature scaling was used to normalize the range of independent variables. The feature scaling
method used was min-max normalization. What this method does is that the minimum value of
23an attribute becomes 0 and the maximum value becomes 1 and all the other values are adjusted
on that 0 to 1 scale.
3.4 Modeling
Our approach for modelling involved three different machine learning models. The first one was a
regression model to understand the how different driving behaviors impact fuel efficiency, the second
one was a machine learning model to understand how different driving behaviors impact safety and the
third model was a clustering analysis of driving behaviors to create different driving styles clusters to
analyze how these driving styles affect safety and fuel efficiency simultaneously.
3.4.1 Fuel Efficiency
For our first regression model, the dependent variable to be analyzed is fuel efficiency as measured by
kilometers per liter, where a higher fuel efficiency is better for the economy of the company and produces
a lesser amount of carbon dioxide per kilometer driven. To quantify the monetary impact of any change,
the average of the price per liter in Mexican pesos is used. To obtain the average price per liter, a dataset
of all refuels of 2020 is used, which was 18.16 MXN per liter. To obtain the average carbon dioxide
produced per liter of diesel we used a constant of 2.68 kilograms of carbon dioxide per liter.
Different regression algorithms were tested to explain the main forces impacting fuel consumption. Some
of the models considered were multiple linear regression (i.e., polynomial regression), support vector
regression and simple decision trees. Other ensemble methods were tested like boosting (e.g. AdaBoost,
XGBoost and LighGBMs), bagging (e.g. random forests) and stacking of various ensemble and simple
methods. Although the bagging and boosting models explained the variance in observations
measurements better (As reference, the adjusted R2 for the AdaBoost Regressor was 0.72 while for the
Linear Regression it was 0.67), we decided to use multiple linear regressions because they are fully
explainable. These types of models allow us to explain how the model interprets the inputs to produce
outputs as opposed to a black model that only produces outputs that are not explainable. To make sure
24the results of the linear regression are reproducible, the main four assumptions behind linear regression
were tested using residuals plots. Here is a list of the main four assumptions:
1. Independence of observations
2. Linearity of Response
3. Normality of Residuals
4. Homogeneity of Variance (i.e., homoscedasticity)
Multicollinearity issues were addressed in three different ways:
• Feature Selection was carried out by understanding the meaning behind each of the attributes to
discard metrics that were proxies of each other.
• A Pearson Correlation Map was created to discard attributes with correlation greater than 0.6 to
at least one of the attributes that a Pearson correlation coefficient, which indicates a high
correlation with another feature that increases the effect of multicollinearity. A correlation
analysis only checks the probability of a correlation problem between two attributes.
• Variance Inflation Factor (VIF) was obtained for each of the attributes, and we discarded attributes
that had a factor greater than 5, which would indicate highly correlated attributes. A Pearson
Correlation Map helps with identifying pairs of attributes that are correlated, while the VIF
approach helps to identify multicollinearity among the interactions between the variables, not
just between two of them.
25Once the regression was validated, we developed a Microsoft Power BI-based simulation tool that allows
the users to simulate what would be the fuel efficiency gains if any of the dependent variables are
modified. Afterwards, we use the results of our regression and validated them against samples of data.
The samples used came from drivers where we had detected abrupt changes in their fuel efficiency. To
detect the abrupt changes in fuel efficiency behavior for each driver we calculated a rolling 7-day average
of fuel efficiency to smooth out the daily noise and only kept those drivers in which we saw a change that
remain constant, an example is shown in Figure 13.
3.4.2 Safety
Safety is not a straightforward concept to measure. Some of the proxies for measuring safety include
number of accidents or proprietary Safety Scores given by telematics data providers. Our initial approach
to understand which driving behaviors affect safety was to use accidents as our dependent variable on a
regression model.
Predicting crash rates is hard to measure given that accidents are stochastic events that not always follow
the same pattern and depend on a wider variety of directly controllable factors like driving style and
external factors like the weather, external traffic and highly uncertain events like people crossing streets
or other drivers’ reckless driving. An econometric model was used to analyze the driving behavior of the
drivers that had accidents. The econometric model was based on logistic regressions to predict the
probability of an accident occurring. Econometric models allow the model to incorporate past events (by
using lag features) that have led to an accident, such as a driver incurring in unsafe practices for several
days in a row. Another option includes using several proxies for safety: events such as reducing the velocity
of the vehicle too quickly or events in which vehicles make hard turns at considerable speeds. Events like
these could be used as proxies for safety as they are considered unsafe behaviors.
26Our econometric model to predict accidents did not produce statistically relevant results. This was seen
by an adjusted R2 that was less than 0.2 and attributes with p-values greater than 0.05. Therefore, this
part of the process was not integrated into the results. Our hypothesis of how to make this model work
would be to structure how the data is collected and analyze more data related to status of the driver as
suggested by Houston, J. (2003) and Harris, P. (2014).
Given that our first proxy for safety failed to work, we decided to use Coca-Cola FEMSA’s telematics
provider Safety Score. This score uses various events to calculate a proxy to the probability to have an
accident. The calculations used are Intellectual Property of the supplier, but they are based on a micro
modeling approach similar method to Toledo et al. (2008) mentioned in the literature review (i.e., real
time analytics of telematics data). For example: a sudden longitudinal and lateral acceleration change
measured by the vehicle’s computer may indicate an abrupt turn. This way, the previously mentioned
independent variables were generated (e.g., abrupt lane change, abrupt turns acceleration or braking
events while turning, etc.).
To understand the relative importance of our independent variables regarding the Safety Score we
discretized the Safety Score variable into 6 equal-frequency categories. The reason for discretizing the
variable instead of treating it as continuous numerical feature is that the Safety Score is bounded by an
upper limit at 100. So, a linear regression model would produce results with heteroscedasticity problems.
Therefore, we ran a classification model using 20 independent variables to predict one of the 6 Safety
Score classes. Figure 15 shows the ranges and number of observations for each of the 6 classes. The
independent variables used are listed in Table 2.
We tested among various machine learning models to decide on which machine learning model would
best fit the data. Among the options that we tried were Random Forest, AdaBoost, Naïve Bayes and
Support Vector Machines (SVM). Table 1 shows the comparison between the different machine learning
27models. The machine learning algorithm that produced the best results in terms of Area Under the Curve
(AUC) was Random Forest Regressor. The AUC is a common metric to evaluate the results of multiclass
classification problems as it provides an aggregate measure of performance across all possible
classification thresholds. A common way to interpret this metric is as the probability that the model ranks
a random positive example more highly than a random negative example.
3.4.3 Cluster Analysis
Our third and final model was clustering. Clustering is a family of machine learning that allow for
unsupervised learning. The intention of using clustering was to group the different driving behavior
characteristics that are gathered at the daily and truck level to identify clusters of driving styles. As input
variables we used twenty different variables shown in Table 2.3.
The clustering approach that we decided to use was a Bayesian Gaussian Mixture Model. The reason for
using a probabilistic Gaussian Mixture model is that it allowed to us to better understand the properties
of input examples. Many clustering algorithms like K-Means simply give a cluster representative that
shows nothing about how the points are spread. The Gaussian properties of this approach gives us not
only the mean of the cluster but also the variance which can be used to estimate the likelihood that a
point belongs to a certain cluster. The reason for choosing a Bayesian Gaussian Mixture Model instead of
the traditional Gaussian Mixture was to take a probabilistic approach to choosing the number of clusters.
With a traditional Gaussian Mixture Model, a Bayesian Information Criterion (BIC) or the Akaike
Information Criterion (AIC) techniques must be used to select an optimal number of clusters. While with
a Bayesian one, the algorithm takes the cluster parameters as latent random variables, not as fixed model
parameters. In other words, with this algorithm you can set an initial maximum number of clusters and
the algorithm will decide the optimal number of clusters to reward models that fit the data well while
minimizing a theoretical information criterion. The possible range of number of clusters would be
between 1 and the maximum number of clusters that was set. For our problem, we chose a maximum
28number of clusters as 10 as this would allow us to separate the driving styles into business-relatable
information but the algorithm suggested 5 clusters as the optimal number for clusters.
Table 1: Features used for Cluster Analysis
Feature ID Variable name
1 Life mileage
2 Max. engine t(°C)
3 Max. RPM
4 Top Speed
5 Operation time
6 Time in DC
7 Avg. Speed
8 % route under min. t(°C)
9 Over Revolution Time %
10 Idling time %
11 Acceleration Route time %
12 Overspeed events (%)
13 Number of stops (%)
14 Abrupt Acceleration
15 Abrupt Braking
16 Abrupt turns
17 Abrupt Lane Changes
18 Acceleration while turning
19 Braking while turning
20 OverAcceleration events
Note: All variables were measured at a vehicle-day disaggregation level.
3.4.4 Individual Cluster Analysis
Each cluster generated by our model had a weight from independent variables that impact fuel efficiency,
for example idling times and excessive acceleration events, as well as independent variables related to
safety, for example abrupt lane changes, abrupt turns and acceleration or braking events while turning.
Each cluster was generated based on the independent variables that represent the driving behavior, to
explain which patterns each driver follows. Then we used the created clusters to see how they in terms
of fuel efficiency and safety score with the purpose of explaining the tradeoffs between the different types
of driving styles.
29To increase each cluster’s interpretability and applicability to business daily practices, a persona was
defined for each cluster. A persona is term borrowed from the marketing industry which is described as
“the aspect of someone’s character”. Our intention in using these personas was to create fictitious but
relatable characters so that the driving style of any driver could be identified and easily recognized. Our
Gaussian Mixture Model approach also allows for driving styles to be, probabilistically speaking, part of
many of driving styles.
3.5 Conclusions
To answer our research question of which driving styles can help fleet owners increase safety and fuel
efficiency we used multiple machine learning and analytics techniques. We used data from over 3,000
trucks to come up with a fuel efficiency regression model, we had an unsuccessful attempt at predicting
crash rate safety with econometric regression so we ended up using a proprietary Safety Score from the
telematics provider as a proxy for Safety and we developed a clustering analysis to drive the business
recommendations, actionable insights, and recommendations. Given the amount of data we were dealing
with we also followed the CRISP-DM methodology to guide us through the iterative process of data
mining. In the next section we will describe the results of each model.
4 RESULTS
4.1 Fuel Efficiency
4.1.1 Regression Model
Our polynomial regression model to understand the main drivers behind fuel efficiency (kilometers per
liter of diesel) contained 13 independent variables plus the bias term. The linear regression model had an
R2 of 0.67, MAPE of 8.7%, MAE of 0.23 and a RMSE of 0.28. As context, the mean fuel efficiency was 2.72
kilometers per liter with a standard deviation of 0.52. Figure 8 shows a histogram of the distribution of
fuel efficiency.
30You can also read