Future changes in the extratropical storm tracks and cyclone intensity, wind speed, and structure
←
→
Page content transcription
If your browser does not render page correctly, please read the page content below
Weather Clim. Dynam., 3, 337–360, 2022
https://doi.org/10.5194/wcd-3-337-2022
© Author(s) 2022. This work is distributed under
the Creative Commons Attribution 4.0 License.

Future changes in the extratropical storm tracks and
cyclone intensity, wind speed, and structure
Matthew D. K. Priestley and Jennifer L. Catto
College of Engineering, Mathematics and Physical Sciences, University of Exeter, Exeter, UK

Correspondence: Matthew D. K. Priestley (m.priestley@exeter.ac.uk)

Received: 11 November 2021 – Discussion started: 15 November 2021
Revised: 2 February 2022 – Accepted: 22 February 2022 – Published: 31 March 2022

Abstract. Future changes in extratropical cyclones and the      ing, 2004) and precipitation (Hawcroft et al., 2012). In the
associated storm tracks are uncertain. Using the new CMIP6      most recent assessment report from the IPCC (AR5; Chris-
models, we investigate changes to seasonal mean storm           tensen et al., 2013), it was stated that it is likely there will be
tracks and composite wind speeds at different levels of the     a poleward shift of storm tracks in the Southern Hemisphere
troposphere for the winter and summer seasons in both the       (SH) and North Pacific; however, there is low confidence in
Northern Hemisphere (NH) and Southern Hemisphere (SH).          the magnitude of regional storm track changes. With the re-
Changes are assessed across four different climate scenarios.   cent availability of models from the 6th phase of the Coupled
The seasonal mean storm tracks are predicted to shift pole-     Model Intercomparison Project (CMIP6; Eyring et al., 2016),
wards in the SH and also in the North Pacific, with an exten-   a renewed assessment of these changes can be made.
sion into Europe for the North Atlantic storm track. Overall,      Changes in the seasonal mean storm tracks are relatively
the number of cyclones will decrease by ∼ 5 % by the end of     robust and have been consistent across a number of genera-
the 21st century, although the number of extreme cyclones       tions of GCMs (Yin, 2005; Chang et al., 2012, 2013; Colle
will increase by 4 % in NH winter. Cyclone wind speeds          et al., 2013; Zappa et al., 2013; Harvey et al., 2020). In the
are projected to strengthen throughout the troposphere in the   SH a robust poleward shift of the storm track is projected
winter seasons and also summer in the SH, with a weak-          (Bengtsson et al., 2006; Chang et al., 2012; Chang, 2017),
ening projected in NH summer, although there are minimal        with the pattern of change being less clear in the Northern
changes in the maximum wind speed in the lower tropo-           Hemisphere (NH). In the NH there is a projected shift of
sphere. Changes in wind speeds are concentrated in the warm     the storm track poleward in the western North Pacific and
sector of cyclones, and the area of extreme winds may be up     an extension of the North Atlantic storm track into Europe
to 40 % larger by the end of the century. The largest changes   (Bengtsson et al., 2006; Zappa et al., 2013; Harvey et al.,
are seen for the SSP5-85 scenario, although a large amount of   2020). Furthermore, a reduction in the number of cyclones
change can be mitigated by restricting warming to that seen     over the Mediterranean is projected (Zappa et al., 2015). The
in the SSP1-26 and 2-45 scenarios. Extreme cyclones show        differing responses in the NH and SH are largely a result of
larger increases in wind speed and peak vorticity than the      opposing forcings in the upper and lower troposphere in the
average-strength cyclones, with the extreme cyclones show-      NH (Shaw et al., 2016; Shaw, 2019) and the role of low-
ing a larger increase in wind speed in the warm sector.         level, high-latitude heating in shifting the storm tracks equa-
                                                                torwards (Butler et al., 2010). Using the Eulerian definition
                                                                of the storm tracks, CMIP6 models have shown to have larger
                                                                projected changes than CMIP5 (Harvey et al., 2020). These
1   Introduction                                                larger changes are thought to be a result of the higher climate
                                                                sensitivity of CMIP6 models, relative to CMIP5 (Zelinka
Extratropical cyclones are the key driver of day-to-day         et al., 2020). Currently, no Lagrangian perspective on storm
weather variability in the mid-latitudes and can be associ-     track changes in CMIP6 models has been performed.
ated with significant impacts from extreme winds (Brown-

Published by Copernicus Publications on behalf of the European Geosciences Union.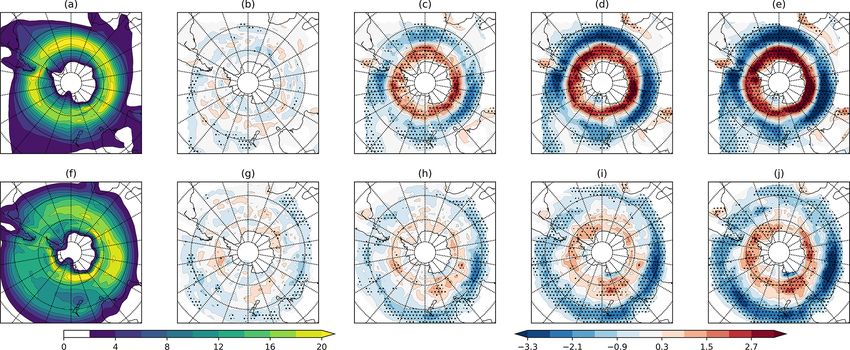
338                                     M. D. K. Priestley and J. L. Catto: Future extratropical storm tracks and cyclones

   It is widely agreed that the total number of extratropical         Commonly only the most extreme cyclones in the top 10 %
cyclones will decrease in the future (Geng and Sugi, 2003;         of the intensity distribution are examined as these often pro-
Bengtsson et al., 2006; Catto et al., 2011; Mizuta et al.,         vide the clearest climate change signal (Catto et al., 2010;
2011; Chang et al., 2012; Zappa et al., 2013; Michaelis et al.,    Sinclair et al., 2020; Chang, 2018, 2017; Zappa et al., 2013)
2017; Sinclair et al., 2020) and that the amount of associated     and are associated with the highest impacts (e.g. Ulbrich
precipitation will increase (Christensen et al., 2013; Zappa       et al., 2001). However, it has been demonstrated in numer-
et al., 2013; Michaelis et al., 2017; Kodama et al., 2019; Sin-    ous studies that cyclones in the middle of the distribution
clair et al., 2020). However, there is disagreement in how the     can respond differently to the most extreme cyclones (Cham-
number of extreme cyclones will change, with some studies          pion et al., 2011; Michaelis et al., 2017; Sinclair et al., 2020),
projecting an increase (Geng and Sugi, 2003; Mizuta et al.,        with this commonly linked to the role of moist processes in
2011; Colle et al., 2013; Grieger et al., 2014; Pfahl et al.,      cyclone intensification (Pfahl et al., 2015; Büeler and Pfahl,
2015) and some a decrease (Zappa et al., 2013; Michaelis           2019).
et al., 2017). Despite this, there is a general consensus that        In this study we will utilize a cyclone compositing method
the intensity of the most extreme cyclones will increase in        (as in Bengtsson et al., 2009; Catto et al., 2010; Dacre et al.,
the future (Mizuta et al., 2011; Pfahl et al., 2015; Sinclair      2012) and a number of models from the new CMIP6 ensem-
et al., 2020; Dolores-Tesillos et al., 2021). Differences in the   ble (Eyring et al., 2016), across a range of future climate
sign or magnitude of the above changes are thought to be de-       scenarios (O’Neill et al., 2016), to attempt to reduce some
pendent on the choice of model used, the variable examined,        of the uncertainty surrounding projected change of cyclone
the geographic area of interest, and the selection of cyclones     intensity and cyclone-associated wind speeds in the future.
studied (see Ulbrich et al., 2009, and Catto et al., 2019, for a   Cyclone intensity will be assessed using relative vorticity,
full review). Consequently, a coherent multi-model analysis        MSLP, and cyclone wind speeds. The questions we address
of extratropical cyclones on a global scale using consistent       in this study are as follows:
methodologies is required to fully understand the changes to
                                                                       – How will the frequency of extratropical cyclones
cyclone intensity and frequency.
                                                                         change in the future and what are the regional variations
   With regards to regional dependence, previous studies
                                                                         in changes to the seasonal storm tracks?
have demonstrated that cyclones are projected to increase
in intensity in the SH (Chang et al., 2013; Chang, 2017),              – How is cyclone intensity projected to change and do dif-
with a likely decrease in the NH (Zappa et al., 2013; Chang              ferent intensity metrics give differing projections?
et al., 2013; Colle et al., 2013), with this also being season-
ally dependent (Lehmann et al., 2014). Any changes are also            – Do extreme and moderate-strength cyclones respond
dependent on the variable examined (Ulbrich et al., 2009;                differently to changes in the future climate?
Catto et al., 2019), with studies that examine mean sea level
pressure (MSLP) demonstrating an increase in cyclone in-           2     Data and methods
tensity (Bengtsson et al., 2006; Mizuta et al., 2011) and
those using vorticity showing little change or even a reduc-       2.1    CMIP6 data
tion (e.g. Champion et al., 2011; Zappa et al., 2013; Sin-
clair et al., 2020). Cyclone wind speed is commonly used           In this study the analysis is performed on models that are part
to define intensity as it is more directly related to socio-       of the CMIP6 (Eyring et al., 2016) and ScenarioMIP (O’Neill
economic impacts; however projections of changes to cy-            et al., 2016) coupled atmosphere–ocean experiments. In to-
clone wind speeds by the end of the century also tend to           tal nine models are used, and these are detailed in Table 1.
be uncertain and vary regionally (Christensen et al., 2013).       These models have been chosen as they provide data for the
In a study of NH winter cyclones Bengtsson et al. (2009)           required experiments at the necessary temporal resolutions
and Zappa et al. (2013) found a reduction in the number            for tracking, covering the historical period and the different
of cyclones with strong wind speeds. However, both found           future scenarios. For investigating sensitivity to future cli-
increased wind speed intensity over Europe. In composite           mate forcing, four different experiments, or shared socioeco-
analyses of North Atlantic cyclones Michaelis et al. (2017)        nomic pathways (SSPs; O’Neill et al., 2014), are analysed.
and Dolores-Tesillos et al. (2021) found an increase in wind       These are SSP1-26, SSP2-45, SSP3-70, and SSP5-85, and
speeds in extreme cyclones in the region of the warm front.        all feature differently evolving climate forcings throughout
Recently, Sinclair et al. (2020) used an idealized aquaplanet      the 21st century (see O’Neill et al., 2016, for full details).
model and also found evidence for an increase in the strength         The December, January, February (DJF) and June, July,
of low-level cyclone wind speeds in the vicinity of the warm       August (JJA) periods are analysed for both the Northern
front by up to 3.5 m s−1 , with this also being associated with    Hemisphere (NH) and Southern Hemisphere (SH), repre-
stronger ascent. Therefore, an assessment considering a vari-      senting each hemisphere’s winter and summer seasons. For
ety of intensity measures is therefore required to clarify these   the historical period the years 1979–2014 are used, and in
differences.                                                       each of the future scenarios the years 2040–2100 have been

Weather Clim. Dynam., 3, 337–360, 2022                                                 https://doi.org/10.5194/wcd-3-337-2022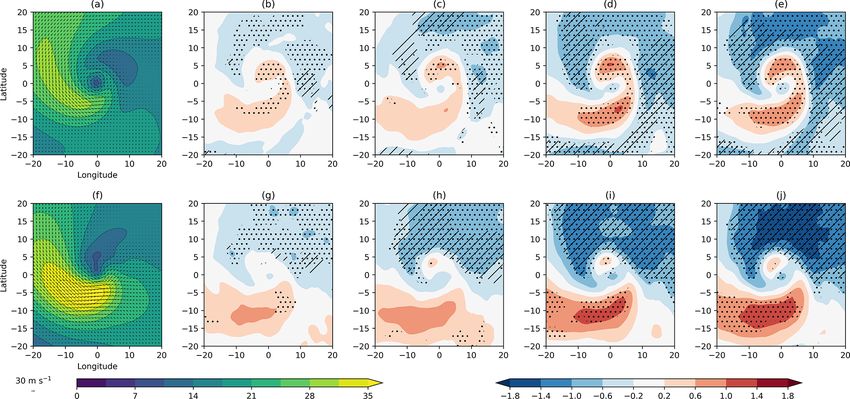
M. D. K. Priestley and J. L. Catto: Future extratropical storm tracks and cyclones                                                     339

Table 1. Table of models used that contribute data to the historical, SSP1-26, SSP2-45, SSP3-70, and SSP5-85 experiments. Grid point
resolutions stated are that of the Gaussian grid the u and v data are provided on. The quoted nominal resolution in kilometres is the stated
nominal resolution of the atmospheric component of the model from Taylor et al. (2017).

                Model name            Centre                    Grid points (lat × long)   Nominal atmospheric resolution
                ACCESS-CM2            CSIRO-ARCCSS                            145 × 192                250 km
                BCC-CSM2-MR           BCC                                     160 × 320                100 km
                EC-Earth3             EC-Earth-Consortium                     256 × 512                100 km
                MIROC6                MIROC                                   128 × 256                250 km
                MPI-ESM1-2-HR         MPI-M, DWD, DKRZ                        192 × 384                100 km
                MPI-ESM1-2-LR         MPI-M, AWI, DKRZ                         96 × 192                250 km
                MRI-ESM2-0            MRI                                     160 × 320                100 km
                NorESM2-LM            NCC                                      96 × 144                250 km
                NorESM2-MM            NCC                                     192 × 288                100 km

analysed. However, in all composite analysis only an end-of-               For the majority of analysis presented, the extreme cy-
century response is studied, and this is the period 2080–2100.          clones around the entire hemisphere are analysed. However,
                                                                        when comparing EXT and AVG cyclones only cyclones over
2.2   Cyclone identification and tracking                               the North Atlantic are studied. These cyclones must have
                                                                        at least one time step within a region from 30–70◦ N, 280–
For cyclone identification and tracking, the method of                  360◦ E, which ensures that cyclones are as similar as possible
Hodges (1994, 1995, 1999) is used. In order to identify cy-             for this comparison.
clones the method uses 6-hourly relative vorticity at 850 hPa              Composites of the subset cyclone tracks are created at the
as an input. As CMIP6 models feature varying atmospheric                time of maximum intensity (defined as the T42 vorticity) and
resolutions, the method first spectrally truncates the vortic-          cover an area of 20◦ from the track point at the time of max-
ity field to T42 and removes the influence of planetary scale           imum intensity on a 0.5◦ × 0.5◦ grid. In order to reduce any
waves by masking wavenumbers less than 5. To ensure only                discrepancies associated with the different propagation di-
mobile, well-developed, and long-lived cyclones are anal-               rection of cyclones, all composited variables are rotated so
ysed, each track must persist for at least 48 h and travel at           that the cyclone is propagating due east. The compositing
least 1000 km from its point of origin. Furthermore, each cy-           has been performed on cyclone wind speeds at 850, 500, and
clone must have a maximum vorticity of at least 1×10⁻⁵ s−1              250 hPa, to investigate changes in the lower, middle, and up-
(scaled by −1 in the SH). To assign MSLP values to tracks,              per troposphere respectively. As cyclones are only tracked
we follow Bengtsson et al. (2009) and use a B-spline inter-             at 850 hPa, composites at 500 and 250 hPa are created us-
polation and minimization technique within a 5◦ radius from             ing the co-ordinates of the cyclone at 850 hPa. Cyclone wind
the cyclone centre to identify the minimum MSLP value.                  speed composites are provided in two different perspectives.
2.3   Cyclone compositing                                               The first is the Earth relative perspective, which is the winds
                                                                        as output by the models. The second is the system relative
In order to investigate the structural features of cyclones and         perspective, whereby the speed of the cyclone (as calculated
how they respond to future warming, cyclone composites                  from the tracks) is removed and therefore allows the airflows
are created. The method used here is the same as Bengts-                within the cyclone to be investigated.
son et al. (2009), Catto et al. (2010), Dacre et al. (2012),
Sinclair et al. (2020), Priestley and Catto (2022), and numer-
ous other studies. For the compositing process two intensity            3     Results
thresholds are applied to investigate the changes to different
subsets of cyclones. The first subset is on extreme cyclones            3.1    Storm number
(EXT), and these must exceed the 90th percentile of peak cy-
clone vorticity for that hemisphere, season, and model. Sec-            A reduction in the number of cyclones per season is projected
ondly, average-strength (AVG) cyclones are investigated, and            in both the winter and summer seasons in the NH and SH
these are situated between the 45th and 55th percentile of the          (Fig. 1a–d). Across the four seasons the decrease is larger
peak cyclone vorticity distribution. For the historical period          in the simulations that have larger increases in the end-of-
the intensity thresholds are calculated across the entire 1979–         century climate forcing. In the NH the median decrease in
2014 period, whereas for the future SSPs the thresholds are             identified cyclones for SSP5-8.5 in DJF (Fig. 1a) and JJA
re-calculated for each decade (i.e. 2040–2049, 2050–2059,               (Fig. 1b) is by 5.4 % and 6.8 % respectively. In the SH the rel-
etc.) to account for the evolving forcing.                              ative decrease in the SSP5-8.5 experiment is slightly less than

https://doi.org/10.5194/wcd-3-337-2022                                                     Weather Clim. Dynam., 3, 337–360, 2022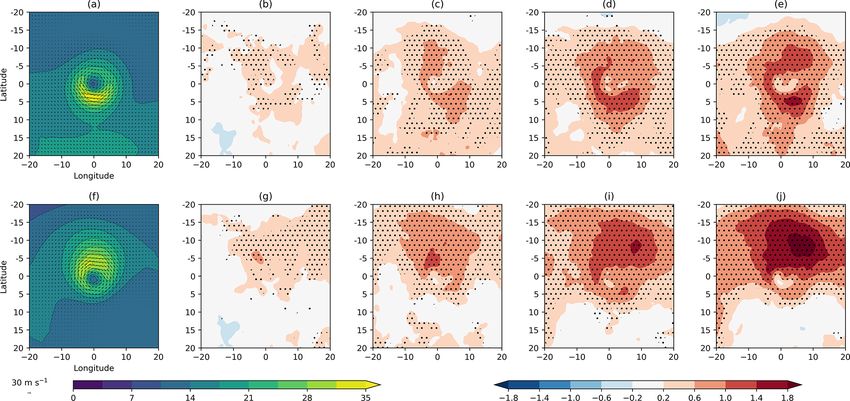
340                                        M. D. K. Priestley and J. L. Catto: Future extratropical storm tracks and cyclones

Figure 1. Boxplots of (a–d) the total number of identified extratropical cyclones in the CMIP6 models and (e–h) those that exceed the
historical 90th percentile of peak cyclone T42 vorticity for the historical (black), SSP1-26 (red), SSP2-45(blue), SSP3-70 (green), and SSP5-
85 (purple) experiments. Boxplots are shown for NH DJF (a, e), NH JJA (b, f), SH DJF (c, g), and SH JJA (d, h). The evaluated periods
are 1979–2014 for the historical simulation and 2080–2100 for the different SSPs. The yellow lines in the boxes are the median, and the
boxes extend to the 25th and 75th percentiles. Whiskers extend to 1.5 times the inter-quartile range (IQR). Notches on the boxes represent
the 5 %–95 % confidence range on the median from 10 000 bootstrap re-samples. Units for all boxes and all panels are cyclones per season.

in the NH, with reductions in DJF (Fig. 1c) and JJA (Fig. 1d)            vary significantly on the regional scale. In the NH the maxi-
of 3.3 % and 4.7 % respectively. This result is consistent with          mum cyclone track density is in the two main oceanic storm
the literature that has assessed changes in cyclone activity in          tracks in DJF and JJA (Fig. 2a, f), with a further peak in
previous-generation GCMs (e.g. König et al., 1993; Bengts-               storm track density in the Mediterranean in DJF. The abil-
son et al., 2009; Chang et al., 2012; Michaelis et al., 2017;            ity of the CMIP6 models in reproducing these features, rela-
Zappa et al., 2013) and can be understood through the re-                tive to the most current reanalyses, was discussed in Priestley
duced lower tropospheric baroclinicity that is a result of con-          et al. (2020) and will not be discussed herein.
tinued polar amplification with global warming (Geng and                    In DJF the changes in storm track density by the end of
Sugi, 2003; Bengtsson et al., 2006; Catto et al., 2019).                 the century (2080–2100) are shown for the SSP1-26, SSP2-
   To investigate changes in intense cyclones, we define in-             45, SSP3-70, and SSP5-85 scenarios in Fig. 2b–e. Changes in
tense cyclones as those that exceed the 90th percentile of the           track density are smallest for SSP1-26 (Fig. 2b) and largest
distribution of peak cyclone T42 vorticity. A fixed thresh-              for SSP5-85 (Fig. 2e), which reflects the sensitivity to in-
old of the historical 90th percentile is used to assess future           creasing levels of anthropogenic climate change noted in
changes in the SSP5-85 experiment. In NH DJF there is an                 Fig. 1. All scenarios present a similar pattern of storm track
average increase of 4.0 % in the number of cyclones exceed-              changes.
ing the historical 90th percentile (Fig. 1e). Increases are also            Looking at the two oceanic storm tracks individually, an
seen in the SH with 7.0 % and 15.6 % more intense cyclones               apparent poleward shift of the storm track is seen in the North
in DJF and JJA respectively (Fig. 1g, h). In NH JJA a de-                Pacific, with a decrease (increase) in the number of tracks
crease is identified, with 21.4 % fewer cyclones exceeding               on the equatorward (poleward) flank. This is most evident
the historical 90th percentile (Fig. 1f). It therefore appears           in the west and central longitudes of the ocean basin, where
that our results for winter cyclones are consistent with previ-          most of the cyclogenesis and strongest temperature gradients
ous studies in that a reduction in the total number of cyclones          are present (Priestley et al., 2022a). This pattern gets larger
is seen, yet there is an increase in the frequency of intense            in magnitude (and more robust across the models) with the
cyclones (Geng and Sugi, 2003; Mizuta et al., 2011; Colle                stronger climate change scenarios (Fig. 2e).
et al., 2013). However, in the summer seasons different be-                 In the North Atlantic, there is a decrease in track den-
haviour is seen in the NH and SH, with a large reduction in              sity in the subtropical central North Atlantic and an increase
the number of intense cyclones in NH JJA.                                in the track density over NW Europe and particularly the
                                                                         British Isles. Furthermore, there is a reduction over SW Eu-
3.2   Storm track density                                                rope and the Norwegian Seas, therefore presenting a tripolar
                                                                         pattern of change along the Greenwich Meridian. These sig-
Despite the decrease in total cyclone numbers projected in               nals are again largest in the highest-emission climate change
Fig. 1a–d, the change in tracks and storm track density can

Weather Clim. Dynam., 3, 337–360, 2022                                                        https://doi.org/10.5194/wcd-3-337-2022
M. D. K. Priestley and J. L. Catto: Future extratropical storm tracks and cyclones                                                      341

Figure 2. Storm track densities for the Northern Hemisphere for DJF (a–e) and JJA (f–j). Seasonal storm track densities are shown for the
CMIP6 historical multi-model mean from 1979–2014 (a, f). End-of-century (2080–2100) changes relative to the historical mean are shown
for the SSP1-26 (b, g), SSP2-45 (c, h), SSP3-70 (d, i), and SSP5-85 (e, j) scenarios. Stippling in figures indicates where 80 % of the models
agree on the sign of the change relative to the historical multi-model mean. Units are number of cyclones per 5◦ spherical cap per month.

scenario of SSP5-85, with models also tending to have the                of Greenland, which has been identified in numerous other
highest level of agreement in this scenario. The extension               studies (Bengtsson et al., 2006; Zappa et al., 2013). This is a
over NW Europe is likely associated with an extension of                 region where the poleward expansion of the tropical circula-
tracks into this region associated with increased baroclinicity          tion is projected to play a significant role, driving an increase
and higher rates of cyclogenesis (not shown) from modifica-              in jet speeds for this region (Harvey et al., 2020). The inter-
tions to ocean currents in the North Atlantic from the melt-             action of the jet with the complex orography of this region is
ing of sea ice and ice sheets (Bengtsson et al., 2009; Gervais           a likely driver of this increase.
et al., 2018, 2019; Oudar et al., 2020). The patterns of change             The storm tracks in the SH are much more symmetrical in
in the NH are broadly consistent with the recent studies of              nature (Fig. 3a, f), particularly in the summer season (DJF;
Oudar et al. (2020) and Harvey et al. (2020). As in Harvey               Fig. 3a). In the summer season (Fig. 3b–e) a poleward shift
et al. (2020), our results also demonstrate an increased cli-            of the storm track is evident, but only for SSP2-45, SSP3-
mate change signal compared to CMIP5, shown by Zappa                     70, and SSP5-85 (Fig. 3c–e). This indicates some tempera-
et al. (2013) and Lee (2015), which used the same cyclone                ture dependency on the poleward shift of the circulation that
tracking method.                                                         is not achieved for the lowest warming rates. For the three
   Other regions of note are the Mediterranean and the Arc-              scenarios that do show a poleward shift, the shift is largest
tic, where robust decreases in the number of tracks are ob-              for the scenario with the largest warming and is symmetric
served that are larger with increased future warming. How-               around the hemisphere. For SSP5-85 the average poleward
ever, due to the often smaller scale of cyclones in these re-            shift of the storm track relative to the historical simulations
gions, adaptations to identification methods may be required             (defined as latitude of maximum zonal mean track density)
to comprehensively quantify changes in these regions (Zappa              is 2.9◦ from 55.4 to 58.3◦ S. Furthermore, this shift is a very
et al., 2014, 2015).                                                     robust signal across all the models, with the most widespread
   In JJA an overall reduction in track density is seen around a         agreement in SSP5-85. Another feature of note is the robust
majority of the NH, which, as in DJF, is larger for the higher-          decrease in storm track density from the sub-tropical western
emission climate change scenarios (Fig. 2g–j). For SSP5-85               South Pacific to the southern tip of South America, which
(Fig. 2j) there is a robust decrease across North America, a             may be associated with changes in the South Pacific conver-
majority of northern Europe, eastern Asia, and the NW North              gence Zone (SPCZ; Brown et al., 2020).
Pacific. The decrease over eastern Asia is co-located with                  In JJA (Fig. 3g–j), the patterns of track density change are
the over-active northern genesis region identified in Priestley          very similar to those of DJF. There is a poleward shift of the
et al. (2022a) and is likely driven by changes in the merid-             storm tracks that is only seen for SSP2-45 and above, with a
ional temperature distribution. One region where an increase             signal that is larger for the largest climate change scenario.
in track density is identified is to the south, and downstream,          This shift is also robust across the models. The poleward shift

https://doi.org/10.5194/wcd-3-337-2022                                                      Weather Clim. Dynam., 3, 337–360, 2022

342 M. D. K. Priestley and J. L. Catto: Future extratropical storm tracks and cyclones
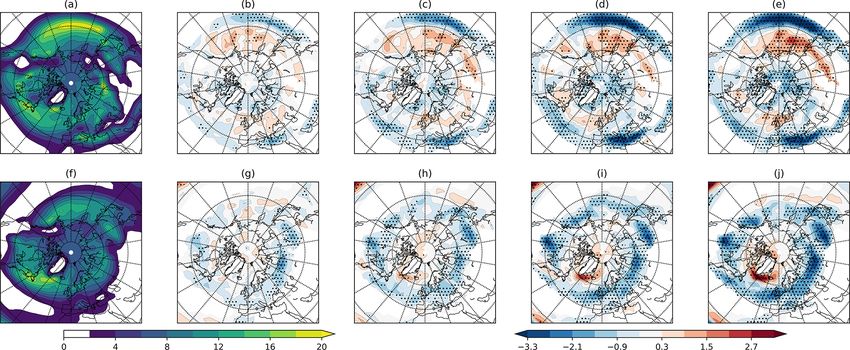
Figure 3. As Fig. 2 but for the Southern Hemisphere.
is smaller than in DJF, and for the SSP5-8.5 scenario the aver- sons. However, in the summer seasons a decrease is evident,
age poleward shift from the historical simulations is by 1.3◦ with this being notably larger in the NH.
from 60.8 to 62.1◦ S. The clear pattern in the SH is likely due All distributions exhibit a similar shape for the SSPs as
to the reduced influence of land in this hemisphere, therefore in the historical simulations. Despite this, all seasons except
allowing for the strong thermodynamical changes to have a NH JJA show a reduction in the number of cyclones near
clearer impact. The poleward shift of the circulation is ex- the peak of the distribution. This confirms that the reduc-
pected through increased tropical warming and an expansion tion in cyclones noted in Fig. 1 is most likely to be seen
of the Hadley cell (Shaw, 2019), which results in an increase for moderate-strength cyclones and not extreme cyclones (as
in stability in subtropical regions and a poleward shift of the in Fig. 1). Since a key question is how the intensity of the
main baroclinicity (Yin, 2005; Lim and Simmonds, 2009). highest-impact storms will change, the changes in the 90th
Furthermore, the amplification of polar temperature in the percentile of the vorticity distributions are shown in the in-
SH is not projected to be as large in the NH (Fan et al., 2020), set of each panel in Fig. 4. The model mean 90th percentile
further maintaining the mid-latitude baroclinicity. increases slightly with increased warming for NH DJF and
both SH seasons yet decreases for NH JJA. However, the
3.3 Cyclone intensity uncertainty estimation on the 90th percentile for each SSP
has significant overlap with the historical model estimation.
We have already shown that, as measured through relative Therefore, there are different responses in the median and
vorticity, there is a projected increase in the number of ex- 90th percentile for the winter seasons and SH summer, with
treme cyclones in the future (Fig. 1e–h). However, to quan- extreme cyclones increasing in intensity with no change (or
tify differences in measures of cyclone intensity, both the a slight decrease) in the median intensity.
T42 relative vorticity and associated cyclone MSLP mini-
mum will be examined. For both measures the peak inten- 3.3.2 Mean sea level pressure
sity is defined as the maximum (minimum for MSLP) value
throughout the cyclone life cycle. In Fig. 5 distributions of cyclone minimum MSLP are shown
and calculated the same way as for relative vorticity in Fig. 4.
3.3.1 Relative vorticity The MSLP distributions have quite different shapes, with the
NH DJF distribution having a negative skew (Fig. 5a) and NH
Figure 4 shows the peak cyclone relative vorticity distribu- JJA being normally distributed (Fig. 5b). In NH DJF (Fig. 5a)
tions for DJF and JJA in the NH and SH. For all seasons, the distributions of the four SSPs are similar to the historical
and all future experiments, the model mean distributions lie models, but with a reduction in the number of cyclones with
within the uncertainty estimation of the historical models, in- MSLP at the peak of the distribution. There is a shift toward
dicating a relatively small change in cyclone vorticity. Esti- lower pressures in NH DJF, with lower medians and also a
mations of the median vorticity are very similar for all of the lower 90th percentile (inset). The medians show more of a
future SSPs relative to the historical models in the winter sea- shift than for vorticity, although the 90th percentiles show
Weather Clim. Dynam., 3, 337–360, 2022 https://doi.org/10.5194/wcd-3-337-2022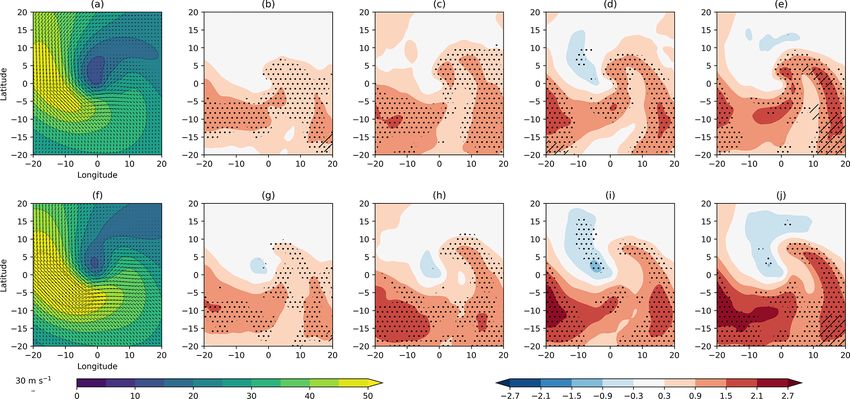
M. D. K. Priestley and J. L. Catto: Future extratropical storm tracks and cyclones                                                          343

Figure 4. Distributions of peak cyclone T42 relative vorticity for (a) NH DJF, (b) NH JJA, (c) SH DJF, and (d) SH JJA. The grey shaded
region represents the 5th–95th percentile of the CMIP6 historical models, with the black line being the multimodel mean. Coloured lines
illustrate the 2080–2100 distribution for SSP1-26 (red), SSP2-45 (blue), SSP3-70 (green), and SSP5-85 (purple). The coloured columns from
the x axis indicate the median of the distribution of each of the model experiments. The inset for each figure illustrates the 90th percentile of
each experiment distribution and associated 25th–75th percentile uncertainty on this value. Units are s−1 .

less of a shift (Fig. 4a). In NH JJA there is a slight shift to-           increase in the 90th percentile of the distribution and minimal
ward lower intensities (higher MSLP), although the distribu-               changes (or a slight weakening) in the median.
tions are again very similar with less of a shift in the median               For MSLP there are larger changes in the median of the
than for relative vorticity.                                               distribution than for relative vorticity, with this being partic-
   In the SH the distributions of MSLP in the SSPs is                      ularly notable in the SH. This is likely a result of the pole-
largely different compared to the historical experiment. In                ward shift of cyclones and the significant influence of the
DJF (Fig. 5c) there is a large reduction in frequency of cy-               large-scale pressure distribution on cyclone MSLP (Bengts-
clones with average or above-average MSLP, leading to a re-                son et al., 2006). As cyclones shift toward higher latitudes
duction in the median. Furthermore, there is an increase in                (Fig. 3), they will be moving into an environment character-
cyclones with the lowest pressures, resulting in a lower 90th              ized by deeper MSLP and stronger pressure gradients. This
percentile and the average distribution nearly lying outside               is also likely the reason why less change is seen in the 90th
the uncertainty from the historical simulations. These shifts              percentile of MSLP in NH DJF when compared to relative
in the overall distribution, the median, and the 90th percentile           vorticity, as the change in latitude of maximum track density
are also apparent in JJA (Fig. 5d), with a shift toward lower              is less apparent than in the SH (Fig. 2a–e).
pressures (higher intensity) in the SSPs that is exacerbated
in the highest-emission scenarios. This is unlike the distribu-
tions of relative vorticity (Figs. 4c, d), which show only an

https://doi.org/10.5194/wcd-3-337-2022                                                        Weather Clim. Dynam., 3, 337–360, 2022
344                                    M. D. K. Priestley and J. L. Catto: Future extratropical storm tracks and cyclones

Figure 5. As Fig. 4 but for cyclone minimum MSLP (hPa).

3.4     Cyclone wind speed                                       (Fig. S1 in the Supplement), due to the increased number of
                                                                 higher-resolution models used here (Table 1).
Figures 4 and 5 illustrate the difference in intensity mea-         The future response of the 850 hPa wind speeds in ex-
sures, with changes in the extremes more notable using fil-      treme cyclones is examined for each winter and summer sea-
tered vorticity as a metric and a larger shift in the whole      son in both hemispheres individually and for both a system
distribution when using MSLP. A dynamical approach to as-        and Earth relative perspective. Figure 6 presents the climate
sessing changes in extratropical cyclone strength is to anal-    change responses for NH DJF. In a system relative perspec-
yse changes in wind fields, as these are directly related to     tive a strengthening of the wind speeds is seen for all SSPs
cyclone impacts. For the composite analysis only the 10 %        (Fig. 6b–e). This strengthening is broadly contained between
strongest cyclones are examined as these are associated with     5 and 15◦ of the cyclone centre and is progressively larger for
the largest impacts and to ensure only similar cyclones are      the strongest climate change scenarios, with a peak increase
examined.                                                        of up to 0.7 m s−1 in SSPs 3-70 and 5-85. The strengthening
                                                                 is robust across most of the models, especially for SSPs 3-70
3.4.1    Lower troposphere                                       and 5-85 (Fig. 6d, e) and is concentrated on the forward and
                                                                 rearward flanks of the cyclone. The robust strengthening to
Recently, Priestley and Catto (2022) demonstrated that           the west of the cyclone centre in SSP5-85 is co-located with
CMIP6 models under-estimate the strength of the system rel-      the maximum wind speeds associated with the CCB and for-
ative circulation at 850 hPa by up to 2 m s−1 . This under-      mation of the low-level jet (Priestley and Catto, 2022). It is
estimation was identified on the poleward flanks of the cy-      evident from SSPs 2-45 and 3-70 (Fig. 6c, d) that there is
clone in the region where the cold conveyor belt (CCB)           also a strengthening on the SE edge of the cyclone in the
would be expected to be found. The models used in this anal-
ysis show similar biases, albeit slightly smaller in magnitude

Weather Clim. Dynam., 3, 337–360, 2022                                              https://doi.org/10.5194/wcd-3-337-2022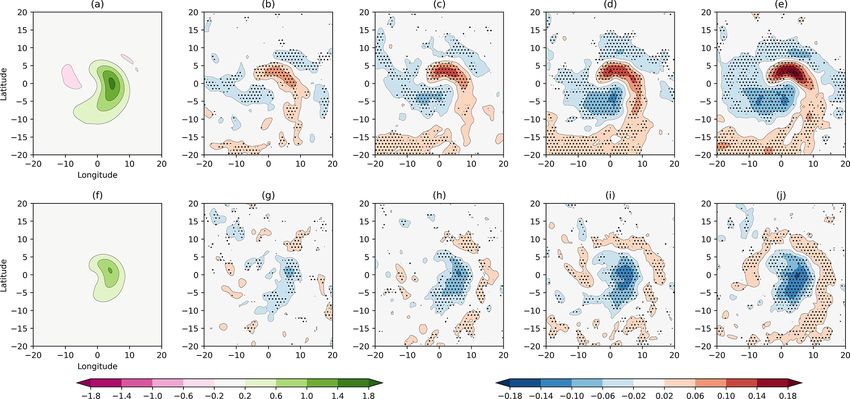
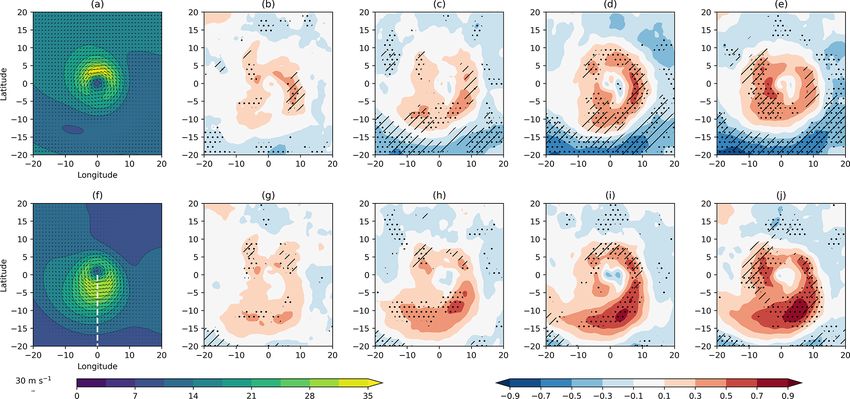
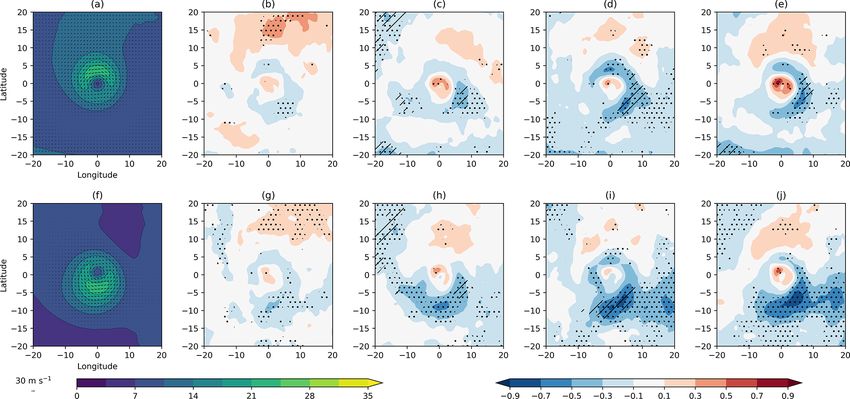
M. D. K. Priestley and J. L. Catto: Future extratropical storm tracks and cyclones                                                     345

Figure 6. Composites of wind speeds at 850 hPa associated with extreme cyclones in a system relative (a–e) and Earth relative (f–j) perspec-
tive for NH DJF. Composites are shown for the 1979–2014 CMIP6 historical average (a, f) and changes for the SSP1-26 (b, g), SSP2-45 (c, h),
SSP3-70 (d, i), and SSP5-85 (e, j) scenarios for the 2080–2100 period. Stippling indicates 80 % model consensus on the sign of the change,
and hatching shows where the model mean is larger than the model variance. Units are m s−1 . The dashed white line in (f) is the location of
the transect taken in Fig. 11.

warm sector, indicating possible changes associated with the            also become more robust across the models with larger cli-
inflow of the warm conveyor belt (WCB).                                 mate change. The reduction in wind speeds surrounding the
   In an Earth relative perspective (Fig. 6f–j) the progres-            core of the cyclone are likely a result of the reduced cyclone
sively stronger increase noted from Fig. 6b–e is also evi-              pressure gradient (not shown).
dent, with SSP5-85 having the greatest strengthening of the                In an Earth relative perspective (Fig. 8g–j), a similar pat-
wind speeds. From this perspective there is a notable in-               tern of the biases is seen as in the system relative perspective.
crease in strength on the southern and southeastern flanks of           However a further weakening is evident on the southeastern
the cyclones, which would be situated within the warm sec-              flank of the cyclone that is between 5 and 10◦ of the cyclone
tor of the cyclones. These anomalies are 10–15◦ away from               centre and is up to 0.9 m s−1 in SSP5-85 (Fig. 8j). This fur-
the cyclone centre and peak at up to 0.9 m s−1 for SSP5-85              ther weakening of the wind speeds suggests a decrease in cy-
(Fig. 6j). Despite differences between the Earth relative and           clone speed. This decrease is identifiable and is larger with
system relative wind speed changes, we find minimal differ-             increased rates of warming (Fig. 7b), although changes in the
ences in the propagation speed of the cyclones by the end of            median are only by ∼ 0.1 m s−1 . It is interesting that the re-
the century (Fig. 7a). In NH DJF there is considerable un-              sponse of cyclones in the NH is opposite in DJF and JJA,
certainty on the sign of the individual model response and              which is consistent with the changes in eddy kinetic energy
also non-linear responses across the experiments. The min-              and baroclinicity (O’Gorman, 2010; Lehmann et al., 2014).
imal change in propagation speed, coupled with a strength-                 The SH winter (JJA; Fig. 9) is consistent with NH winter
ening of system relative wind speeds, indicates a potential             (Fig. 6) in that a strengthening of the cyclone wind speeds is
increase in wind risk by the end of the century.                        seen. In a system relative perspective (Fig. 9a–e) a minimal
   In NH JJA (Fig. 8) in the very core of the cyclone a                 increase is seen for SSP1-26 (Fig. 9b). However, for the re-
strengthening of system relative winds of up to 0.9 m s−1 is            maining SSPs an increase is seen with the largest increases
seen for SSP5-85 (Fig. 8e), with a weakening identifiable               on the poleward flank of the cyclone centre (Fig. 9c–e). This
outside this between 5 and 10◦ of the cyclone centre of up              strengthening is located in a similar location to the underes-
to 0.7 m s−1 and may be associated with the CCB (Priest-                timation noted in the historical simulations relative to ERA5
ley and Catto, 2022). The weakening is concentrated on the              (Fig. S1 in the Supplement and Priestley and Catto, 2022),
forward flank of the cyclone, and for the more aggressive cli-          which is likely associated with the CCB. In SSPs 3-70 and 5-
mate change scenarios (Fig. 8d, e) in the warm sector. All              85 there is also a strengthening on the equatorward side of
anomalies are most notable for SSP2-45 and above, and they              the cyclone, associated with the stronger pressure gradients

https://doi.org/10.5194/wcd-3-337-2022                                                     Weather Clim. Dynam., 3, 337–360, 2022
346                                       M. D. K. Priestley and J. L. Catto: Future extratropical storm tracks and cyclones

Figure 7. Boxplots of cyclone propagation speed in the direction of cyclone motion. Boxplots are shown for (a) NH DJF, (b) NH JJA,
(c) SH DJF, and (d) SH JJA for the historical (black), SSP1-26 (red), SSP2-45 (blue), SSP3-70 (green), and SSP5-85 (purple) experiments.
The evaluated periods are 1979–2014 for the historical simulation and 2080–2100 for the different SSPs. The yellow lines in the boxes are
the median, and the boxes extend to the 25th and 75th percentiles. Whiskers extend to 1.5 times the inter-quartile range (IQR). Notches on
the boxes represent the 5 %–95 % confidence range on the median from 10 000 bootstrap re-samples. Speeds are calculated at the time of
maximum cyclone intensity. Units are m s−1 .

(not shown). Furthermore, the largest strengthening is gener-          There is strong model agreement on this change (unlike in
ally confined to within 4 and 8◦ of the cyclone centre, which          NH DJF), and increases are largest for SSP5-85.
is further away from the centre than the largest biases in the            As with the vorticity and MSLP distributions (Figs. 4
historical simulations, and also further away from the centre          and 5), the lower tropospheric wind speed response in the
than the strongest wind speeds in Fig. 9a), indicating a possi-        SH summer (Fig. 10) is consistent with the response from the
ble expansion of the wind field. The strength of the increase          winter for extreme cyclones (Fig. 9). In both a system rela-
is up to 1.8 m s−1 and is larger than in NH DJF in SSP5-85             tive and an Earth relative perspective the circulation strength-
(Fig. 9e).                                                             ens for the larger climate change scenarios, with minimal
   In an Earth relative perspective, the cyclones in SH JJA            changes identifiable in the SSP1-26 simulations (Fig. 10b, g).
(Fig. 9f–j) exhibit a large and robust strengthening on the            In the system relative perspective the wind speeds increase on
equatorward flank of the cyclone. Unlike in the system                 the poleward flank of the cyclone, with the largest change be-
relative perspective, the Earth relative anomalies get pro-            ing between 5 and 10◦ from the cyclone centre, which is out-
gressively stronger with each SSP, resulting in widespread             side the maximum from the historical simulations (Fig. 10a)
anomalies of over 1.8 m s−1 in SSP5-85 (Fig. 9j). Associated           and as in JJA is suggestive of an expansion of the circula-
with this, we identify a robust increase in the cyclone propa-         tion. The largest increase in system relative winds is by up
gation speed (Fig. 7d), with a median change of ∼ 0.6 m s−1 .          to 1.4 m s−1 for SSP5-85 conditions (Fig. 10e). As with all
                                                                       other seasons in both hemispheres, the change in wind speeds

Weather Clim. Dynam., 3, 337–360, 2022                                                      https://doi.org/10.5194/wcd-3-337-2022
M. D. K. Priestley and J. L. Catto: Future extratropical storm tracks and cyclones 347
Figure 8. As Fig. 6 but for NH JJA.
in the Earth relative perspective is concentrated on the equa- broadness, a transect of the circulation is taken on the equa-
torward flank of the cyclone for SH JJA (Fig. 10f–j). The torward side of the cyclone, from the cyclone centre to the
wind speed changes are larger for the stronger climate change edge of the composite area, thereby intersecting the region
scenarios and peak at up to 1.4 m s−1 under SSP5-85 condi- of maximum wind speeds (dashed white line Fig. 6f). The
tions (Fig. 10j). As with SH JJA, these increases demonstrate fraction of this transect above a fixed wind speed threshold
a change in the cyclone propagation speed, and we are able is calculated and plotted against the maximum wind speed
to identify an increase in propagation speed (Fig. 7c), albeit of the cyclone along the same transect. Wind speed thresh-
of smaller magnitude than SH JJA. olds have been chosen to best represent the footprint of the
It is notable from the lower tropospheric composites and historical composites.
propagation speeds (Figs. 6–10) that the responses of ex- For NH DJF (Fig. 11a) there are only small changes in
treme cyclones to climate change in the NH and SH summer maximum wind speed; however there are increases in the
seasons are again different, as they were in the vorticity and broadness of the area of above-threshold wind speeds, with
MSLP distributions (Figs. 4 and 5). This response is likely the peak of the distribution being ∼ 0.5◦ broader in the SSP5-
a result of the enhanced pressure gradients in the SH (not 85 experiment than in the historical period. Conversely, in
shown) and the persistent poleward shift of the storm tracks NH JJA (Fig. 11d) there is a considerable contraction of the
in the SH in both seasons (Fig. 3). This is a contrast to the area of above-threshold wind speeds by nearly 2◦ that is also
NH summer, whereby the storm tracks do not shift poleward, associated with a lower maximum wind speed. In the SH we
and instead a reduction in cyclonic activity is seen around find an expansion in the area of above-threshold wind speeds
the entire hemisphere (Fig. 2f–j). This is likely due to the in both DJF and JJA (Fig. S2). However, unlike in the NH,
larger polar amplification in the NH and reduction in lower this is also associated with a slight increase in the maximum
tropospheric baroclinicity across the hemisphere, which has wind speeds at 850 hPa.
a strong impact on the NH storm tracks and general circula- As the broadness of the circulation is increasing (in NH
tion (Coumou et al., 2015; Harvey et al., 2015). DJF), we can quantify the area of the cyclone above a fixed
threshold for the entire composite area and how this evolves
3.4.2 Cyclone extreme wind footprint for the different SSPs over time. Figure 12 shows time se-
ries of the winter and summer seasons in the NH and SH
For all seasons the largest 850 hPa Earth relative winds are for the area of the cyclone composite above a fixed thresh-
commonly found within 5◦ of the cyclone centre (Figs. 6– old of 17 m s−1 , encapsulating the area of strongest winds of
10). The largest future changes, however, are often found fur- the composite cyclones. The differing responses in the DJF
ther from the cyclone centre and can be 10–15◦ from the cy- and JJA in the NH are notable in Fig. 12a and b, with the
clone centre. For all seasons it is likely that there are changes SSPs showing an increase in cyclone area above 17 m s−1 ,
in how broad the circulation is. To quantify the change in the
https://doi.org/10.5194/wcd-3-337-2022 Weather Clim. Dynam., 3, 337–360, 2022348 M. D. K. Priestley and J. L. Catto: Future extratropical storm tracks and cyclones Figure 9. As Fig. 6 but for SH JJA. and a decrease in JJA, by the end of the century. The dif- emission SSPs demonstrate a marked increase in cyclone ferences between the SSPs are not overly large in the NH, area of above-threshold winds relative to the historical sim- with SSP5-85 showing a median increase of 7 % in above- ulations. In DJF (Fig. 12c) the SSP5-85 simulations have an threshold winds by 2100 in DJF, which is similar to SSP3- extreme wind speed area nearly 15 % larger by the end of 70 (Fig. 12a). However, increases may be as large as 15 % the century, which is also considerably above the 75th per- in SSP5-85 based on the large spread of model projections, centile from the historical simulations. The SSP3-70 simula- with almost half of the SSP3-70 and SSP5-85 estimations tion demonstrates around a 10 % increase by the end of the exceeding the historical 75th percentile in the final decade of century, which is comparable to the 75th percentile of the the 21st century. The SSP1-26 and SSP2-45 scenarios gener- historical simulations. Both the SSP5-85 and SSP3-70 sim- ally show lower increases in the area of above-threshold wind ulations are similar until around 2075, when the rate of in- speeds with median increases of 2 %–3 % by the end of the crease in cyclone area levels off in SSP3-70. Accounting for century. All the SSPs show a very similar average evolution the spread in the model simulations by the end of the cen- until 2080 of a 2.5 %–5 % size increase, with the two most tury indicates increases may be as large as 20 %–25 % rel- aggressive SSPs only separating from the two weakest SSPs ative to the historical average, with a majority of the SSP3- after ∼ 2085. Interestingly, the SSP2-45 scenario indicates a 70 and SSP5-85 distributions being above the historical 75th decline after 2075, which is in line with modelled reductions percentile. The SSP2-45 experiment is very similar to SSP3- in CO2 emissions toward the end of the 21st century in that 70 until 2070; however the average area increase is lower at SSP (O’Neill et al., 2016). Despite the differences in scenar- only 5 % above the historical average by the end of the cen- ios, all of the SSPs in Fig. 12a have a median extreme wind tury. The SSP1-26 experiment demonstrates the smallest by speed area lower than the 75th percentile from the historical the end of the century, which is within the range of the 75th simulations by 2100. In JJA all SSPs are very similar and percentile and less than a 5 % increase in area compared to generally show up to a 10 % reduction in the area of above- the historical simulations. The SSP1-26 simulation actually threshold winds throughout the century. Generally, SSP5-85 increases until approximately 2070, when it closely matches and SSP3-70 show the largest reduction, which may be as the SSP2-45 and SSP3-70 scenarios, with a decline then fol- large as 25 %–30 %. Despite this, the inter-annual variabil- lowing, before levelling off by approximately 2085. By the ity is especially large for all SSPs, and each has considerable end of the century the spread in the SSP1-26 simulations is overlap with a large amount of the historical distribution of very similar to that of the historical cyclone area. cyclone area. In SH JJA (Fig. 12d) a similar evolution to DJF (Fig. 12c) In the SH a larger signal, with greater differences between is notable, albeit with a larger signal in the SSP5-85 and the SSPs, is identifiable for the area of above-threshold cy- SSP3-70 scenarios. Both SSPs demonstrate large increases clone winds (Fig. 12c, d). For both DJF and JJA the higher- in cyclone area above the threshold wind speed compared to Weather Clim. Dynam., 3, 337–360, 2022 https://doi.org/10.5194/wcd-3-337-2022
M. D. K. Priestley and J. L. Catto: Future extratropical storm tracks and cyclones                                             349

Figure 10. As Fig. 6 but for SH DJF.

SSP2-45 and SSP1-26 and show an increase in an average             j) perspective. In the system relative perspective there is first
area increase of at least 20 % by the end of the century. From     of all a strengthening of the wind speeds on the poleward
2090–2100 a majority of the distribution in both SSPs ex-          flank of the cyclone centre that is ∼ 5◦ away from the cen-
ceeds the 75th percentile of the historical simulations, and the   tre. This is a region where winds are travelling from east to
75th percentile of the SSP5-85 scenario estimations is 35 %–       west (Fig. 13a). This element of the circulation in the mid-
40 % larger than the historical average. For both these SSPs       troposphere is likely associated with the upper reaches of the
the cyclone area demonstrates a steady increase from 2040,         CCB (Priestley and Catto, 2022), and this may indicate a
by which all experiments already show an increase in size of       strengthening of this airstream, which is robust across a ma-
5 %–10 % above the historical average. Neither SSP2-45 nor         jority of the models.
SSP1-26 shows a marked increase from 2040–2100. SSP2-                 The other notable difference in the system relative winds
45 maintains an average of approximately 10 % increase in          is situated within the warm sector of the cyclones. For all
cyclone area by 2100, whereas SSP1-26 shows a very slight          SSPs there is evidence of a strengthening of the winds, which
decrease to an average of a 5 % increase in size by 2100. The      is progressively stronger with the more aggressive climate
clearer signal in the SH and greater separation in the SSPs        change scenarios and by up to 1 m s −1 in SSP5-85 (Fig. 13e).
is (as mentioned previously) likely due to the reduced land        This increase is located between 5 and 10◦ of the cyclone
influence in the SH allowing for a more robust response to         centre on the equatorward and eastern flanks. These regions
the evolving climate forcings. In fact, the evolution of the       are associated with the strongest ascent (Catto et al., 2010;
cyclone size above the 17 m s−1 wind speed threshold bears         Priestley and Catto, 2022), which therefore indicates a pos-
considerable similarity to the evolution in CO2 concentration      sible strengthening of the WCB. A large amount of the
noted in the ScenarioMIP experimental design (O’Neill et al.,      strengthening in the warm sector is due to an increase in
2016; Fig. 3b).                                                    the meridional component of the wind by over 1.8 m s−1 to
                                                                   the east and southeast of the cyclone centre (Fig. S6). This
3.4.3   Middle troposphere                                         stronger warm sector motion may, in part, be driven by in-
                                                                   creased atmospheric moisture content under future climate
The middle troposphere is defined as 500 hPa in this analysis.     conditions, which will result in larger condensational heating
In the interest of brevity, only the NH DJF changes will be        in ascending branches of cyclones and potentially increased
discussed in detail, with changes from other seasons avail-        rates of ascent.
able in the Supplement (Figs. S3–S5) and discussed briefly            One final feature to note across all the SSPs in the system
at the end of this section.                                        relative framework is the weakening of the circulation on the
   In NH DJF (Fig. 12) the spatial patterns of change across       rearward (western) flank of the cyclone between 5 and 15◦ of
the models presents a similar pattern across all SSPs in both a    the cyclone centre. This region is behind the cold front and
system relative (Fig. 13b–e) and an Earth relative (Fig. 13g–

https://doi.org/10.5194/wcd-3-337-2022                                               Weather Clim. Dynam., 3, 337–360, 2022
350 M. D. K. Priestley and J. L. Catto: Future extratropical storm tracks and cyclones Figure 11. Scatter plot of maximum wind speed along the cyclone transect (dashed white line Fig. 6f) against the broadness of wind speeds above a fixed threshold along the same transect plotted via a Gaussian kernel density estimator (KDE). KDEs are plotted for the historical (black, 1979–2014) and SSP5-85 experiments (orange, 2080–2100) for the NH in (a–c) DJF and (d–f) JJA for (a, d) 850 hPa, (b, e) 500 hPa, and (c, f) 250 hPa. Crosses indicate the highest frequency of the KDE. Thresholds for the broadness of the circulation are (a, d) 17 m s−1 , (b) 25 m s−1 , (c) 35 m s−1 , (e) 20 m s−1 , and (f) 25 m s−1 . generally is associated with the descent of drier air (Catto In the NH JJA (Fig. S3) and both SH seasons (Figs. S4– et al., 2010; Priestley and Catto, 2022). This weakening sug- S5) the pattern of change is broadly consistent with NH DJF gests that the descent rate may be weaker under future cli- (Fig. 13), but with magnitudes and sign that are consistent mates, which will again be exacerbated with larger levels of with the biases noted at 850 hPa (Figs. 8–10). For NH JJA climate change. (Fig. S5) there is weakening of the wind speeds in the warm In the Earth relative perspective (Fig. 13g–j) a very simi- sector of the cyclones, which is progressively larger for the lar picture is presented as in the system relative perspective more aggressive SSPs. Furthermore, the broadness of the ex- (Fig. 13b–e). The main difference is the increased strength of treme wind speeds also decreases (Fig. 11e). In the SH the re- the changes in the warm sector in the Earth relative perspec- sponses in both seasons are very similar (Figs. S4–S5), unlike tive, which is also slightly broader than in the system relative in the NH. Both SH seasons feature a pronounced strength- perspective. In Fig. 11b it can be seen that, as at 850 hPa, the ening of the wind speeds in the warm sector, with the largest area of extreme wind speeds becomes considerably broader. anomalies being between 5 and 15◦ of the cyclone centre on However, unlike at 850 hPa the maximum wind speed also the equatorward and forward flanks of the cyclone. increases at this level. This may be due to a larger role of Both SH seasons also show a strengthening of the wind moist processes in the mid-troposphere; however projected speeds on the poleward flank of the cyclone in the system rel- increases in the strength of the upper-level jet (Harvey et al., ative framework, at a distance of approximately 5–7◦ , which 2020) may also have an influence at this level. Weather Clim. Dynam., 3, 337–360, 2022 https://doi.org/10.5194/wcd-3-337-2022
M. D. K. Priestley and J. L. Catto: Future extratropical storm tracks and cyclones                                                      351

Figure 12. Evolution of cyclone area with Earth relative wind speeds at 850 hPa exceeding 17 m s−1 from 2040–2100 for SSP1-26 (red),
SSP2-45 (cyan), SSP3-70 (green), and SSP5-85 (purple). Time series are the multi-model means and are shown for NH DJF (a), NH JJA (b),
SH DJF (c), and SH JJA (d). The thick black line refers to the 1979–2014 seasonal average from the historical simulation, with the grey lines
being the 25th and 75th percentiles respectively. A cyclone area of 1 is the average area for the 1979–2014 period. Scenario time series have
been smoothed using a 5-year moving average. Boxplots show the distribution of yearly averaged cyclones areas for each experiment from
2090–2100 (scenarios) and 1979–2014 (historical). The yellow lines indicating the median and boxes extend to the inter-quartile range.

is likely associated with the strengthening of the CCB noted             with the slantwise ascending motion in the warm sector. This
earlier.                                                                 strengthening is associated with large increases in meridional
                                                                         motion (Fig. S6) and together with the results at 500 hPa sug-
3.4.4   Upper troposphere                                                gests that the WCB in cyclones is likely to be stronger and
                                                                         progressively so with increased warming rates by the end of
As in the previous section, only the changes for NH DJF                  the century.
(Fig. 14) will be discussed in detail due to the similar re-                The third change at 250 hPa is an increase in wind speeds
sponses of the other seasons and magnitude that is consistent            on the forward flank of the cyclone between 10 and 20◦ of
with anomalies at the other tropospheric levels. Changes for             the cyclone centre and extending in a southerly and south-
the other seasons are present in Figs. S7–S9.                            westerly direction. The strengthening is mostly driven by a
   The changes in the wind speeds at 250 hPa in NH DJF can               more negative meridional component of the wind (Fig. S6e),
be broadly split into three distinct features in the system rel-         which is associated with the anticyclonic turning of air and
ative perspective (Fig. 14a–e). Firstly, 10–20◦ to the south-            likely part of the WCB outflow. It is likely that the changes
west of the cyclone there is an increase in the wind speeds,             in this sector of the cyclone are associated with those closer
which is larger for the strongest SSPs. This is likely associ-           to the cyclone centre.
ated with a strengthening/broadening of the upper-level jet                 All these anomalies are largest for SSP5-85 (Fig. 14e)
(Fig. 11c). Secondly, there is an increase in the wind speeds            with strong model agreement across the SSPs, indicating
by up to 2.1 m s−1 to the south, east, and northeast of the              that the warmer climate, which is characterized by a higher
cyclone centre that is ∼ 5◦ from the cyclone centre and ro-              moisture content in the future, results in a stronger wind
tating cyclonically around it. This is the region of largest as-         speeds in the warm sector and anticyclonic turning near/at
cent and divergence (Fig. 15a) and the region where models               the tropopause. The forcing of these changes is likely to be
struggle to capture the strength of the wind speeds in his-              somewhat driven by changing rates of vertical motion in the
torical simulations (Priestley and Catto, 2022). This increase           cyclone, which can be inferred from the rate of horizontal
is situated above and slightly downstream of a similar in-               divergence at 250 hPa (Fig. 15). There are increases in diver-
crease at 500 hPa (Fig. 13b–e) and therefore likely associated

https://doi.org/10.5194/wcd-3-337-2022                                                      Weather Clim. Dynam., 3, 337–360, 2022
352 M. D. K. Priestley and J. L. Catto: Future extratropical storm tracks and cyclones
Figure 13. As Fig. 6 but for 500 hPa.
gence in the warm sector, with the largest increases down- wind shows a marked increase to less negative values (weak-
stream and poleward of the maximum in the historical sim- ening, Fig. S6j) to the southeast of the cyclone, indicating a
ulations (Fig. 15e), indicating stronger ascent in the warm consistent (yet opposite) behaviour to the change in NH DJF.
sector of the cyclones and larger outflow near the tropopause. Furthermore, there is a considerable weakening of the diver-
Furthermore, there is a smaller increase in convergence be- gence (Fig. 15j), suggesting that the rate of vertical motion
hind the cold front, suggesting that the descending motion in the cyclones will be weaker.
within the cyclones, which often originates near this level, In the SH both seasons (Figs. S8 and S9) are very consis-
does not undergo changes as large as in the ascending branch. tent with NH DJF in that strengthening wind speeds associ-
Therefore, the asymmetry in the vertical velocity within ex- ated with both the cyclonic and anticyclonic motions within
tratropical cyclones may increase. the composite area are identifiable, with both only becom-
In an Earth relative perspective (Fig. 14f–j) a major- ing evident for SSP2-45 and above. For both seasons in the
ity of the features noted in the system relative perspective SH and for NH JJA, the changes are largest in magnitude for
(Fig. 14a–e) are also notable and consistent in their magni- SSP5-85 and progressively lower for each SSP below. All of
tude and positioning. As at other levels an increase in the the major changes are robust across the model ensemble and
strength of change, particularly on the equatorward flank of represent a clear picture as to how cyclones will change as a
the cyclones, is notable, which is a result of the increasing result of future climatic change.
speed of cyclones in the future. As in the lower and middle For all levels in the troposphere the cyclones in the SH
troposphere, a considerable broadening of the circulation is only start to show a consistent signal and pattern of change
also identifiable at 250 hPa (Fig. 11c) alongside an increase for SSP2-45 and above, whereas the pattern of the anomalies
in the maximum speed to the south of the cyclones. in the NH is usually evident (although often small in magni-
Composites for the changes in the 250 hPa wind speeds tude) even for SSP1-26.
for the NH JJA (Fig. S7) and also for DJF and JJA in the SH
(Figs. S8 and S9) are now discussed briefly. For these other 3.5 Sensitivity of change to cyclone intensity
seasons a majority of the same features identified for NH DJF
(Fig. 14) are seen, with magnitudes of changes that are con- We have already shown that extreme cyclones increase in
sistent with the same season in the middle and lower tropo- intensity for relative vorticity and MSLP (decrease in NH
sphere. In NH JJA a weakening of the wind speeds is again JJA; Figs. 4 and 5). However, it is only for MSLP that an
identifiable throughout the warm sector of the cyclone. Due increase in intensity of moderate strength cyclones is also
to the considerably weaker nature of the wind in NH JJA, seen (Fig. 5). To assess how cyclones from different parts of
the separate changes associated with the anticyclonic motion the intensity distribution are changing dynamically, 850 hPa
are harder to identify. However, the meridional component of wind speeds from cyclones that pass over the North Atlantic
(30–70◦ N, 280–360◦ E) are examined.
Weather Clim. Dynam., 3, 337–360, 2022 https://doi.org/10.5194/wcd-3-337-2022You can also read