Long-term variation in aerosol lidar ratio in Shanghai based on Raman lidar measurements - Recent
←
→
Page content transcription
If your browser does not render page correctly, please read the page content below
Atmos. Chem. Phys., 21, 5377–5391, 2021
https://doi.org/10.5194/acp-21-5377-2021
© Author(s) 2021. This work is distributed under
the Creative Commons Attribution 4.0 License.

Long-term variation in aerosol lidar ratio in Shanghai based on
Raman lidar measurements
Tongqiang Liu1 , Qianshan He2,3 , Yonghang Chen1 , Jie Liu2 , Qiong Liu1,4 , Wei Gao2 , Guan Huang1 , Wenhao Shi1 ,
and Xiaohong Yu5
1 College of Environmental Science and Engineering, Donghua University, Shanghai, 201620, China
2 Shanghai Meteorological Service, Shanghai, 201199, China
3 Shanghai Key Laboratory of Meteorology and Health, Shanghai, 201199, China
4 Shanghai Institute of Pollution Control and Ecological Security, Shanghai, 200092, China
5 Shanxi Institute of Meteorological Sciences, Taiyuan, 030000, China

Correspondence: Qianshan He (oxeye75@163.com) and Yonghang Chen (yonghangchen@dhu.edu.cn)

Received: 6 November 2020 – Discussion started: 14 November 2020
Revised: 27 February 2021 – Accepted: 2 March 2021 – Published: 7 April 2021

Abstract. Accurate lidar ratio (LR) and better understand-         1   Introduction
ing of its variation characteristics can not only improve the
retrieval accuracy of parameters from elastic lidar, but also      Aerosols in the atmosphere can affect the earth’s climate
play an important role in assessing the impacts of aerosols        by absorbing and scattering solar radiation (direct effect of
on climate. Using the observational data of a Raman lidar          aerosols) (Huang et al., 2014; Wang et al., 2013) or acting
in Shanghai from 2017 to 2019, LRs at 355 nm were re-              as cloud condensation nuclei, which can affect cloud physi-
trieved and their variations and influence factors were ana-       cal properties and precipitation (indirect effect of aerosols)
lyzed. Within the height range of 0.5–5 km, about 90 % of          (Huang et al., 2006; Liu et al., 2019a, b; Yan and Wang,
the LRs were distributed in 10–80 sr with an average value         2020). In general, the vertical distribution information of
of 41.0 ± 22.5 sr, and the LR decreased with the increase in       aerosols is required to improve our understanding of aerosol
height. The volume depolarization ratio (δ) was positively         climate effects (Ferrare et al., 2001; Sicard et al., 2011). For
correlated with LR, and it also decreased with the increase        example, Wang et al. (2020b) found that dust-forced radia-
in height, indicating that the vertical distribution of particle   tive heating decreased significantly as the transport height of
shape was one of the influence factors of the variations in        dust aerosols decreased. A study by Lu et al. (2020) showed
LR with height. LR had a strong dependence on the orig-            that anomalous elevated aerosol layers above 2 km led to
inal source of air masses. Affected by the aerosols trans-         warming in the upper atmosphere (+0.32 K/d) and cooling
ported from the northwest, the average LR was the largest,         on the surface (−0.04 K/d). In addition, the results of Liu et
44.2 ± 24.7 sr, accompanied by the most irregular particle         al. (2019b) showed that the aerosols mixing with the cloud
shape. The vertical distribution of LR was affected by atmo-       layer in the vertical direction can significantly reduce the ef-
spheric turbidity, with the greater gradient of LR under clean     fective radius of ice particles and prolong the life of clouds.
conditions. The LR above 1 km could be more than 80 sr,               As an active remote-sensing instrument, the elastic scat-
when Shanghai was affected by biomass burning aerosols.            tering lidar can obtain vertical distribution information of
                                                                   aerosols; however, it is necessary to assume an aerosol
                                                                   extinction-to-backscattering ratio (i.e., lidar ratio, LR) in the
                                                                   retrieval process (Fernald, 1984; Welton et al., 2001), which
                                                                   can result in significant errors for the extinction coefficient,
                                                                   followed by aerosol optical depth (AOD). To our knowl-
                                                                   edge, the LRs at 355, 532, and 1064 nm are usually as-
                                                                   sumed to be 50 sr in China (Fan et al., 2018; Gong et al.,

Published by Copernicus Publications on behalf of the European Geosciences Union.
5378                                                       T. Liu et al.: Long-term variation in aerosol lidar ratio in Shanghai

2015; Lv et al., 2020; Ma et al., 2019). In addition, CALIOP            A large number of observations and analysis of LR have
(Cloud-Aerosol Lidar with Orthogonal Polarization) onboard           been carried out based on Raman lidar all over the world.
CALIPSO (Cloud-Aerosol Lidar Infrared Pathfinder Satel-              Since the establishment of the European Aerosol Research
lite Observations) can observe the vertical distribution of          Lidar Network (EARLINET) in 2000, long time series obser-
global aerosol optical properties, and its data products have        vation data of vertical distribution and LR for various types
been widely used around the world (Kim et al., 2018). The            of aerosol have been obtained on the European continent
CALIOP algorithm first determines the type of aerosol ac-            (Müller et al., 2007; Wandinger et al., 2016). In South Ko-
cording to the aerosol classification algorithm and then uses        rea and Japan, the LR of Asian dust and biomass burning
lookup table of multiple types of aerosol to determine the LR        aerosols has also been studied based on Raman lidar (Mu-
(Kim et al., 2018; Omar et al., 2009). Therefore, the quality        rayama et al., 2004; Noh et al., 2007, 2008). The LR ob-
of the CALIOP aerosol products depends on the accuracy of            served around the world usually shows different values due to
aerosol type identification and the consistency between ac-          different types of aerosols. However, long-term observations
tual LR and that in the lookup table (Painemal et al., 2019).        and research of LR in China are limited (Wang et al., 2016)
LR is a complicated function of time and space, which de-            due to the limitation of observation instruments. In particu-
pends on aerosol size distribution and particle composition          lar, the observations and studies of LR are still rare in east
(Reagan et al., 1988). LR is also affected by meteorologi-           China; however, range-resolved LR profiles based on inde-
cal elements (Salemink et al., 1984), such as relative humid-        pendent measurement on a regional scale are very important.
ity (RH), which can change the aerosol particle size distri-         On one hand, the range-resolved LR obtained from ground-
bution and refractive index (Young et al., 1993). Therefore,         based Raman lidar can not only be used for comparison with
good knowledge of accurate LR and its variation character-           355 nm LR obtained from ATLID (Atmospheric LIDar) on
istics can not only improve the retrieval accuracy of parame-        EarthCARE (Earth Clouds and Radiation Explorer) planned
ters from elastic lidar, but also obtain information on aerosol      to be launched by ESA (European Space Agency) (Liu et al.,
types to trace the source of pollutants (Franke et al., 2001).       2020a; Nicolae et al., 2018), but can also provide a reliable
   According to the definition of LR in Müller’s (2003) study,       basis for the inversion hypothesis of elastic lidar in Shang-
                                                                     hai and surrounding areas and improve product reliability for
        4π
LR =           .                                              (1)    elastic lidar networks such as the Asian dust and aerosol lidar
       ωP (π )                                                       observation network. On the other hand, vertical distribution
LR was negatively correlated with phase function at 180◦             of aerosol absorption properties reflected by LR can be used
(P (π )) and single-scattering albedo (ω). P (π ) is related to      as an input parameter for regional climate models (Mehta et
the sphericity of particles, and the sphericity information of       al., 2018), which can further improve the calculation accu-
particles can be obtained from polarization lidar. ω is indica-      racy of radiative forcing.
tive of aerosol absorption properties. The aerosol absorption           In addition, studying the influence factors of LR in Shang-
properties and their vertical distributions play a crucial role in   hai can be conducive to understanding the LR variation char-
evaluating direct radiative forcing of aerosols (McComiskey          acteristics and determining the source of pollutants. With
et al., 2008; Zarzycki and Bond, 2010). Moreover, absorbing          these motivations, the vertical and temporal variations in LR
aerosols increase atmospheric stability by reducing the solar        and its influence factors in Shanghai were analyzed using the
radiation reaching the surface during the day. By contrast,          results retrieved from Raman lidar, which laid a solid foun-
absorbing aerosols on the near-surface layer heat the surface        dation for the quantitative study of pollution and its causes in
and increase the atmospheric instability during night (Jacob-        the future.
son, 1998; Jacobson and Kaufman, 2006). The vertical pro-
file of LR can reflect vertical variation in aerosol absorption
properties, which can provide a basis for studying aerosol ra-       2     Data and methods
diative forcing and causes of pollution (Mishchenko et al.,
2004).                                                               2.1     Observation equipment and data
   LR can be obtained by a variety of methods, such as high-
spectrum-resolution lidar (HSRL), Raman lidar, and joint re-         2.1.1    Raman depolarization lidar
trieval using sun photometer and elastic lidar (Zhao et al.,
2018). Raman lidar can independently retrieve the extinction         The Raman depolarization lidar (Raymetrics S.A., Athens,
coefficient and backscatter coefficient of aerosols and obtain       Greece, model LR231-D300) used in this study is deployed
LR by combining elastic backscatter and Raman backscat-              on the roof of a building (31.1916◦ N, 121.4333◦ E; 67 m
ter signals (Ansmann et al., 1992), which is the most widely         above sea level, a.s.l.) in downtown Shanghai. The site is
used independent measurement method at present. Moreover,            35 km from the East China Sea coastline, surrounded by pop-
the LR measured by Raman lidar is a useful index to study            ulated residential and commercial areas. The laser of the li-
the variations in aerosol physical properties (Ferrare et al.,       dar system is an Nd: YAG pulse laser equipped with a water
2001).                                                               cooling device. The system can emit 355, 532, and 1064 nm

Atmos. Chem. Phys., 21, 5377–5391, 2021                                                https://doi.org/10.5194/acp-21-5377-2021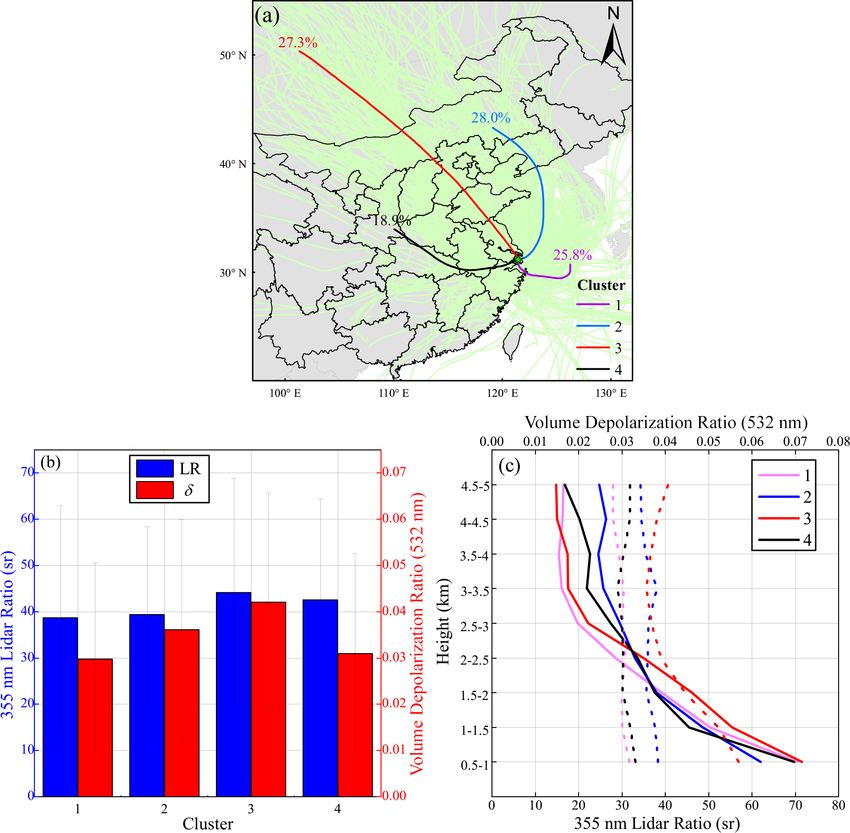
T. Liu et al.: Long-term variation in aerosol lidar ratio in Shanghai                                                          5379

laser pulses with a pulse width of 5.4 ns and a repetition rate
of 20 Hz. The lidar detection system can receive 355, 532,
and 1064 nm elastic scattering signals. The 532 nm elastic
scattering channel has two polarization channels: 532P (par-
allel) and 532S (perpendicular). In addition, the lidar can also
receive the vibrational Raman scattering signals of nitrogen
(387 nm) and water vapor molecules (408 nm) with an in-
cident wavelength of 355 nm. Therefore, 355 nm LRs were
obtained and discussed in this study. The transient recorder
can detect signals in two modes: analog and photon count-
ing. The analog mode is suitable for detecting strong sig-         Figure 1. Effective observation hours per month from 2017 to 2019.
nals at low altitude, and the photon-counting mode is suit-
able for detecting weak signals at high altitude. In order to
better combine the advantages of the two modes to retrieve         ancy between the ERA-Interim and radiosonde was within
aerosol optical properties, it is necessary to glue signals of     10 % below 500 hPa. Song et al. (2020) found that the root
the two modes together (Newsom et al., 2009; Walker et al.,        mean square error (RMSE) of ERA5 RH was 3.85 % com-
2014). The range resolution of the raw signal is 7.5 m, and        pared with the RH profile of the radiosonde. The above re-
the temporal resolutions are 1 min (before 25 January 2019)        sults show that RH from reanalysis data has good accuracy,
and 2 min (after 25 January 2019). Unless otherwise stated,        and it has been widely used in various research fields (Sajadi
the time in the paper was UTC (universal time coordinated).        et al., 2020; Tzanis et al., 2019; Xiao et al., 2020). The RH
                                                                   data of ERA5 used in this paper were divided into 37 layers
2.1.2   HYSPLIT-4                                                  vertically (1–1000 hPa). The temporal resolution was 1 h and
                                                                   the spatial resolution was 0.125◦ × 0.125◦ . In order to ensure
HYSPLIT-4 (Hybrid Single Particle Lagrangian Integrated
                                                                   the spatial consistency, the RH data (31.25◦ N, 121.375◦ E)
Trajectory Model, Version 4) is a professional model jointly
                                                                   closest to the location of the Raman lidar were used.
developed by the National Oceanic and Atmospheric Admin-
istration (NOAA) and the Australian Bureau of Meteorology
                                                                   2.2   Lidar data processing
for calculating and analyzing transport and diffusion trajec-
tories of atmospheric pollutants and has been widely used in       Original signals need to be pre-processed before retrieval,
many studies around the world (Huang et al., 2012; Noh et          including background subtraction, photon-counting signal
al., 2007). It supports the input of a variety of meteorological   dead-time correction, signal gluing, and overlap correction
data, and meteorological reanalysis data provided by NOAA          (D’Amico et al., 2016). The calculation of the glue coeffi-
were used in this study.                                           cients in this study used the methods proposed by Newsom
                                                                   et al. (2009). In order to reduce the influences of lidar incom-
2.1.3   MERRA-2
                                                                   pletely overlapping detection areas on retrieved results, only
MERRA-2 (The Modern-Era Retrospective Analysis for Re-             signals in the complete overlap area were used for retrieval.
search and Applications, Version 2) is an atmospheric reanal-      In addition, affected by the location altitude of the Raman li-
ysis dataset provided by the National Aeronautics and Space        dar and the least square method used in the retrieval process,
Administration (NASA) and the Global Modeling and As-              the lowest height of LR obtained by the Raman method was
similation Office (GMAO) (Gelaro et al., 2017). The aerosol        569.5 m (a.s.l.). Since the Raman lidar used in this study can
optical property data used in this study were derived from         detect the Raman scattering signal of 387 nm nitrogen and
the 1 h average product of the MERRA-2 tavg1_2d_aer_Nx             signal-to-noise ratios of Raman signals in daytime are much
dataset and CO column concentration from the MERRA-2               lower than that in the nighttime, the 355 nm LR at night can
tavg1_2d_chm_Nx. The spatial resolution of the two datasets        be obtained through retrieval. The retrieval results of raw sig-
was 0.625◦ × 0.5◦ . During data processing, the 24 h data of       nals were counted by hour, and the hours with more than 15
each day were averaged to obtain daily average data.               minutes of retrieval results were regarded as effective obser-
                                                                   vation hours. The retrieval results within the effective obser-
2.1.4   ERA5                                                       vation hours were averaged to obtain hourly average data.
                                                                   During the observation period, data of 667 effective observa-
ERA5 is a global atmospheric reanalysis dataset provided by        tion hours were obtained through retrieval and statistics. The
the European Centre for Medium-range Weather Forecast-             monthly distribution is shown in Fig. 1.
ing (ECMWF) (Zhao et al., 2020). In recent years, some                Previous studies indicated that there are some sources of
studies have evaluated the accuracy of reanalysis data pro-        errors in the retrieval. The relative errors of particle extinc-
vided by the ECMWF based on radiosonde data. For exam-             tion coefficients caused by assumed air density profile are
ple, Luo et al. (2020) found that the average RH discrep-          1.5 % (Masonis, 2002), and the relative errors of particle

https://doi.org/10.5194/acp-21-5377-2021                                            Atmos. Chem. Phys., 21, 5377–5391, 2021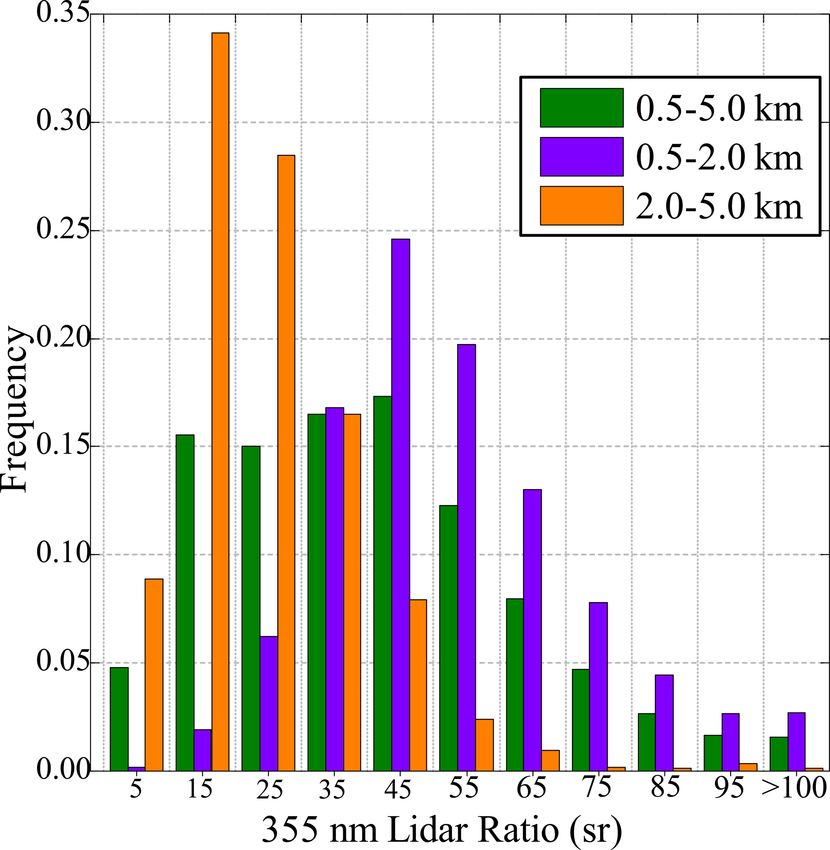
5380 T. Liu et al.: Long-term variation in aerosol lidar ratio in Shanghai
backscatter coefficients caused by reference height can be of aerosol led to small differences in LR at different height
10 % (Ansmann et al., 1992). The mean deviations of particle ranges.
extinction coefficients caused by signal detection are within Figure 3 shows the frequency distribution of LR for dif-
15 % in the 350–2000 m height range and within 20 % in the ferent altitude ranges. Overall, LRs were widely distributed
3000–4000 m height range (Pappalardo et al., 2004). The dif- in the altitude range of 0.5–5 km. In most cases (about 90 %)
ference is caused by different signal-to-noise ratios at low al- LR ranged from 10 to 80 sr with the highest frequency of
titude and high altitude. Due to the low signal-to-noise ratio, 17.3 % between 40 and 50 sr. It should be noted that the
there were usually more missing values at high altitudes. number of observations trailed off at larger LR and the fre-
quency of abnormally large LR (>90 sr) was about 4 %. LR
also had a wide distribution range within 0.5–2 km, and the
3 Results and discussions frequency of 40–50 sr was the highest (24.6 %), which was
similar to the range of 0.5–5 km. Large LRs (>60 sr) were
3.1 LR temporal and vertical variations mainly distributed in the range of 0.5–2.0 km, suggesting that
aerosols in this height range had a strong absorbing ability.
3.1.1 Variation in the averaged LR Although there were a few large LRs (>60 sr) above 2 km,
LRs were mainly distributed between 0–40 sr with the high-
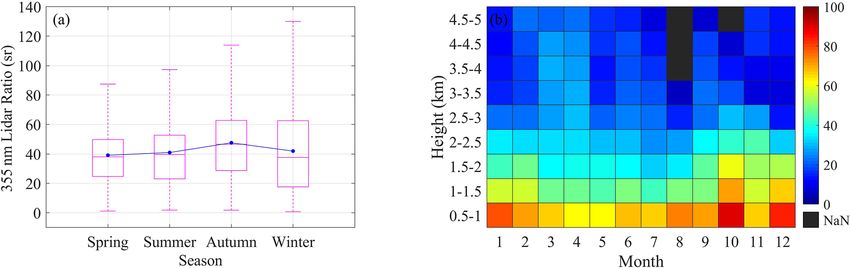
Figure 2a shows the averaged LR profile for 667 h. Because est frequency of 34 % between 10 and 20 sr.
of the variability of aerosol particle size and microphysical
properties with height (Singh et al., 2005), the averaged LR 3.1.2 Temporal variations in LR
was characterized by large variability, ranging from 17 to
82 sr. LR reached a maximum at the height of 600 m and de- Figure 4a presents seasonal variation in LR over Shanghai
creased with the increase in height. The averaged LR in the during the observation period. The seasonal average LR was
height range of 0.5–5 km was 41.0 ± 22.5 sr, and it was rela- the largest in autumn with 47.6 ± 25.1 sr and the lowest in
tively small (24.8 ± 13.7 sr) above 2 km. These discrepancies spring with 39.1 ± 19.6 sr. Generally, the LR of aerosol par-
were in good agreement with the results, which were mostly ticles with stronger absorption ability is larger (Müller et al.,
less than 25 sr in the altitude range of 2 km to 3 km, that Hee 2007). Black carbon (BC) has a strong ability to absorb visi-
et al. (2016) found. LR depends on the aerosol size distri- ble light (Chow et al., 2009), and aerosols rich in BC tend to
bution and refractive index (Takamura et al., 1994; Young et show a larger LR, such as biomass burning aerosols (Gian-
al., 1993). The small LR may be caused by the shape effect of nakaki et al., 2016). Smoke produced by the burning of crop
aerosol particles (not obviously nonspherical) and relatively residues during the harvest season in autumn often affects
low absorption efficiency (Tesche et al., 2007). Shanghai (Xu et al., 2018). According to the results found
In order to investigate the variations in LR at different al- by Wang et al. (2014), the BC concentration in Shanghai was
titude ranges, Fig. 2b presents the averaged LR for differ- the lowest in spring and higher in autumn and winter. It indi-
ent altitude ranges. The averaged LR from 0.5 to 1 km was cated that the aerosol absorption ability in spring was weaker
68.2 ± 19.5 sr, which was in good agreement with the 355 nm compared with that in autumn and winter.
LR in Oklahoma, USA, observed by Ferrare et al. (2001). The statistics of the averaged LR for a different height
The mean values of LR were between 40 sr and 50 sr in the range in each month were shown in Fig. 4b. LR for all months
altitude range of 1–2 km, and mean values of LR were usu- decreased with the increase in altitude. The averaged LR be-
ally less than 40 sr above 2 km, which was related to low low 2 km was the largest in October, which was attributed
aerosol concentration and the low absorption efficiency of to smoke aerosols produced by biomass burning in the sur-
aerosols (Hänel et al., 2012; Hee et al., 2016). Furthermore, rounding cities and rural areas during the harvest season (Nie
the slope of LR for the different height ranges as shown in et al., 2015). In view of LR vertical variations in different
Fig. 2b also gradually decreased with the increased height. months, aerosols with LR > 40 sr were confined to within
Below 3 km, LR decreased rapidly with the increase in alti- 1.5 km from March to August, while in the other months
tude, and the largest slope was −17.83 below 1.5 km. The it was 2 km, especially in October and November (within
reason for that was that temperature inversion in the low 2.5 km). This revealed the point that the diffusion heights
layer of the planetary boundary layer (PBL) at night weak- of aerosols with absorbing properties were characterized by
ened the vertical movement of the atmosphere and inhibited strong seasonality. In spring and summer, the diffusion height
the diffusion of pollutants emitted by human activities such of absorbing aerosols was lower; by contrast, it was higher in
as vehicles and fossil fuel combustion. The accumulation of autumn and winter. The discrepancies in the seasonal height
pollutants in the low layer of the PBL resulted in signifi- distribution of aerosols can be attributed to the monsoon cli-
cant differences in aerosol vertical distribution and rapidly mate (He et al., 2006; Liu et al., 2020b; Wang et al., 2016).
decreased aerosol extinction coefficients in the PBL (Liu et Shanghai, in the southeast of China, was affected by the
al., 2017; Wang et al., 2020a). However, above 3 km, the low subtropical monsoon climate, and the prevailing winds were
aerosol concentration and homogeneous vertical distribution southeast and northwest in spring and southeast in summer
Atmos. Chem. Phys., 21, 5377–5391, 2021 https://doi.org/10.5194/acp-21-5377-2021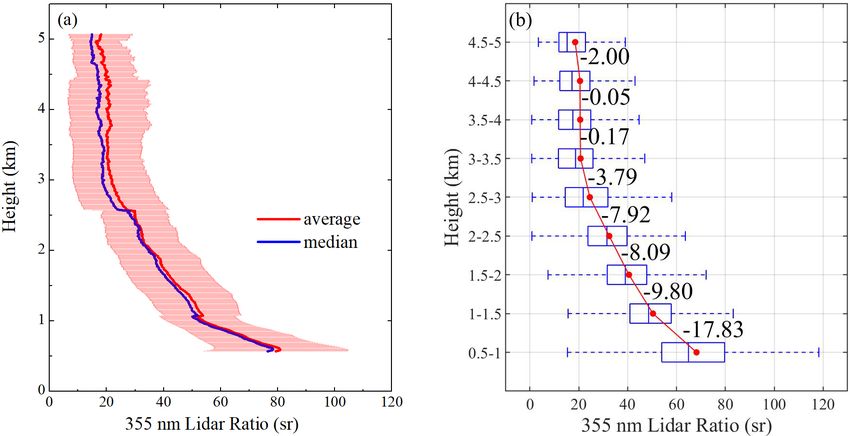
T. Liu et al.: Long-term variation in aerosol lidar ratio in Shanghai 5381
Figure 2. General variation in LR. (a) Averaged profile of LR. The red line is the averaged profile, the blue line is the median profile, and the
red shadow is the error bar, indicating the standard deviation. (b) Averaged LR in different altitude ranges. The red line is the line of average
values at different heights. The numbers between two points are the slopes between the two points.
Liu et al. (2012) reported that vast majority of aerosol par-
ticles in the Yangtze Delta region (including Shanghai) were
below 2 km. In order to precisely analyze the variation char-
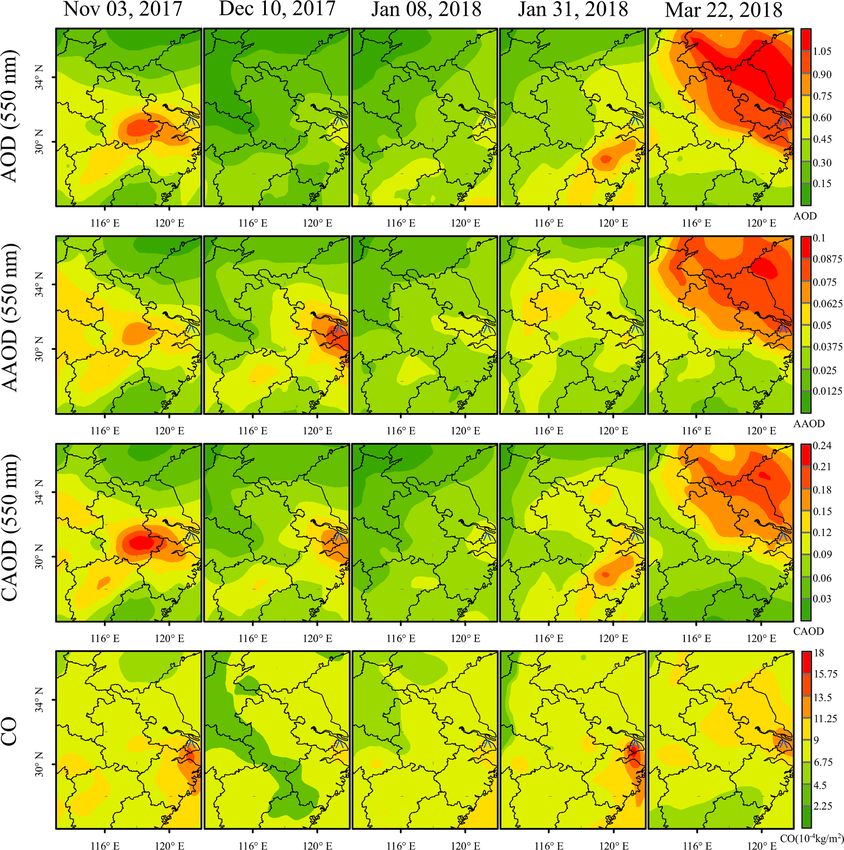
acteristics of the LR in Shanghai, Fig. 5 shows LRs of 667 ef-
fective observation hours below 2 km. The abnormally large
LRs (>80 sr) were usually distributed in the PBL, meaning
that local emissions were the main source of strongly absorb-
ing aerosols. From the figure, one can also conclude that the
number of larger LRs within the PBL followed a decreasing
trend with the passage of observation time, alluding to grad-
ually reduced emissions of absorbing aerosols in Shanghai.
The reduction was in good agreement with the reductions
of BC and particulate matter (PM) concentrations caused by
a series of energy-saving and emission-reduction measures
such as the Shanghai Clean Air Action Plan (2018–2022) im-
plemented by the Shanghai government in recent years (Wei
et al., 2020).
Figure 3. LR frequency distribution. 3.2 Analysis of influence factors of LR
3.2.1 Reasons for LR variation with height
From Eq. (1), we found that LR was negatively correlated
(Cai et al., 2010). Clean air from the sea could reduce air with P (π ), and the nonspherical geometry of particles can
pollution to a large extent by diluting pollutant concentra- cause a reduction in the P (π ) (Müller, 2003). δ can re-
tion (Wang et al., 2014). In particular, in March and April the flect the regularity of particle shape (Novitsky and Philbrick,
LR above 2.5 km was higher than that in the other months, 2005) and is defined as the ratio of vertical backscatter co-
which may be due to the influence of dust aerosols brought efficient and parallel backscatter coefficient (Behrendt and
by the prevailing northwest wind in spring. Liu et al. (2020b) Nakamura, 2002). The smaller value of δ is, the closer the
pointed out that dust aerosols from Inner Mongolia and the particle shape is to spherical (Gobbi, 1998). Since the Ra-
Gobi desert had a high frequency in spring at the altitude man depolarization lidar used in this study can detect the
of 3–5 km in Shanghai. The prevailing winds in autumn and 532 nm polarization signals, 532 nm δ was used to analyze
winter were northeast and northwest, respectively. Absorbing the sphericity of particles. It can be seen from Fig. 6a that
aerosols originating from north China resulted in relatively LR was proportional to δ with a correlation coefficient of
large LRs at high altitude in Shanghai. 0.86, which was consistent with Reagan’s (1988) study that
https://doi.org/10.5194/acp-21-5377-2021 Atmos. Chem. Phys., 21, 5377–5391, 2021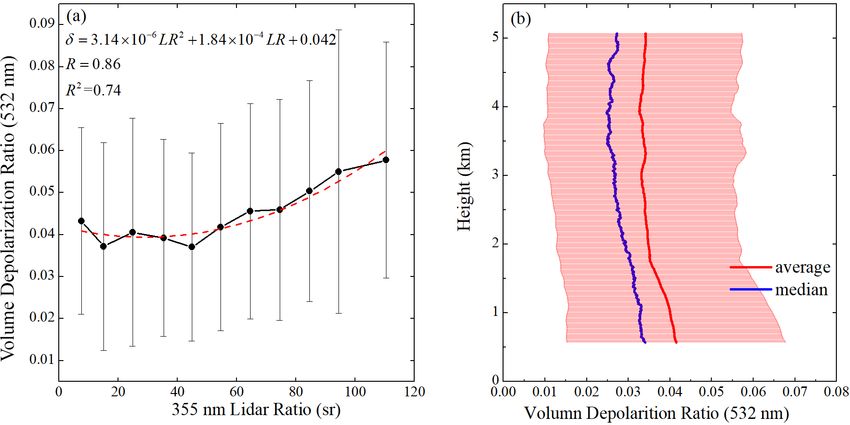
5382                                                       T. Liu et al.: Long-term variation in aerosol lidar ratio in Shanghai

Figure 4. LR temporal variations. (a) Seasonal variations in LR. The blue dots are the average for each season. (b) The average of LR at
different altitudes in different months. The black areas indicate an invalid value.

                                                                      became more regular with the increase in height. The result
                                                                      evidenced the inference by Tesche et al. (2007) that the reg-
                                                                      ular particle shape was one of the reasons for the smaller LR
                                                                      at high altitudes.

                                                                      3.2.2   Influences of aerosol sources on LR

                                                                      In order to further understand the influences of wind direc-
                                                                      tions on LR and its vertical distribution, a cluster analysis
                                                                      of back trajectories was used to study the transport of atmo-
Figure 5. The averaged LR of effective observation hours. The         spheric aerosols. Based on the HYSPLIT-4 model (Franke et
white areas indicate invalid values.                                  al., 2001; Noh et al., 2007), the 72 h backward trajectories
                                                                      at the height of 1000 m were shown in Fig. 7a. The cluster
                                                                      analysis resulted in four main air mass directions (Hänel et
LR increased with the increase in particle asphericity. LR is         al., 2012; Pietruczuk and Podgorski, 2009). Backward trajec-
the ratio of the extinction coefficient and the backscatter co-       tory cluster analysis based on the HYSPLIT model is widely
efficient. Therefore, there are two reasons for the increase          used in atmospheric aerosol research (Wang et al., 2020a; Xu
in LR with the increasing particle asphericity. On one hand,          et al., 2018; Zhang et al., 2020). We performed a significance
the backscatter coefficient decreases significantly with the in-      test on the cluster analysis results, and the one-way ANOVA
crease in particle asphericity; on the other hand, the extinc-        showed that P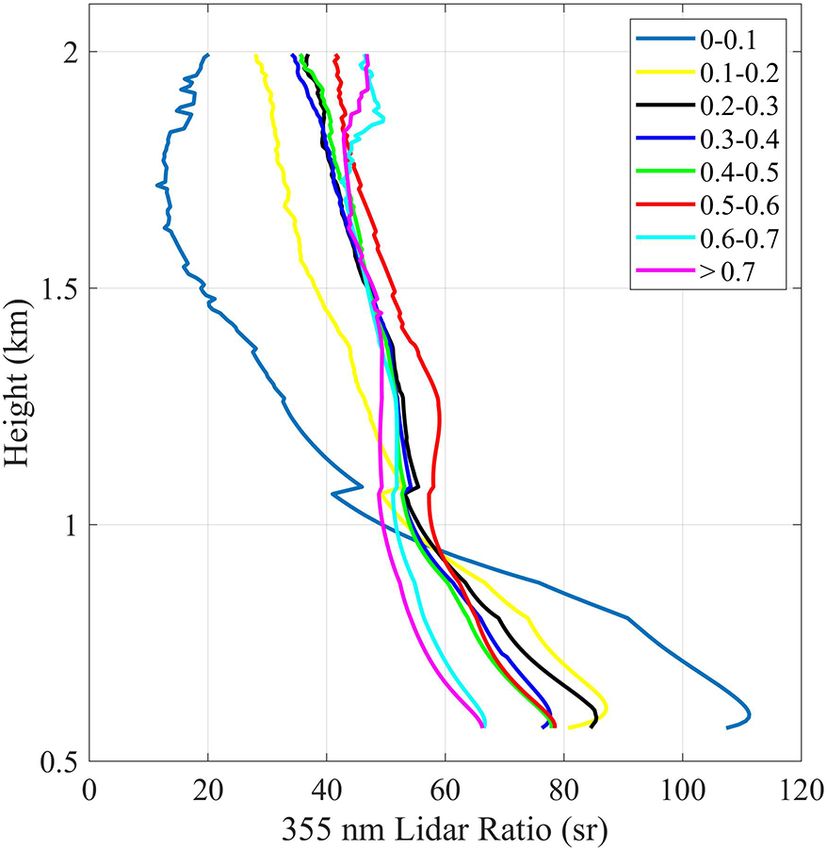
T. Liu et al.: Long-term variation in aerosol lidar ratio in Shanghai                                                                      5383

Figure 6. Effect of δ on LR. (a) LR was divided into 11 intervals and the mean value of δ in each interval was calculated. The dot and error
bar represent the mean and standard deviation of δ in each interval. The red dotted line is the fitting line of LR and δ. (b) The red line is the
mean profile of δ, the blue line is the median profile of δ, and the red shadow is the error bar, meaning the standard deviation.

Figure 7. (a) Seventy-two-hour back trajectory cluster analysis. (b) Mean values of LR and δ corresponding to different air masses. (c) The
average of LR and δ at different heights corresponding to different air masses; the solid line is LR, and the dotted line is δ.

https://doi.org/10.5194/acp-21-5377-2021                                                      Atmos. Chem. Phys., 21, 5377–5391, 2021
5384                                                     T. Liu et al.: Long-term variation in aerosol lidar ratio in Shanghai

   The averaged LR affected by the aerosols brought by air         cause of pollution (Mishchenko et al., 2004). The LR verti-
mass 2 was approximately equivalent to the LR affected by          cal variation under different atmospheric turbidity has rarely
air mass 1, with an averaged value of 39.4 ± 19 sr at 0.5–         been discussed; however, previous studies have analyzed the
5 km altitude. The source region of air mass 2 was located in      vertical profiles of LR in different pollution degree cases and
Inner Mongolia, which could bring dust aerosols. During the        their main concern was the averaged LR of the aerosol layer
transport over the ocean, clean marine aerosols mixed with         (Chen et al., 2014; Wang et al., 2016). AOD is an important
dust aerosols led to LRs larger than that of the clean marine      parameter to characterize aerosol optical properties, which
aerosols.                                                          can reflect aerosol content in the atmosphere and is also an
   The averaged LR of air mass 3 was 44.2 ± 24.7 sr, the           important index to evaluate atmospheric quality and visibility
largest in the four clusters. As air mass 3 passed through the     (Cheng et al., 2015; Hess et al., 1998; Qi et al., 2013). Previ-
northern Chinese region where pollution levels and pollutant       ous studies have shown a positive correlation between AOD
amounts were relatively high, aerosol particles brought by         and LR by analyzing averaged LR for different AOD ranges
the air mass had a strong absorbing ability. In addition, it was   (Ferrare et al., 2001; He et al., 2006) due to the increase in
evident that δ corresponding to air mass 3 below 2.5 km was        aerosol absorption and extinction caused by the increase in
larger than that of the other three air masses in Fig. 7c. The     small particles (Takamura et al., 1994).
larger δ hinted at a high contribution of irregularly shaped          AOD was obtained by integrating 355 nm extinction coef-
aerosol particles. Air mass 3 passing through dust source ar-      ficients in the range of 0.5–2 km. The averaged profile of LR
eas of Mongolia and Inner Mongolia could bring abundant            below 2 km in different AOD ranges was drawn as shown in
dust aerosols to Shanghai (Huang et al., 2012). Dust aerosols      Fig. 8. Under clean conditions, LR decreased more dramat-
usually show larger particle depolarization ratios than other      ically with the increase in height. By contrast, the lack of
types of aerosols due to their irregular particle shape (Fu et     significant vertical variability of LR under high atmospheric-
al., 2009; Kai et al., 2008; Murayama et al., 1999). For ex-       turbidity conditions reflected the homogeneous vertical dis-
ample, Huang et al. (2012) found that the aerosol 532 nm           tribution of absorbing aerosols. The result that the vertical
depolarization ratio in the case of dust pollution was signif-     slope of LR presented a decreasing trend with increasing at-
icantly greater than that in the cases of secondary inorganic      mospheric turbidity can be explained by aerosol radiative ef-
pollution and biomass burning pollution. As a consequence,         fects on thermal structure and atmospheric stability. Under
the larger δ corresponding to air mass 3 was attributed to         high atmospheric-turbidity conditions, aerosol particles that
dust aerosols, and long-range-transported dust aerosols could      absorb a large amount of solar radiation during the day ra-
reach a height of about 2.5 km.                                    diatively warm the surface at night but radiatively cool the
   The averaged LR affected by aerosols from air mass 4 was        air above the surface (Jacobson and Kaufman, 2006; Ra-
42.6 ± 21.8 sr. It should be noted that the averaged δ affected    manathan et al., 2005). The decrease in the atmosphere sta-
by aerosols brought by air mass 4 was small, which was             bility due to the temperature difference increases vertical
comparable to that of air mass 1, indicating a high contri-        turbulence and results in the homogeneous vertical distribu-
bution of spherical aerosol particles, but LR was larger. By       tion of aerosols. By contrast, in the clear and pollution-free
observing the trajectory of air mass 4, we found that it passed    nights, the surface radiation cooling results in temperature
through Hubei Province with a high industrial level (Wang          inversion near the ground. The stable atmosphere is not con-
et al., 2016) and Anhui Province with heavy pollution from         ducive to the lifting of absorbing aerosols, resulting in a sig-
biomass burning (Wu et al., 2020). The industrial and smoke        nificant vertical variation in LR.
aerosols accompanying air mass 4 were approximately spher-
ical (Giannakaki et al., 2016; Müller et al., 2007) and could      3.3   The main aerosol types causing the abnormal
be responsible for the smaller δ.                                        variation in LR
   In summary, the variations and vertical distributions of LR
and δ in Shanghai were caused by the synthetic impacts of          As shown in Fig. 5, abnormally large LR occurred occa-
long-range transport from different source areas and local         sionally in relatively high locations approximately above
emissions. Large LR and δ were the results of smoke and            the top of PBL in spite of a usual decay trend in LR
dust aerosols from the northwest. And the mixing of aerosols       with height. To investigate the reasons, we selected 5 d
from the sea and locally emitted absorbing aerosols resulted       with LR > 80 sr over 1 km. According to previous reports,
in a smaller δ and slightly larger LR than that of clean marine    biomass burning aerosols are relatively small and spherical,
aerosols.                                                          and their strong absorption ability makes them have a large
                                                                   LR (Papagiannopoulos et al., 2018). For example, Amiridis
3.2.3   Influence of atmospheric turbidity on LR                   et al. (2009) observed smoke plumes from biomass burn-
                                                                   ing over Greece and found that the 355 nm LR ranged from
As mentioned previously, the vertical variations in absorbing      40 to 100 sr. Giannakaki et al. (2016) used a Raman lidar
aerosols and their influence factors played an important role      in South Africa and found that the 355 nm LR of biomass
in evaluating the aerosol radiation effect and studying the        burning aerosols was 92 ± 10 sr. Generally, the determina-

Atmos. Chem. Phys., 21, 5377–5391, 2021                                              https://doi.org/10.5194/acp-21-5377-2021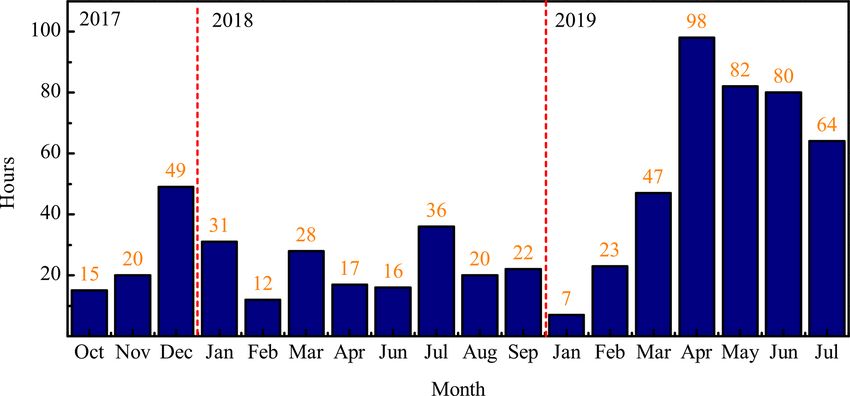
T. Liu et al.: Long-term variation in aerosol lidar ratio in Shanghai                                                         5385

                                                                     presence of absorbing aerosols and carbon aerosols in Shang-
                                                                     hai (Shaik et al., 2019). Additionally, the CO column con-
                                                                     centrations in Shanghai for these 5 d were relatively high, all
                                                                     more than 9 × 10⁻⁴ kg/m2 , which reflected significant possi-
                                                                     bility of smoke advection. Therefore, it could be inferred that
                                                                     Shanghai was affected by biomass burning aerosols from lo-
                                                                     cal rural areas or surrounding provinces in the five cases.
                                                                        Although the abnormally large LR above 1 km was mainly
                                                                     relevant for the advection of biomass burning aerosols, it
                                                                     should be noted that the increasing aerosol extinction caused
                                                                     by the increase in RH could also result in large LR (Salemink
                                                                     et al., 1984). For example, Ackerman (1998) found that the
                                                                     LR of continental aerosols increased from 40 to 80 sr with
                                                                     RH. Figure 10 presents LR and RH profiles for three cases
                                                                     and shows that LR was a function of RH. The abnormally
                                                                     large LRs above 1 km had a good corresponding relationship
                                                                     with high RH, which demonstrated that the abnormally larger
                                                                     LRs were also related to high RH.
Figure 8. LR profiles in different AOD intervals.

                                                                     4   Conclusions
tion of aerosol type with a large LR observed by Raman li-
                                                                     For the first time, a long-term (2017–2019) observation based
dar was based on fire data and backward trajectory models
                                                                     on Raman lidar was carried out in Shanghai. The aerosol
such as HYSPLIT (Hee et al., 2016; Noh et al., 2008). In our
                                                                     355 nm LR was retrieved, and the variations in LR and their
study, the spatial distribution of biomass burning tracers was
                                                                     influence factors were analyzed. In the height range of 0.5–
used to determine whether the abnormally large LRs were re-
                                                                     5 km, about 90 % of LRs were distributed in 10–80 sr, with an
lated to biomass burning aerosols (Huang et al., 2012), which
                                                                     average of 41.0 ± 22.5 sr, and LR decreased with the increase
could lay the foundation for future research on aerosol three-
                                                                     in height. The averaged LR in autumn was the largest, which
dimensional spatial distribution and pollution causes.
                                                                     was 47.6 ± 25.1 sr. The averaged LRs in summer and win-
   Biomass burning is one of the important sources of PM,
                                                                     ter were close (41.0 ± 21.6 and 42.0 ± 27.3 sr, respectively),
organic carbon (OC) and BC in the atmosphere (Wu et al.,
                                                                     and the averaged LR in spring was the smallest. The sea-
2020). It also emits pollutant gases such as CO, SO2 , NOx ,
                                                                     sonal variation in LR was closely related to the seasonal vari-
and HCN (Andreae and Merlet, 2001; Kalluri et al., 2020;
                                                                     ations in BC concentration. In the height range of 0.5–2 km,
Randel et al., 2010). CO can be used as a tracer for biomass
                                                                     the monthly average LR was the largest in October, which
burning. For example, Huang et al. (2012) found that CO col-
                                                                     was related to biomass burning aerosols produced by burn-
umn concentration in the biomass burning zone was signifi-
                                                                     ing straw in the surrounding areas during the harvest season.
cantly different from that in the non-biomass burning zone.
                                                                     In addition, affected by the prevailing winds in spring and
In addition, biomass burning would also result in high AOD
                                                                     summer, the aerosols with LRs > 40 sr were confined within
and AAOD (absorbing aerosol optical depth) in the region
                                                                     1.5 km from March to August.
due to strong absorption of biomass burning aerosols (Shaik
                                                                        LR and δ were positively correlated, meaning that the
et al., 2019). For example, He et al. (2015) found that 500 nm
                                                                     more regular the particle shape is, the smaller the LR is. δ
AOD increased from 0.73 to 1.00 when analyzing the smoke
                                                                     decreased with the increase in height, which proved that par-
plume of biomass burning in Shanghai. Similarly, Vadrevu
                                                                     ticle shape was one of the factors affecting the vertical dis-
et al. (2011) found that the AOD of the wheat stalks burn-
                                                                     tribution of LR. LR had a strong dependence on the source
ing season and the rice stalk burning season were both high
                                                                     directions of air masses. Large LR coincided with the air
by using satellite data in India: 0.598 and 0.58, respectively.
                                                                     masses from the northwest, while the air masses from the
CAOD is the optical depth of black carbon aerosols and or-
                                                                     east led to small LR. In addition, the shape of aerosol par-
ganic carbon aerosols. Hence, 550 nm AOD, AAOD, CAOD,
                                                                     ticles was the most irregular due to aerosols brought by air
and CO column concentrations were used as tracers to deter-
                                                                     masses from the northwest. The vertical distribution of LR
mine whether these five cases were affected by biomass burn-
                                                                     was affected by atmospheric turbidity, and the slope of LR
ing. Figure 9 depicts the spatial distribution of four tracers for
                                                                     vertical variation decreased with the increase in AOD.
the five cases. AOD in Shanghai during these 5 d ranged from
0.45 to 1.05, pointing to heavy aerosol pollution. The average
value of AAOD was between 0.0375 and 0.1, and CAOD was
between 0.12 and 0.24, which reasonably demonstrated the

https://doi.org/10.5194/acp-21-5377-2021                                              Atmos. Chem. Phys., 21, 5377–5391, 2021
5386 T. Liu et al.: Long-term variation in aerosol lidar ratio in Shanghai
Figure 9. Spatial distribution of AOD, AAOD, CAOD, and CO column concentrations in five cases. From left to right, different cases are
represented, and from top to bottom, different tracers are represented. The blue star is the location of the Raman lidar.
Shanghai were related to biomass burning aerosols. In addi-
tion, the large LRs above 1 km could be also related to high
RH.
Data availability. The data presented in this paper are available
from the corresponding authors upon request.
Author contributions. TL retrieved the data and wrote the paper.
QH and YC formulated the project goals and edited and reviewed
the paper. JL, QL, and WG downloaded and analyzed the reanalysis
data. GH, WS, and XY revised the paper.
Figure 10. RH and LR profiles in three cases: (a) 8 December 2017, Competing interests. The authors declare that they have no conflict
20:00; (b) 17 March 2018, 16:00; (c) 23 September 2018, 20:00. of interest.
We analyzed the spatial distribution of 500 nm AOD, Acknowledgements. We are grateful to NASA for providing
MERRA-2 data and the NOAA Air Resources Laboratory (ARL)
AAOD, CAOD, and CO column concentrations of five cases
for the provision of the HYSPLIT transport and dispersion model.
with LRs > 80 sr and found that large LRs above 1 km in
Atmos. Chem. Phys., 21, 5377–5391, 2021 https://doi.org/10.5194/acp-21-5377-2021T. Liu et al.: Long-term variation in aerosol lidar ratio in Shanghai 5387
We also gratefully acknowledge the ECMWF for the provision of mospheres over Shanghai, Atmos. Environ., 123, 315–326,
the ERA5 dataset. https://doi.org/10.1016/j.atmosenv.2015.05.029, 2015.
Chow, J. C., Watson, J. G., Doraiswamy, P., Chen, L.-W. A., Sode-
man, D. A., Lowenthal, D. H., Park, K., Arnott, W. P., and Mo-
Financial support. This research has been supported by the Na- tallebi, N.: Aerosol light absorption, black carbon, and elemental
tional Key R&D Program of China (grant no. 2016YFC0201900), carbon at the Fresno Supersite, California, Atmos. Res., 93, 874–
the National Natural Science Foundation of China (grant nos. 887, https://doi.org/10.1016/j.atmosres.2009.04.010, 2009.
41975029, 91637101, and 91644211), the Science Research D’Amico, G., Amodeo, A., Mattis, I., Freudenthaler, V., and Pap-
Project of Shanghai Meteorological Service (grant no. MS202016), palardo, G.: EARLINET Single Calculus Chain – technical – Part
the Chinese Ministry of Science and Technology (grant no. 1: Pre-processing of raw lidar data, Atmos. Meas. Tech., 9, 491–
2018YFC1506305), and the Fundamental Research Funds for the 507, https://doi.org/10.5194/amt-9-491-2016, 2016.
Central Universities (grant no. 2232019D3-27). Fan, S., Liu, C., Xie, Z., Dong, Y., Hu, Q., Fan, G., Chen, Z.,
Zhang, T., Duan, J., Zhang, P., and Liu, J.: Scanning verti-
cal distributions of typical aerosols along the Yangtze River
Review statement. This paper was edited by Jianping Huang and using elastic lidar, Sci. Total Environ., 628/629, 631–641,
reviewed by two anonymous referees. https://doi.org/10.1016/j.scitotenv.2018.02.099, 2018.
Fernald, F. G.: Analysis of atmospheric lidar observations: some
comments, OSA Proc., 23, 652–653, 1984.
Ferrare, R. A., Turner, D. D., Brasseur, L. H., Feltz, W. F.,
References Dubovik, O., and Tooman, T. P.: Raman lidar measurements
of the aerosol extinction-to-backscatter ratio over the South-
Ackermann, J.: The extinction-to-backscatter ratio of tropo- ern Great Plains, J. Geophys. Res.-Atmos., 106, 20333–20347,
spheric aerosol: A numerical study, J. Atmos. Ocean. https://doi.org/10.1029/2000jd000144, 2001.
Tech., 15, 1043–1050, https://doi.org/10.1175/1520- Franke, K., Ansmann, A., Muller, D., Althausen, D., Wagner, A.,
0426(1998)0152.0.Co;2, 1998. and Scheele, R.: One-year observations of particle lidar ratio over
Alexander, S. P. and Protat, A.: Vertical Profiling of Aerosols the tropical Indian Ocean with Raman lidar, Geophys. Res. Lett.,
With a Combined Raman-Elastic Backscatter Lidar in the Re- 28, 4559–4562, https://doi.org/10.1029/2001gl013671, 2001.
mote Southern Ocean Marine Boundary Layer (43–66◦ S, Fu, Q., Thorsen, T. J., Su, J., Ge, J. M., and Huang, J. P.: Test of Mie-
132–150◦ E), J. Geophys. Res.-Atmos., 124, 12107–12125, based single-scattering properties of non-spherical dust aerosols
https://doi.org/10.1029/2019jd030628, 2019. in radiative flux calculations, J. Quant. Spectrosc. Ra., 110,
Amiridis, V., Balis, D. S., Giannakaki, E., Stohl, A., Kazadzis, S., 1640–1653, https://doi.org/10.1016/j.jqsrt.2009.03.010, 2009.
Koukouli, M. E., and Zanis, P.: Optical characteristics of biomass Gelaro, R., McCarty, W., Suarez, M. J., Todling, R., Molod, A.,
burning aerosols over Southeastern Europe determined from UV- Takacs, L., Randles, C., Darmenov, A., Bosilovich, M. G., Re-
Raman lidar measurements, Atmos. Chem. Phys., 9, 2431–2440, ichle, R., Wargan, K., Coy, L., Cullather, R., Draper, C., Akella,
https://doi.org/10.5194/acp-9-2431-2009, 2009. S., Buchard, V., Conaty, A., da Silva, A., Gu, W., Kim, G. K.,
Andreae, M. O. and Merlet, P.: Emission of trace gases and aerosols Koster, R., Lucchesi, R., Merkova, D., Nielsen, J. E., Partyka,
from biomass burning, Global Biogeochem. Cy., 15, 955–966, G., Pawson, S., Putman, W., Rienecker, M., Schubert, S. D.,
https://doi.org/10.1029/2000gb001382, 2001. Sienkiewicz, M., and Zhao, B.: The Modern-Era Retrospective
Ansmann, A., Riebesell, M., Wandinger, U., Weitkamp, C., Voss, Analysis for Research and Applications, Version 2 (MERRA-2),
E., Lahmann, W., and Michaelis, W.: Combined Raman Elastic- J. Climate, 30, 5419–5454, https://doi.org/10.1175/JCLI-D-16-
Backscatter Lidar for Vertical Profiling of Moisture, Aerosol Ex- 0758.1, 2017.
tinction, Backscatter, and Lidar Ratio, Appl. Phys. B, 55, 18–28, Giannakaki, E., van Zyl, P. G., Müller, D., Balis, D., and Komppula,
https://doi.org/10.1007/Bf00348608, 1992. M.: Optical and microphysical characterization of aerosol layers
Behrendt, A. and Nakamura, T.: Calculation of the cali- over South Africa by means of multi-wavelength depolarization
bration constant of polarization lidar and its dependency and Raman lidar measurements, Atmos. Chem. Phys., 16, 8109–
on atmospheric temperature, Opt. Express, 10, 805–817, 8123, https://doi.org/10.5194/acp-16-8109-2016, 2016.
https://doi.org/10.1364/oe.10.000805, 2002. Gobbi, G. P.: Polarization lidar returns from aerosols and thin
Cai, C., Geng, F., Tie, X., Yu, Q., and An, J.: Charac- clouds: a framework for the analysis, Appl. Opt., 37, 5505–5508,
teristics and source apportionment of VOCs measured https://doi.org/10.1364/ao.37.005505, 1998.
in Shanghai, China, Atmos. Environ., 44, 5005–5014, Gong, W., Liu, B., Ma, Y., and Zhang, M.: Mie LIDAR Obser-
https://doi.org/10.1016/j.atmosenv.2010.07.059, 2010. vations of Tropospheric Aerosol over Wuhan, Atmosphere, 6,
Chen, Z., Liu, W., Heese, B., Althausen, D., Baars, H., Cheng, T., 1129–1140, https://doi.org/10.3390/atmos6081129, 2015.
Shu, X., and Zhang, T.: Aerosol optical properties observed by Hänel, A., Baars, H., Althausen, D., Ansmann, A., Engelmann,
combined Raman-elastic backscatter lidar in winter 2009 in Pearl R., and Sun, J. Y.: One-year aerosol profiling with EUCAARI
River Delta, south China, J. Geophys. Res.-Atmos., 119, 2496– Raman lidar at Shangdianzi GAW station: Beijing plume and
2510, https://doi.org/10.1002/2013jd020200, 2014. seasonal variations, J. Geophys. Res.-Atmos., 117, D13201,
Cheng, T., Xu, C., Duan, J., Wang, Y., Leng, C., Tao, J., https://doi.org/10.1029/2012jd017577, 2012.
Che, H., He, Q., Wu, Y., Zhang, R., Li, X., Chen, J., He, Q., Zhao, X., Lu, J., Zhou, G., Yang, H., Gao, W., Yu, W.,
Kong, L., and Yu, X.: Seasonal variation and difference and Cheng, T.: Impacts of biomass-burning on aerosol properties
of aerosol optical properties in columnar and surface at-
https://doi.org/10.5194/acp-21-5377-2021 Atmos. Chem. Phys., 21, 5377–5391, 20215388 T. Liu et al.: Long-term variation in aerosol lidar ratio in Shanghai
of a severe haze event over Shanghai, Particuology, 20, 52–60, mos. Meas. Tech., 11, 6107–6135, https://doi.org/10.5194/amt-
https://doi.org/10.1016/j.partic.2014.11.004, 2015. 11-6107-2018, 2018.
He, Q. S., Li, C. C., Mao, J. T., Lau, A. K. H., and Li, P. R.: A study Liu, D., Kanitz, T., Ciapponi, A., Mondello, A., D’Ottavi, A., Ma-
on the aerosol extinction-to-backscatter ratio with combination teo, A. B., Straume, A.-G., Voland, C., Bon, D., Checa, E., Al-
of micro-pulse LIDAR and MODIS over Hong Kong, Atmos. varez, E., Bellucci, I., Do Carmo, J. P., Brewster, J., Marshall,
Chem. Phys., 6, 3243–3256, https://doi.org/10.5194/acp-6-3243- J., Schillinger, M., Hannington, M., Rennie, M., Reitebuch, O.,
2006, 2006. Lecrenier, O., Bravetti, P., Sacchieri, V., De Sanctis, V., Lefeb-
Hee, W. S., Lim, H. S., Jafri, M. Z. M., Lolli, S., and vre, A., Parrinello, T., Wernham, D., Wang, Y., Wu, Y., Gross,
Ying, K. W.: Vertical Profiling of Aerosol Types Observed B., and Moshary, F.: ESA’s Lidar Missions Aeolus and Earth-
across Monsoon Seasons with a Raman Lidar in Penang CARE, The 29th International Laser Radar Conference (ILRC
Island, Malaysia, Aerosol Air Qual. Res., 16, 2843–2854, 29), 24-28 June 2019, Hefei, Peoples R China, 237, 01006,
https://doi.org/10.4209/aaqr.2015.07.0450, 2016. https://doi.org/10.1051/epjconf/202023701006, 2020a.
Hess, M., Koepke, P., and Schult, I.: Optical properties of Liu, J., Zheng, Y., Li, Z., Flynn, C., and Cribb, M.: Sea-
aerosols and clouds: The software package OPAC, B. Am. sonal variations of aerosol optical properties, vertical distri-
Meteorol. Soc., 79, 831–844, https://doi.org/10.1175/1520- bution and associated radiative effects in the Yangtze Delta
0477(1998)0792.0.Co;2, 1998. region of China, J. Geophys. Res.-Atmos., 117, D00K38,
Hu, Q., Goloub, P., Veselovskii, I., Bravo-Aranda, J.-A., Popovici, https://doi.org/10.1029/2011jd016490, 2012.
I. E., Podvin, T., Haeffelin, M., Lopatin, A., Dubovik, O., Liu, Q., He, Q., Fang, S., Guang, Y., Ma, C., Chen, Y.,
Pietras, C., Huang, X., Torres, B., and Chen, C.: Long-range- Kang, Y., Pan, H., Zhang, H., and Yao, Y.: Vertical distri-
transported Canadian smoke plumes in the lower stratosphere bution of ambient aerosol extinctive properties during haze
over northern France, Atmos. Chem. Phys., 19, 1173–1193, and haze-free periods based on the Micro-Pulse Lidar ob-
https://doi.org/10.5194/acp-19-1173-2019, 2019. servation in Shanghai, Sci. Total Environ., 574, 1502–1511,
Huang, J., Lin, B., Minnis, P., Wang, T., Wang, X., Hu, https://doi.org/10.1016/j.scitotenv.2016.08.152, 2017.
Y., Yi, Y., and Ayers, J. K.: Satellite-based assessment Liu, Q., Liu, X., Liu, T., Kang, Y., Chen, Y., Li, J.,
of possible dust aerosols semi-direct effect on cloud wa- and Zhang, H.: Seasonal variation in particle contribu-
ter path over East Asia, Geophys. Res. Lett., 33, L19802, tion and aerosol types in Shanghai based on satellite
https://doi.org/10.1029/2006gl026561, 2006. data from MODIS and CALIOP, Particuology, 51, 18–25,
Huang, J. P., Wang, T. H., Wang, W. C., Li, Z. Q., and Yan, H. https://doi.org/10.1016/j.partic.2019.10.001, 2020b.
R.: Climate effects of dust aerosols over East Asian arid and Liu, Y., Zhu, Q., Huang, J., Hua, S., and Jia, R.: Impact
semiarid regions, J. Geophys. Res.-Atmos., 119, 11398–11416, of dust-polluted convective clouds over the Tibetan Plateau
https://doi.org/10.1002/2014jd021796, 2014. on downstream precipitation, Atmos. Environ., 209, 67–77,
Huang, K., Zhuang, G., Lin, Y., Fu, J. S., Wang, Q., Liu, T., https://doi.org/10.1016/j.atmosenv.2019.04.001, 2019a.
Zhang, R., Jiang, Y., Deng, C., Fu, Q., Hsu, N. C., and Cao, Liu, Y., Hua, S., Jia, R., and Huang, J. P.: Effect of Aerosols on the
B.: Typical types and formation mechanisms of haze in an East- Ice Cloud Properties Over the Tibetan Plateau, J. Geophys. Res.-
ern Asia megacity, Shanghai, Atmos. Chem. Phys., 12, 105–124, Atmos., 124, 9594–9608, https://doi.org/10.1029/2019jd030463,
https://doi.org/10.5194/acp-12-105-2012, 2012. 2019b.
Jacobson, M. Z.: Studying the effects of aerosols on vertical Lu, X., Mao, F., Pan, Z., Gong, W., Zhu, Y., and Yang, J.: En-
photolysis rate coefficient and temperature profiles over an hancement of Atmospheric Stability by Anomalous Elevated
urban airshed, J. Geophys. Res.-Atmos., 103, 10593–10604, Aerosols During Winter in China, J. Geophys. Res.-Atmos., 125,
https://doi.org/10.1029/98jd00287, 1998. e2019JD031734, https://doi.org/10.1029/2019jd031734, 2020.
Jacobson, M. Z. and Kaufman, Y. J.: Wind reduction Luo, B., Minnett, P. J., Szczodrak, M., Nalli, N. R., and Morris, V.
by aerosol particles, Geophys. Res. Lett., 33, L24814, R.: Accuracy Assessment of MERRA-2 and ERA-Interim Sea
https://doi.org/10.1029/2006gl027838, 2006. Surface Temperature, Air Temperature, and Humidity Profiles
Kai, K., Nagata, Y., Tsunematsu, N., Matsumura, T., Kim, H.- over the Atlantic Ocean Using AEROSE Measurements, J. Cli-
S., Matsumoto, T., Hu, S., Zhou, H., Abo, M., and Nagai, mate, 33, 6889–6909, https://doi.org/10.1175/jcli-d-19-0955.1,
T.: The Structure of the Dust Layer over the Taklimakan 2020.
Deser during the Dust Storm in April 2002 as Observed Us- Lv, L., Xiang, Y., Zhang, T., Chai, W., and Liu, W.: Compre-
ing a Depolarization Lidar, J. Meteorol. Soc. Jpn., 86, 1–16, hensive study of regional haze in the North China Plain with
https://doi.org/10.2151/jmsj.86.1, 2008. synergistic measurement from multiple mobile vehicle-based li-
Kalluri, R. O. R., Zhang, X., Bi, L., Zhao, J., Yu, L., and Kotalo, dars and a lidar network, Sci. Total Environ., 721, 137773,
R. G.: Carbonaceous aerosol emission reduction over Shandong https://doi.org/10.1016/j.scitotenv.2020.137773, 2020.
province and the impact of air pollution control as observed Ma, X., Wang, C., Han, G., Ma, Y., Li, S., Gong, W., and
from synthetic satellite data, Atmos. Environ., 222, 117150, Chen, J.: Regional Atmospheric Aerosol Pollution Detection
https://doi.org/10.1016/j.atmosenv.2019.117150, 2020. Based on LiDAR Remote Sensing, Remote Sens., 11, 2339,
Kim, M.-H., Omar, A. H., Tackett, J. L., Vaughan, M. A., Winker, https://doi.org/10.3390/rs11202339, 2019.
D. M., Trepte, C. R., Hu, Y., Liu, Z., Poole, L. R., Pitts, M. C., Masonis, S. J.: An intercomparison of aerosol light extinction and
Kar, J., and Magill, B. E.: The CALIPSO version 4 automated 180◦ backscatter as derived using in situ instruments and Raman
aerosol classification and lidar ratio selection algorithm, At- lidar during the INDOEX field campaign, J. Geophys. Res., 107,
8014, https://doi.org/10.1029/2000jd000035, 2002.
Atmos. Chem. Phys., 21, 5377–5391, 2021 https://doi.org/10.5194/acp-21-5377-2021T. Liu et al.: Long-term variation in aerosol lidar ratio in Shanghai 5389
McComiskey, A., Schwartz, S. E., Schmid, B., Guan, H., Lewis, E. Novitsky, E. J. and Philbrick, C. R.: Multistatic lidar profiling
R., Ricchiazzi, P., and Ogren, J. A.: Direct aerosol forcing: Cal- of urban atmospheric aerosols, J. Geophys. Res.-Atmos., 110,
culation from observables and sensitivities to inputs, J. Geophys. D07S11, https://doi.org/10.1029/2004jd004723, 2005.
Res., 113, D09202, https://doi.org/10.1029/2007jd009170, 2008. Omar, A. H., Winker, D. M., Vaughan, M. A., Hu, Y., Trepte,
Mehta, M., Singh, N., and Anshumali: Global trends of columnar C. R., Ferrare, R. A., Lee, K.-P., Hostetler, C. A., Kit-
and vertically distributed properties of aerosols with emphasis taka, C., Rogers, R. R., Kuehn, R. E., and Liu, Z.: The
on dust, polluted dust and smoke – inferences from 10-year long CALIPSO Automated Aerosol Classification and Lidar Ratio
CALIOP observations, Remote Sens. Environ., 208, 120–132, Selection Algorithm, J. Atmos. Ocean. Tech., 26, 1994–2014,
https://doi.org/10.1016/j.rse.2018.02.017, 2018. https://doi.org/10.1175/2009jtecha1231.1, 2009.
Mishchenko, M. I., Cairns, B., Hansen, J. E., Travis, L. D., Burg, R., Painemal, D., Clayton, M., Ferrare, R., Burton, S., Josset, D.,
Kaufman, Y. J., Vanderlei Martins, J., and Shettle, E. P.: Moni- and Vaughan, M.: Novel aerosol extinction coefficients and li-
toring of aerosol forcing of climate from space: analysis of mea- dar ratios over the ocean from CALIPSO–CloudSat: evalua-
surement requirements, J. Quant. Spectrosc. Ra., 88, 149–161, tion and global statistics, Atmos. Meas. Tech., 12, 2201–2217,
https://doi.org/10.1016/j.jqsrt.2004.03.030, 2004. https://doi.org/10.5194/amt-12-2201-2019, 2019.
Müller, D.: Saharan dust over a central European EARLINET- Papagiannopoulos, N., Mona, L., Amodeo, A., D’Amico, G., Gumà
AERONET site: Combined observations with Raman li- Claramunt, P., Pappalardo, G., Alados-Arboledas, L., Guerrero-
dar and Sun photometer, J. Geophys. Res., 108, 4345, Rascado, J. L., Amiridis, V., Kokkalis, P., Apituley, A., Baars, H.,
https://doi.org/10.1029/2002jd002918, 2003. Schwarz, A., Wandinger, U., Binietoglou, I., Nicolae, D., Bortoli,
Müller, D., Ansmann, A., Mattis, I., Tesche, M., Wandinger, U., D., Comerón, A., Rodríguez-Gómez, A., Sicard, M., Papayannis,
Althausen, D., and Pisani, G.: Aerosol-type-dependent lidar ra- A., and Wiegner, M.: An automatic observation-based aerosol
tios observed with Raman lidar, J. Geophys. Res., 112, D16202, typing method for EARLINET, Atmos. Chem. Phys., 18, 15879–
https://doi.org/10.1029/2006jd008292, 2007. 15901, https://doi.org/10.5194/acp-18-15879-2018, 2018.
Murayama, T., Okamoto, H., Kaneyasu, N., Kamataki, H., and Pappalardo, G., Amodeo, A., Pandolfi, M., Wandinger, U., Ans-
Miura, K.: Application of lidar depolarization measurement mann, A., Bosenberg, J., Matthias, V., Amiridis, V., De Tomasi,
in the atmospheric boundary layer: Effects of dust and sea- F., Frioud, M., Larlori, M., Komguem, L., Papayannis, A., Roca-
salt particles, J. Geophys. Res.-Atmos., 104, 31781–31792, denbosch, F., and Wang, X.: Aerosol lidar intercomparison in the
https://doi.org/10.1029/1999jd900503, 1999. framework of the EARLINET project. 3. Raman lidar algorithm
Murayama, T., Müller, D., Wada, K., Shimizu, A., Sekiguchi, for aerosol extinction, backscatter, and lidar ratio, Appl. Opt., 43,
M., and Tsukamoto, T.: Characterization of Asian dust and 5370–5385, https://doi.org/10.1364/ao.43.005370, 2004.
Siberian smoke with multi-wavelength Raman lidar over Tokyo, Pietruczuk, A. and Podgorski, J.: The lidar ratio derived from sun-
Japan in spring 2003, Geophys. Res. Lett., 31, L23103, photometer measurements at Belsk Geophysical Observatory,
https://doi.org/10.1029/2004gl021105, 2004. Acta Geophys., 57, 476–493, https://doi.org/10.2478/s11600-
Newsom, R. K., Turner, D. D., Mielke, B., Clayton, M., Fer- 009-0006-9, 2009.
rare, R., and Sivaraman, C.: Simultaneous analog and photon Qi, Y., Ge, J., and Huang, J.: Spatial and temporal distribution of
counting detection for Raman lidar, Appl. Opt., 48, 3903–3914, MODIS and MISR aerosol optical depth over northern China and
https://doi.org/10.1364/ao.48.003903, 2009. comparison with AERONET, Chinese Sci. Bull., 58, 2497–2506,
Nicolae, D., Donovan, D., Zadelhoff, G.-J., Daou, D., Wandinger, https://doi.org/10.1007/s11434-013-5678-5, 2013.
U., Makoto, A., Vassilis, A., Balis, D., Behrendt, A., Com- Ramanathan, V., Chung, C., Kim, D., Bettge, T., Buja, L., Kiehl,
eron, A., Gibert, F., Landulfo, E., McCormick, M. P., Senff, J. T., Washington, W. M., Fu, Q., Sikka, D. R., and Wild, M.:
C., Veselovskii, I., and Wandinger, U.: Earthcare atlid ex- Atmospheric brown clouds: impacts on South Asian climate and
tinction and backscatter retrieval algorithms, The 28th In- hydrological cycle, P. Natl. Acad. Sci. USA, 102, 5326–5333,
ternational Laser Radar Conference, 25–30 June 2017, Po- https://doi.org/10.1073/pnas.0500656102, 2005.
litehnica Univ Bucharest, Bucharest, ROMANIA, 176, 02022, Randel, W. J., Park, M., Emmons, L., Kinnison, D., Bernath, P.,
https://doi.org/10.1051/epjconf/201817602022, 2018. Walker, K. A., Boone, C., and Pumphrey, H.: Asian monsoon
Nie, W., Ding, A. J., Xie, Y. N., Xu, Z., Mao, H., Kermi- transport of pollution to the stratosphere, Science, 328, 611–613,
nen, V.-M., Zheng, L. F., Qi, X. M., Huang, X., Yang, X.- https://doi.org/10.1126/science.1182274, 2010.
Q., Sun, J. N., Herrmann, E., Petäjä, T., Kulmala, M., and Fu, Reagan, J. A., Apte, M. V., Ben-David, A., and Herman, B. M.:
C. B.: Influence of biomass burning plumes on HONO chem- Assessment of Aerosol Extinction to Backscatter Ratio Measure-
istry in eastern China, Atmos. Chem. Phys., 15, 1147–1159, ments Made at 694.3 Nm in Tucson, Arizona, Aerosol Sci. Tech.,
https://doi.org/10.5194/acp-15-1147-2015, 2015. 8, 215–226, https://doi.org/10.1080/02786828808959184, 1988.
Noh, Y. M., Kim, Y. J., Choi, B. C., and Murayama, T.: Aerosol li- Reid, J. S., Hobbs, P. V., Ferek, R. J., Blake, D. R., Mar-
dar ratio characteristics measured by a multi-wavelength Raman tins, J. V., Dunlap, M. R., and Liousse, C.: Physical, chem-
lidar system at Anmyeon Island, Korea, Atmos. Res., 86, 76–87, ical, and optical properties of regional hazes dominated by
https://doi.org/10.1016/j.atmosres.2007.03.006, 2007. smoke in Brazil, J. Geophys. Res.-Atmos., 103, 32059–32080,
Noh, Y. M., Kim, Y. J., and Müller, D.: Seasonal characteristics https://doi.org/10.1029/98jd00458, 1998.
of lidar ratios measured with a Raman lidar at Gwangju, Ko- Sajadi, M. M., Habibzadeh, P., Vintzileos, A., Shokouhi,
rea in spring and autumn, Atmos. Environ., 42, 2208–2224, S., Miralles-Wilhelm, F., and Amoroso, A.: Tempera-
https://doi.org/10.1016/j.atmosenv.2007.11.045, 2008. ture, Humidity, and Latitude Analysis to Estimate Po-
tential Spread and Seasonality of Coronavirus Disease
https://doi.org/10.5194/acp-21-5377-2021 Atmos. Chem. Phys., 21, 5377–5391, 2021You can also read